Abstract-- Split window technique has been applied in this study to extract Land Surface Temperature (Ts) as a step leading to the retrieval of surface soil moisture and evapotranspiration over four study areas in Perak Tengah& Manjong, where the areas were selected according to the difference in surface cover type. Multiple NOAA/AVHRR images throughout June-August (2009) were acquired over the study area and processed; measured ground air temperature data (Ta) for the targeted areas were collected as well. Normalized Difference Vegetation Index (NDVI) and land surface Emissivity (ε) were calculated from image visible bands 1&2. The brightness temperature from bands 4&5 was then used with ε to derive Ts using three different split window algorithms. The results showed a good correlation between satellite estimated Ts and measured Ta especially when Uliveri
algorithm was applied over the agricultural area with R2 reaching
87%. The application of the three formulas produced results that are in agreement with one another with accuracy ranges between 90 – 99%. This ensures the usefulness of using Uliveri, and
Becker over the study area. A reasonable negative relationship also was found between NDVI and Ts over the uniform vegetation covers, indicating the applicability/suitability of the so called ―Triangle method‖.
Index Term— Land surface temperature, NOAA images, split-window techniques, remote sensing, surface cover types.
I. OVERVIEW AND BACKGROUND INFORMATION
Land Surface Temperature (Ts) is a good indicator of the energy balance at the Earth’s surface and the so-called greenhouse effect because it is one of the key parameters in the physics of land-surface processes on a regional as well as global scale
.
It combines the results of surface-atmosphere interactions and energy fluxesbetween the atmosphere and the ground [1]. Therefore, it is required for a wide variety of climate, hydrologic, ecological and biogeochemical studies [2]. Ts is an important parameter in the studies of urban thermal environment and dynamics. Ts modulates the air temperature of the lower layer of urban atmosphere, and is a primary factor in determining surface radiation and energy exchange, the internal climate of buildings, and human comfort in the cities [3]. The physical properties of varioustypes of urban surfaces, their color, the sky view factor, street geometry, traffic loads, and anthropogenic activities are important factors that determine Ts in the urban environments [4]. The Ts of urban surfaces corresponds closely to the distribution of land use and land cover (LULC) characteristics [5; 6;7; 8] Satellite-measured surface temperature may also be used to improve models and methods for evaluating land-surface energy balance. For making decisions in agriculture and irrigation processes, the canopy temperature may also be used to evaluate water requirements of crops, to determine lands, and forests evapotranspiration.
There have been considerable advances in the estimation of land surface environmental conditions from satellite observations, particularly from thermal infrared remote sensing data [9]. Traditionally, ground-based meteorological observations have been used in biospheric and hydrologic modeling. Satellites provide higher spatial resolution data over the entire earth, and are especially important over isolated locations where meteorological observations are sparse. In addition, most measuring techniques are time consuming; instruments must be calibrated for different types of soils, life of devices is limited and some of them are expensive. This makes the use of satellite techniques very valuable and applicable. The study attempts to estimate the surface temperature using three well known split-window techniques, on the light of the impact of four variable surface cover types within an area represented in the retrieval of land surface temperatures (Ts) from satellite images using the Normalized Difference Vegetation Index (NDVI) and surface emissivity (ε) for Perak Tengah andManjong regions (Malaysia), which contains four ground stations: Sitiawan, Pusat Pertanian Titi Gantong, Pusat Pertanian Lekir and Mardi Parit. Three split window algorithms have been applied to find an optimal algorithm for estimatingsurface temperatures.
Split window technique
Split window technique was first developed for the estimation of sea surface temperature from AVHRR data [10; 11; 12; 13; 14]. [15] is one of the pioneers in applying split
The Use and Evaluation of Split-Window
Techniques for NOAA/AVHRR Surface
Temperature Extraction over Different Surface
Covers: case study (Perak Tengah & Manjong)
area, Malaysia
Hassaballa A. A. and A. B. Matori
window technique for Ts retrieval. Several split window techniques have been generated in terms of various considerations to the effect of the atmosphere and the emitting surface [16; 17; 18]. They are derived from the equation of thermal radiation and its transfer through the atmosphere [19]. Many modifications to algorithm of [15] have been published since mid-1980. [20] added the satellite zenith observation θ and surface emissivity εj of channel j into the radiation transfer equation [19].
The study area
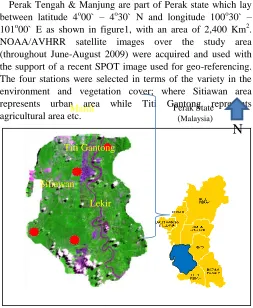
Perak Tengah & Manjung are part of Perak state which lay between latitude 4o00` – 4o30` N and longitude 100o30` – 101o00` E as shown in figure1, with an area of 2,400 Km2. NOAA/AVHRR satellite images over the study area (throughout June-August 2009) were acquired and used with the support of a recent SPOT image used for geo-referencing. The four stations were selected in terms of the variety in the environment and vegetation cover; where Sitiawan area represents urban area while Titi Gantong represents agricultural area etc.
Fig. 1. Perak Tengah & Manjung area, the study areas are shown in the inset.
II. METHOD
In order to process the acquired AVHRR images for surface temperature extraction, subset area has been delineated surrounding each weather station and any spatial computation performed within each subset area was assumed to represent the average value of the sub area pixels. The following flowchart (fig. 2) describes the steps for retrieving surface temperature from NOAA/AVHRR.
Fig. 2. Flow chart of Ts retrieval
NDVI
The NDVI measurements were made with a combined red and near-infrared radiometer, developed at the NASA/Goddard Space Flight Center, which measures the reflected radiation in the bands (0.58-0.68 µm) and (0.73-1.1 µm).
)
1
(
RED
NIR
RED
NIR
NDVI
Where, NIR and RED are the near-infrared and red reflectances, respectively.
Surface emissivity (ε)
Emissivity was estimated via an empirical algorithm based on the relationship between emissivity and the logarithm of NDVI [21] in the range [0.955, 0.985]. The emissivity of channel 4 (ε4), the emissivity of channel 5 (ε5) and the emissivity difference of channels 4 and 5 (Δε), are defined as follows:
)
5
(
2
)
(
)
4
(
)
3
(
)
(
01344
.
0
01019
.
0
)
2
(
)
(
029
.
0
9897
.
0
5 4 4 5 4
NDVI
Ln
NDVI
Ln
Split-window algorithm for deriving T
The general form of the split-window equation can be written as:
)
6
(
)
(
4 54
A
T
T
B
T
Ts
Where,
Ts represents the land surface temperature, T4 and T5 represent the brightness temperature for channels 4 and 5 respectively, A and B are the coefficients determined by the impact of atmospheric conditions and other related factors on the thermal spectral radiance, and its transmission in channels 4 and 5.
The parameters A0, P and M were given by Becker [2]. A simplified algorithm with the two coefficients A and B is proposed as follows:
Images from NOAA satellite
Format: text, level 1b Sensor: NOAA 17&18
Image Calibration
Bands 1&2: percent reflection Bands 3&4: brightness temperature
Building Geometry files
Calculate the value of each
pixel
Georeferenced Image
With identified Lat/Long
SPOT Image
Finer resolution for georeferencing
Subset area delineation
NDVI and ε extraction
(Visible bands 1&2)
TB4&TB5
(Thermal bands 4&5)
Retrieval of Ts using formulas:
Becker and Li (1990)
Sobrino et al., (1993) * Ulivieri et al., (1994)
N
Perak State (Malaysia)
Lekir Mardi Parit
Titi Gantong
) 8 ( ) 1 ( ) 7 ( 2 / ) ( 4
0
P T A B P M A
Where the parameters A0, P and M have been calculated by [2] as: ) 10 ( 33 . 38 ) 1 ( 98 . 3 26 . 6 ) 9 ( 482 . 0 ) 1 ( 15616 . 0 1 274 . 1 0 M P A
According to Sobrino formula [22]:
) 11 ( 53 ) 1 ( 53 ) ( 46 . 0 ) ( 06 . 1 4 2 5 4 5 4 4
T T T T T
T
While according to Uliveri formula [23]:
)
12
(
75
)
1
(
48
)
(
8
.
1
4 54
T
T
T
T
III. RESULTS
The estimated surface temperature (Ts) values were correlated against measured ground air temperature (Ta) collected from the meteorological stations in the study area during the period of image acquisition. The applied split window algorithms were carried out by NDVI and emissivity over the four selected areas with different surface natures. The average values of NDVI and Emissivity over the areas are tabulated in table I. Large RMSE values for NDVI, 0.17 and 0.18 are noted over Mardi and Titi Gantong stations respectively, which is due to the variety of surface types shared by residential areas, forests and some farms particularly in Mardi area.
TABLE I
THE AVERAGE VALUES OF NDVI AND Ε OVER THE STUDY AREAS
STATION
NDVI ε
Avg. RMSE Avg. RMSE
SITIAWAN 0.14 0.10 0.94 0.01
TITI GANTONG 0.23 0.18 0.95 0.02
MARDI 0.26 0.17 0.95 0.02
LEKIR 0.30 0.15 0.96 0.01
Surface Temperature
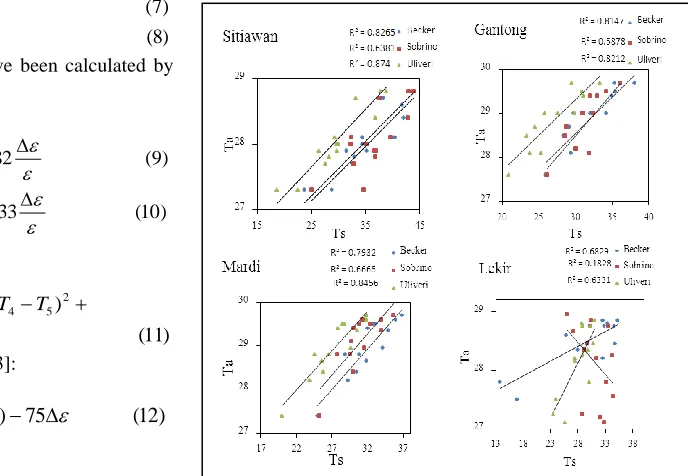
The derivation of surface temperature (Ts) was achieved by using the formulas by Becker, Sobrino and Uliveri in the four study areas, and then was correlated against the values of air temperature (Ta) measured at ground stations distributed in the respective study area. It could be distinguished that the satellite based surface air temperature relationship shows reasonable results (figure 3) in terms of evaluating the split-window techniques in a regression plot with the ambient air temperature, especially over areas with a uniform cover as well
Fig. 3. Regression plot of Ts-Ta using the three split-window techniques
as the agricultural area Titi Gantong, which witnesses similarity in Ts-Ta readings which is attributed to homogenous emission from vegetation cover, this supports the theorem that the canopy temperature will likely be near the local temperature Ta because of its low thermal mass [24]. Sitiawan area with high emission contributed by traffic, emission from built up surfaces, roads and machines resulted in surface temperature values that are similar to measured air temperature although the calculated surface temperature is slightly higher. On the other hand, the variable types of surface cover over Mardi produced different magnitudes of emissivity that resulted in a slight Ts-Ta bias; while the estimation of surface temperature over Lekir area is highly affected by the density of forests which resulted in unpredictable emission manner.
Some analysis suggest that the split-window technique for driving surface temperature tends to overestimate actual surface temperature by 4oC [25], while the mixed surface cover and the dense forests areas Mardi and Lekir respectively, witness some neutrality due to the heterogeneity of the surface cover.
IV. DISCUSSION
The average estimated surface temperature, standard error of measurement, and coefficient of determination R2 for each technique are tabulated alongside the measured ground air temperature in table II. The results tabulated in table II show a good correlation between measured air temperature and estimated surface temperature, especially when applying the split-window algorithms by Uliveri, and Becker. The results represent high adaptabilities with emitted radiation from surfaces particularly over Sitiawan, where high surface temperature values have been recorded. In an urban area like Sitiawan, emissions from build-up surfaces and machines as known produce Ts similar to Ta Vegetation density is an
(9)
important factor that influences heat balance near the ground. This is reflected in the Ts bias over areas with variable vegetation cover types as in Mardi and Lekir. While the agricultural land Titi Gantong with a uniform cover sees Ts relatively close to Ta with correlation coefficients R2 of: 59, 81 and 82% for Sobrino, Becker and Uliveri respectively. The RMS (ERROR) in Titi Gantong and Mardi is slightly small due to uniformity of the surface cover. In addition, it was also influenced by the vegetation temperature which is close to the ambient air temperature. , On the other hand, mixed surface
cover, the forests impervious and the residential nature over Lekir and Sitiawan respectively explain the bias in the observed temperature data, this could be justified as due to the mixed surface cover that causes a variety in NDVI values particularly for water bodies, and the impervious areas; because of that the brightness temperature is highly affected once the emissivity value is NDVI dependent.
Additionally, the density of the trees (canopy) over the forest areas attenuates the reflected radiation causing shadows which obstruct the emission from the ground surface.
TABLE II
AVERAGE VALUES OF ESTIMATED SURFACE TEMPERATURE (TS) AND AIR TEMPERATURE (TA) FOR EACH WEATHER STATION
Station Measured
ground air temperature,
Ta, (oC)
Estimated surface temperature, Ts, (oC)
Becker & Li (1990) Sobrino et al. (1993) Uliveri et al. (1994)
Avg. Ta RMSE Avg. Ts RMSE R2 Avg. Ts RMSE R2 Avg. Ts RMSE R2 Sitiawan 28.16 0.53 36.15 5.66 0.83 36.87 5.76 0.64 30.80 5.88 0.87
Titi Gantong 28.38 0.66 31.89 3.68 0.81 31.33 2.68 0.59 27.14 3.79 0.82
Mardi 28.70 0.64 32.01 3.22 0.79 30.91 2.76 0.67 27.32 3.41 0.85 Lekir 28.15 0.58 29.01 6.80 0.68 30.93 2.60 0.18 28.18 2.47 0.63
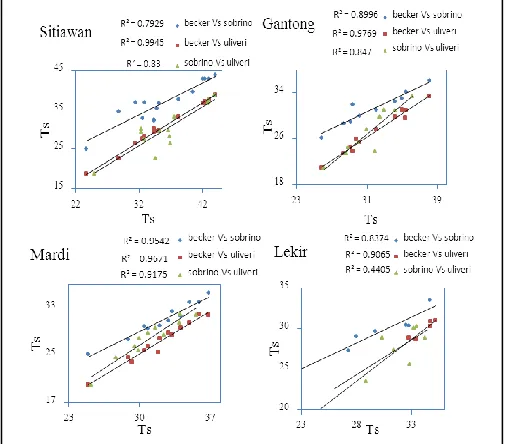
An implementation of Ts-Ts was done (fig. 4) among the applied split-window algorithms in order to check their accuracy to estimate Ts, Uliveri, and Becker analyzed the spectral data and found high compatibility and harmony in accordance of processing the reflected values. Figure 4 shows the workability of Uliveri and Becker in the estimation of the surface temperature over the study areas with R2: 99, 97.6, 96.7 and 90.6 for Sitiawan, Titi Gantong, Mardi and Lekir, respectively.
Fig. 4. Implementation of the applied split-window algorithms over the study area
NDVI-Ts relationship
As a step to examine the accuracy of the split-window technique over different surface covers, the estimated NDVI is
plotted against the estimated surface temperature (fig. 5). A strong negative correlation is found between NDVI and Ts especially over the agricultural area Titi Gantong. This correlation can be attributed to latent heat flux canopy resistance to transpiration and soil moisture as in [26; 27; 28], resulting a typical Universal Triangle which was introduced earlier by [29]. In a Universal triangle, the vegetation radiometric temperature is always close to air temperature, but the surface radiant temperature over bare soil can vary depending on the soil water content. This implies that the spatial variation in surface radiant temperature will be small (except for emission from underlying bare soil) over a full vegetation, but will vary from warm to cold while surface moisture availability goes from zero to one for bare soil. The different spectral signatures over forest area (Lekir) generate multiple scattered plots of NDVI as well as the variable values of NDVI over the residential area Sitiawan.
V. CONCLUSIONS
Three split window algorithms have been applied to find an optimal algorithm for estimating surface temperatures from thermal bands of AVHRR data in four selected areas. Also, correlation coefficients between measured ground air temperature (Ta) and land surface temperature (Ts) estimated by the split window algorithms were compared. Furthermore, comparisons between the three applied algorithms were achieved to examine their accuracy in Ts estimation. Finally, NDVI-Ts relationship was plotted to study the impact of vegetation and moisture status in Ts and Ta assessment. The results of the achieved work could be summarized as follows:
- The applicability of using split window technique to estimate Ts has been investigated by comparing the surface temperature estimated by three of the best split window against actual measured ground temperature. The accuracy resulted in correlation coefficient of 99%, 97.6%, 97.7% and 90.6% indicating to the preference of using Uliveri and Becker algorithms.
- The accuracy of the applied algorithms is influenced by the variation in surface cover as seen in the urban and impervious area of Sitiawan producing error ≈5oC. - Although the correlations between the estimated surface
temperature and measured air temperature for Sitiawan and Titi Gantong are reasonable, there was some abnormality in the reflected fraction from the surface for Mardi and Lekir areas. This is due to the variety in vegetation density over Mardi, as well as the shadow effect of the forests and palm trees over Lekir areas which obstruct the surface emissivity reflection. In addition, the coarse resolution of the images (pixel size 1.1 km X 1.1 km) does not allow good match between the estimated and measured values.
The study attempts to estimate the surface temperature using three well known split-window techniques, on the light of the impact of four variable surface cover types within the area.
Further works can be directed to examine the effect of land surface temperature and its role in assessing the ambient air temperature because Ts modulates the air temperature of the lower layer of urban atmosphere, also Ts can be used in assessing the surface moisture statement within variable surface depths over multiple land use-land cover types as well as, The study also can continue to use the satellite estimated surface temperature and soil moisture as input parameters to estimate the evapotranspiration over the study area and generate a relationship that could be used in any climatic application over the area.
ACKNOWLEDGEMENT
The authors acknowledge the support given by Universiti Teknologi PETRONAS in perusing this study. The authors also acknowledge the assistance provided by the Malaysian Agency for Remote Sensing for access to the satellite images. Further, the first author gratefully acknowledges the financial support provided by Educational Sponsorship Unit of PETRONAS as part of the PhD scholarship.
REFERENCE
[1] Z. Wan, “MODIS Land-Surface Temperature Algorithm Theoretical Basis Document,” Institute for Computational Earth System Science University of California, Santa Barbara Santa Barbara, CA, 1999, 93106-3060.
[2] F. Becker, Z. L. Li, “Towards a local split window method over land surface,” International Journal of Remote Sensing, 1990, 3, pp. 369-393.
[3] J. A. Voogt, T. R. Oke, “Effects of urban surface geometry on remotely sensed surface temperature,”. International Journal of Remote Sensing 1998, 19 (5), 895_920
[4] A. Chudnovsky, E. Ben-Dor, and H. Saaroni, “Diurnal thermal behavior of selected urban objects using remote sensing measurements,” Energy and Buildings 2004, 36 (11), 1063_1074. [5] C. P. Lo, D. A. Quattrochi, and J. C Luvall, “Application of
high-resolution thermal infrared remote sensing and GIS to assess the urban heat island effect,” International Journal of Remote Sensing 1997, 18 (2), 287_304.
[6] Q. Weng, “A remote sensing-GIS evaluation of urban expansion and its impact on surface temperature in the Zhujiang Delta, China,” International Journal of Remote Sensing 2001, 22 (10), 1999_2014. [7] Q. Weng, “Fractal analysis of satellite-detected urban heat island
effect,” Photogrammetric Engineering and Remote Sensing 2003, 69 (5), 555_566.
[8] Q. Weng, D. Lu, and J. Schubring, “Estimation of land surface temperature vegetation abundance relationship for urban heat island studies,” Remote sensing of Environment 2004, 89 (4), 467_483. [9] S.W. Running, and R. R. Nemani, “Relating seasonal patterns of the
AVHRR vegetation index tosimulated photosynthesis and transpiration of forests in different climates,” Remote Sen. Environ. 1988, 24: 347-67.
[10] C. G. Prabhakara,. Dalu and V. G. Kunde, “Estimation of sea temperature from remote sensing in the 11 to13µm window region,”J. Geophys. Res. 1974, 79,5039-5044,.
[11] L. M. McMillin, “Estimation of sea surface temperatures from two infrared window measurements with different absorption.”. J. Geophys. Res. 1975, 80, 5113-5117,.
[12] P. Y. Deschamps, and T. Phulpin, “Atmospheric correction of infrared measurements of sea surface temperature using channels at 3.7, 11 and 12 µm,” Boundary_Layer Meteorol. 1980, 18, 131 143.
[13] E. P. McClain, W. G. Pichel and C. C. Walton, “Comparative performance of AVHRR-based multichannel sea surface temperature,” J. Geophys. Res. 1984, 90, 11587-11601.
[14] I. J. Barton, “Satellite derived sea surface temperature: A comparison between operational, theoretical and experimental algorithms,” J. Appl., Meteorol. 1992, 31, 432-442.
[15] J. C. Price, “Land surface temperature measurements from the split window channels of the NOAA 7 advanced very high resolution radiometer,” J. Geophys. Res. 1984, 89, 7231-7237.
[16] D. I. Cooper, and G. Asrar, “Evaluating atmospheric correction models for retrieving surface temperatures from the A VHRR over a tall-grass prairies,” Remote Sens. Environ. 1989, 27, 93-102.
[17] J. A. Sobrino, and V. Caslles, “A methodology for obtaining the crop temperature from NOAA-9 AVHRR data,” Int. J. Remote Sens. 1991, 12, 2461-2475.
[18] Y. H. Kerr, J. P. Lagouarde, and I. Imbernon, “Accurate land surface temperature retrieval from A VHRR data with use of an improved split window algorithm,” Remote Sens. Environ1992, 41, 197-209. [19] Zaihao Qin, Giorgio Dall Olmo and Arnon Karnieli, “Derivation of
split window algorithm and its sensitivity analysis for retrieving land surface temperature from NOAA- advanced very high resolution radiometer,” J. Geophys. Res. Research2001, 106, D19, 22655 22670. [20] C. Coli, V. Caselles, A. Sobrino, and E. Valor, “On the atmospheric
dependence of the split-window equation for land surface temperature,” Int. J. Remote Sens. 1994, 15, 105-122.
(6), 1119-1131.
[22] J. A.Sobrino, Z. L. Li, M. P. Stall, and F. Becker, “Impact of the atmospheric transmittance and total water vapour content in the algorithms for estimating sea surface temperature,” IEEE Trans. Ceosci. Remote Sens. 1993, 31, pp.946-958.
[23] C. Ulivieri, M. M. Castronouvo, R. Francioni, and A. Cardillo, “A split window algorithm for estimating land surface temperature from satellites,” Advances in Space Research, 1994, 3, pp.59-65,
[24] H. Prihodko, S. N. Goward, “Estimation of air temperature from remotely sensed surface observations,” Remote Sensing of Environment. 1997, Vol. 60, PP. 335-346.
[25] S. N. V. Kalluri, and R. O. Dubayah, “comparison of atmospheric correction model for thermal bands of the advanced very high radiometer,” J. Geophys. Rs. 1995, 100:25. 411-25, 418.
[26] R. C. G. Smith, and B. J. Choudhury, “On the correlation of indices of vegetation and surface temperature over southeastern Australia,” Int. J. Remote Sens. 1990, 11:2113-2120.
[27] R. C. G. Smith, and B. J. Choudhury, “Analysis of normalized difference and surface temperature observations over southeastern Australia,” Int. Remote Sens. 1991, 12:2021-2044.
[28] T. N. Carlson, R. R. Gillies, and E. M. Perry, “A method to make use of thermal infrared temperature and NDVI measurements to infer surface soil water content and fractional vegetation cover,” Remote Sens. Environ. 1994, 9:161-173.
[29] J. C. Price, “Using spatial context data to infer regional scale evapotranspiration,” IEEE transaction on Geosciences and Remote Sensing 1990, 28, 940-948.
CURRICULUMVITAE
CORRESPONDING AUTHOR
SURNAME: HASSABALLA
FIRST NAME:ABDALHALEEM
OCCUPATION: STUDENT
CURRENT POSITION: PHD RESEARCH STUDENT
ORGANIZATION: UNIVERSITI TEKNOLOGI PETRONAS,BANDAR
SERI ISKANDAR,TRONOH,PERAK,MALAYSIA.
E-MAIL:[email protected]
ACADEMIC QUALIFICATIONS: MASTER OF SCIENCE IN WATER
RESOURCES ENGINEERING,UNIVERSITI OF KHARTOUM, SUDAN. BACHELOR OF SCIENCE (HONS) IN AGRICULTURAL
ENGINEERING,UNIVERSITY OF KHARTOUM, SUDAN.
RESEARCH AREA WATER RESOURCES, REMOTE SENSING OF
ENVIRONMENT, SOIL MECHANICS.
SECOND AUTHOR
Surname:
Matori
First Name: Abdul-NasirOccupation: Lecturing
Current Position: Associate Professor
Organization: University Teknologi Petronas, Bandar Seri Iskandar, Tronoh, Perak, Malaysia.
E-mail: [email protected]
Academic Qualifications : Doctor of Philosophy, University of Newcastle upon Tyne. Bachelor of Science (Hons) in Nuclear Science, Universiti Kebangsaan