A Render Data Optimized Organization Strategy Based on Kalman Prediction
6
0
0
Full text
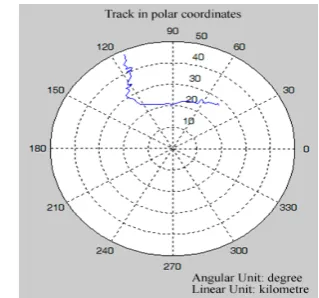
(2) 3288. JOURNAL OF COMPUTERS, VOL. 8, NO. 12, DECEMBER 2013. Z (k ). ∑. xˆ(k + 1/ k ). ∑. G (k ). Thus,. A z −1. C Figure 1.. ⎧ X ( k ) = AX ( k − 1) + W ( k ) . ⎨ ⎩ Z ( k ) = CX ( k ) + V ( k ). (5). ⎧ R ( k ) = E [V ( k )V ( k ) ] ⎨ ⎩Q ( k ) = E [W ( k )W ( k ) ]. (6). and. Vector Kalman filter structure.. T. T. According to the viewpoint motion state and current observation viewpoint position, it is possible to predict the viewpoint position, organize and schedule rendering data. The proposed algorithm can be shown in Fig. 2.. Figure 2.. A and C can be calculated by the formula (4), W and V respectively stands for the system noise and observation noise, which are impacted by the viewpoint position and movement state. A is a 9 × 9 order matrix, and C is a 3 × 9 order matrix. According to current viewpoint position measure values and equations (1) (2) (3), next moment predicted values Xˆ ( k + 1 / k ) can be calculate, and. the prediction MSE is P ( k + 1 / k ) . Xˆ ( k + 1 / k ) contains the viewpoint position and direction information next time. X(k) dimensions is not fixed, and it can be determined by actual situation. If the viewpoint movement maneuverability became strong, it may be appropriate to increase the number of dimensions of the X(k), that is, considering the jerk impact, and so on. Otherwise, considering the velocity is enough, which reducing the viewpoint prediction calculation amount. To get the next viewpoint position, a Kalman prediction experiments is carried out, its result is show in Fig. 3,. Algorithm processes.. The next viewpoint position is determined by the current position and the current viewpoint motion state; the current viewpoint position is obtained by the aircraft equipment, and the motion state can be calculated from history records; then it can predict the next viewpoint position, and estimate scheduling region. The level of detail is chose according to the screen resolution, and real time loading and release are carried out at last. III. VIEWPOINT PREDICTION MODELING Considering viewpoint velocity and acceleration impact position prediction, the viewpoint movement states at time are denoted as Ox , O y , Oz , v x , v y , v z , a x , a y , a z , represented by vector X(k) ,which show the. viewpoint position, velocity, and acceleration, etc. In three-dimensional scene, three parameters describe one parameter. Z(k) represents the measured position at time k. There are the following equations, ⎧O ( k ) = O ( k − 1) + v ( k − 1)t + 1 a ( k − 1)t + ω ( k − 1) x x x 1 ⎪ x 2 ⎪ ⎪… ⎪vx ( k ) = v x ( k − 1) + a x ( k − 1)t + ω4 ( k − 1) ⎪⎪ ⎨… ⎪ a x ( k ) = a x ( k − 1) + ω7 ( k − 1) ⎪ ⎪… ⎪ z (k ) = O (k ) + υ (k ) x x ⎪ x ⎪⎩… 2. © 2013 ACADEMY PUBLISHER. (4). Figure 3.. The flight track formed by positioning equipment.. Due to the limited accuracy of positioning equipments, the track cannot completely show the real aircraft flight track or position, and observed values jitter with real track-centered. So the viewpoints from positioning equipment are not the desired results; meanwhile aircraft position observed values jitter, which generate jittery visualization, and it is not suit for pilots. The blue solid line in Fig. 4 is generated from aircraft positions track forecasted by Kalman prediction, and the red points stands for observed position. It is clear that predicted position is located in the center of the positioning observed value, which is consistent with statistical law. Compare with observed values, the predicted positions conform to real aircraft's actual flight track better. If organize data based on current viewpoint positions, disk I/O delay and aircraft high speed.
(3) JOURNAL OF COMPUTERS, VOL. 8, NO. 12, DECEMBER 2013. movement, or high dynamic, will lead Visualization Navigation to render the scene what has already been flown past; and strict real-time requirement will cause frame dropping out. On the contrary, good prediction and organization next viewpoints render data can reduce or avoid above disadvantages.. 3289. B. Scheduling Region Calculation The observers are interest in viewpoint ambient terrains in Visualization Navigation, so the required organization rendering data should be a viewpointcentered circle; organized data like a crescent as shown in Fig. 3, and the viewpoint position is calculated by the Kalman prediction. Scheduling region range can be calculated by the viewpoint height and sight angle. What is shown in Equation (7). L = tan θ ⋅ h .. (7). In order to ensure that the organized data contains all required rendering data next moment, appropriate increasing prediction radius according to Kalman prediction MSE is enough. Organization radius ensures accuracy is around 98%.. Figure 4.. Predicted and observed positions contrast.. O k +2 ˆ O. k+2. Experimental results showed in Fig. 4 illustrate that Kalman prediction can forecast aircraft next position well; due to the aircraft broad view, the predicted position can replace the real viewpoint position.. ˆ O k +1. O k +1. ˆ O k Ok O k −1. IV. RENDERING DATA OPTIMIZED ORGANIZATION STRATEGY A. Equal Interval Orgnization Strategy After calculating next viewpoint position, good terrain data organization strategy is needed. An equal interval strategy is adopted, what schedules rendering data at set interval [7], is time interval between the two image frames. As shown in Fig. 5, at the moment, is viewpoint position, and next predicted position is. is the data set, at the moment, the data system desired is no more than . Organizing the data which are not in the cache, then at time all the required data have been transferred to the memory. Determining the new set of data based on current viewpoint and organizing rendering data are in the same way. Actually, it only needs to organize parts of data. Compared with traditional frame interval-based organization strategy, the new strategy is more stable and not easily impacted by other computing. There are several advantage, such as it can reduce page fault ratio in realtime rendering effectively, and be more easily combined with Kalman prediction. T(k-1). Figure 6.. Data organization based on viewpoint prediction.. The maximum vision range is influenced by earth curvature and calculated by equation (8); what is the maximum organization data. Lmax =. (r + h). 2. −r . 2. L is the farthest visibility, r is the earth radius, h denotes viewpoint height, which can be calculated by Kalman prediction.. ˆ O k. Ok. Fixed interval. τ. τ. τ. O k −1 organization Sk. organization Sk+1. viewpoint Ok-1. viewpoint Ok. Organization Sk+2. T. Viewpoint Ok+1. Sk-1 Sk. Sk-2. Organization. Figure 5.. Sk-1 – Sk-2. © 2013 ACADEMY PUBLISHER. Sk+1. Organization Sk – Sk-1. Equal Interval Organization Strategy. (8). Figure 7. Data organization strategies compare..
(4) 3290. JOURNAL OF COMPUTERS, VOL. 8, NO. 12, DECEMBER 2013. Compared with neighborhood region adventure organization strategy, the optimize organization strategy based on Kalman prediction can forecast next viewpoint positions more exactly and reduce organization data amount. As shown in, the black shadow is optimized strategy organization data, and oblique line presents optimized data, which are not need to organize. The above strategy determines next possible field of vision, nevertheless, it is impossible to watch the entire scene in organization circle. The front probability is maximum, both sides is the second, and the behind is minimum. Even in the same field of vision the interesting areas are also different: the areas near the viewpoint and the line of sight centerline are usually watched carefully; far and bias is on the contrary. So it is necessary to dynamically utilize the level of detail model (LOD).. Data blocks of first case are direct cast, and the latter two are visible nodes. By calculating projected area of visible node, the appropriate resolution LOD models into memory are closed to draw graphics. If the visible node projected area is greater than a certain set Smax, Smax front = 1 / 2Smax sides = 1 / 4Smax rear , its son nodes are treated as visible nodes and added in a set as node, otherwise the noise nodes was added [8]. What will not only to convey vision determine different resolution terrain data display, but also satisfied the accuracy and speed requirements. C. Data Organization Interval Calculation Rendering data organization interval should meet requirements as followed, • Organization data amount must not exceed the memory capacity limit. The organization data amount is equal to the sum of each frame data in the interval. As the size and resolution of each frame terrain data are different, it is not convenient to calculate the data amount; screen resolution estimate is adopted here. D = k ⋅ t ⋅ m ⋅ n ⋅ c ( a + b ⋅ ρ DOM / ρ DEM ) < Dlimit .. Figure 8.. Block-stratification data organization.. Based on above two points, a new organization strategy is proposed. As shown in Fig. 8, the center stands for viewpoint position. Side resolution and behind resolution is determined by observers head tilt and turn back probability. The scheduling region in Fig. 8 is constituted by four sight ranges. The four regions’ visibility judgment and LOD selection method is the same, except that the LOD selection standards are different. The front visible blocks judgment and LOD selection is chosen to illustrate. Visibility judgment is obtained by calculating the projection of terrain convex closure. Convex closure is the minimum convex polyhedron surrounding a terrain block. There are three relationships between convex closure projection and visible areas, thus out of, completely in, part in the visible areas. As shown in Figure X. Projection completely in the visible region; projection part in the visible region. As shown in Fig. 9.. (9). m, n denote the screen resolution, ρDOM is the digital orthophoto resolution, ρDEM is the Digital Elevation Model (DEM) resolution, c is a correction coefficient, which indicates the amount ratio of organization region data to display data, t denotes the organization interval, Dlimit denotes memory capacity limit. k denotes the frame number per second, a is the DOM data amount correspond with each pixel, b is the DOM data amount correspond with each elevation point. • In the organization interval, the viewpoint should move over the minimum organized terrain block.. vt > l min. (10). l denotes the minimum terrain block width which is independently organized. • 3, the organization data amount is less than the product of the hard disk transmission speed and organization interval. D = k ⋅ m ⋅ n ⋅ c ( a + b ⋅ ρ DOM / ρ DEM ) < T. (11). T denotes the transmission speed of the hard disk to memory. The factor is always true in the current conditions of computer hardware, DEM or DOM resolution. Then according to the factors above, appropriate organization radius and interval are determined. D. Data Release When the viewpoint moves past, to avoid the data amount exceeding memory capacity limit, data need to be released. An improved least recently used (LRU) algorithm is adopted to determine the data to be deleted [9] and priority is determined by formula (12). p = f + ktl .. Figure 9.. Terrain convex closure visible judgments.. © 2013 ACADEMY PUBLISHER. (12).
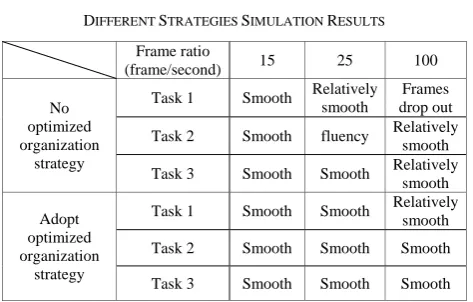
(5) JOURNAL OF COMPUTERS, VOL. 8, NO. 12, DECEMBER 2013. f is the frame number when the data block was scheduled at the last time; l is the LOD level number which schedules the terrain block, higher resolution smaller level number. t is scheduling time interval, k is the frame number per second, and the smaller p is, the higher priority it should be deleted. To improvement original method, taking into account the priority of different resolutions data to be deleted and multiplying by factor kt are adopted. Then the viewpoint moves past, its rearward retains parts of data, which high resolution is close to the viewpoint and low resolution is far away. V.. EXPERIMENT RESULT. Experiment platform was OSGEarth [10]. Based on the class addTill, prediction function was realized. Two experiments were conducted. A. Experiment I A aircraft model was imported ,which traced at the speed of 300 m/s, scene was set to move with the aircraft, as shown in Fig. 10.. Experiments show that, [3] cannot predict the next viewpoint position accurately. It is needed to expand organization region so as to ensure the next required data is in organization range, which may lead to transfer much data from external memory to memory, exceed the hardware processing capability, and frames drop out. Kalman prediction is set up on state space, importing state variables, which describes the system dynamic information at a higher level. Our rendering data optimized organization strategy can accurately predict viewpoint, and effectively reduce the organized data amount. Theoretically, the reducing data amount can be calculated by the formula (13). (13). As the case of 0.6 meters resolution terrain data and viewpoint movement speed 80m/s, it is able to save 18% resources. E is the saving ratio, v denotes viewpoint moving speed, and c is the organization data resolution. B. Experiment II Different redraw intervals were set and the impacts produced by data organization strategy were tested. The experiment results are shown in Table I,. © 2013 ACADEMY PUBLISHER. TABLE I. DIFFERENT STRATEGIES SIMULATION RESULTS Frame ratio (frame/second) No optimized organization strategy. Adopt optimized organization strategy. 15. 25. 100. Task 1. Smooth. Relatively smooth. Task 2. Smooth. fluency. Task 3. Smooth. Smooth. Task 1. Smooth. Smooth. Frames drop out Relatively smooth Relatively smooth Relatively smooth. Task 2. Smooth. Smooth. Smooth. Task 3. Smooth. Smooth. Smooth. 15 frames per second were adopted in experiments, which enabled users to feel the interaction and were the minimum display capability system required. 25 frames per second can achieve better real-time requirement, which were the scene rendering rate system required. Relatively smooth in TableⅠmeans there were frames dropping out sometimes. Task 1 showed viewpoint prediction and rendering data organization strategy made an obviously contribution to rendering efficiency. As high resolution terrain data was adopted, optimized organization strategy could meet the requirement of real-time smooth rendering, which is 25 frames per second. Task 2 and task 3 were tracks in mountains, resolutions are 32 meter. Due to the low resolution, their data amounts were small and experiments visualized well; our strategy advantages could be shown at the ratio of 100 frames per second. VI. SUMMARY. Figure 10. Simulation result. E = f (v × c) .. 3291. In the Visualization Navigation, the carrier position, such as aircraft, vehicles, is the viewpoint position, or there is a fixed function relationship. Therefore, the viewpoint positions can be obtained from the prediction of motion carrier tracks. Based on above considerations, the paper researched Kalman filter for track prediction, and applied it in rendering data organization. Experiments showed that the optimized organization strategy can improve rendering efficiency, especially at the high viewpoint movement speed. The proposed strategy can also be used in other relative areas, such as visual scene roaming. ACKNOWLEDGMENT This work was supported by the National Natural Science Foundation of China (Grant No.61202129). REFERENCES [1] Z. Li, “The gorgeous 3D Visual navigation,” Science in 24 Hours, no.10, pp. 47-48, November 2009. [2] I. C. Yiu and V. Amitabh, “Saliency-assisted navigation of very large landscape images,” IEEE Tran on Visualization and Computer Graphics. vol. 17, no. 12, pp. 1737–1746, December 2011. [3] Y. Gao, “Research on interactive out-of-core rendering for large-scale and complex environments,” National.
(6) 3292. [4]. [5] [6]. [7]. [8]. [9]. [10]. JOURNAL OF COMPUTERS, VOL. 8, NO. 12, DECEMBER 2013. University of Defense Technology, Changsha, China, March 2007. K. A. Krame, S. C. Stubberud, and J. A. Geremia, “Target registration correction using the neural extended kalman filter,” IEEE Transactions on Instrumentation and Measurement. vol. 59, no. 7, pp. 1964-1971, July 2010. W. H. Yang, “Multi-sensor data fusion and application,” Xidian University Press, Xi’an China, April 2004. P. Qu, Z. F. Wen, and S. H. Zhou, “The application of kalman filter in GPS/sins integrated navigation system,” Mechanical Management and Development, no. 5, pp. 111114, October 2011. J. Feng and H. B. Zha, “Simplification and Viewdependent LOD control for large 3D mesh models,” Journal of Computer Aided Design & Computer Graphics, vol. 18, no.2, pp. 186-193, February 2006. W. Du, “Data organization and fast display based on global dem terrain and objective models,” National University of Defense Technology, Changsha, China, December 2003. S. X. Shi, X. Z. Ye, S. Y. Zhang, and Y. Zhang, “Partition based real_-time rendering method for large area terrain data,” Journal of Zhejiang University Engineering Science, vol. 41, no. 12, pp. 2002-2006, December 2007. osgEarth-Terrain on Demand. (2012). [Online]. Available: www.osgearth.org. Rui Cao Beijing, China, born in October 13th, 1985. Received his B.A’s degree in Management Engineering from the National University of Defense Technology, Changsha, Hunan Province, China in 2008. Then received his M.A’s degree in System Engineer from the National University of Defense Technology, Changsha, Hunan Province, China in 2011. Now he is a PhD candidate in Communication Engineering from the Academy of Equipment. His major fields of study are virtual reality, spatial information obtainment and processing.. Liyun Hao Beijing, China, born in May 14th, 1987. Received his B.A’s degree in Electronic Information Engineering from the Beihang University, Beijing, China in 2010. Then received his M.A’s degree in System Science from the Academy of Equipment, Beijing, China in 2012. Now he is a PhD candidate in Communication Engineering from Academy of. Lingda Wu Beijing, China, born in 1962.Received her PhD’s degree in Control Science and Engineering from the National University of Defense Technology, Changsha, Hunan Province, China in 1999. Her major field of study is virtual reality. She was the chairman of the control laboratory in Information System and Management Academy of the National University of Defense Technology; now she is a PROFESSOR and PhD SUPERVISOR of the Academy of Equipment and he National University of Defense Technology. Her main research interests include multimedia information system, information processing and visualization. Prof. Wu is a member of the China Computer Federation, the multimedia chairman of the China Computer Federation, and a member of virtual reality and visualization standing committee of the China Computer Federation.. Equipment. His major field of study is spatial information obtainment and processing. Previous publications contain “A Data Prefetch Method Based on Kalman Predictor”(Qinghuangdao, Hebei province, 2012 International Conference of Virtual Reality & Visualization, 2012) and “A New SAR Quick Look Imagery Algorithm”(Lushan, Jiangxi province, The 2nd International Conference on Electric Information and Control Engineering, 2012). His current research interests include virtual reality, terrain rendering and data scheduling.. © 2013 ACADEMY PUBLISHER. Zhongwen Zhao Beijing, China, born in March, 1974. Received his B.A’s degree in Communication Engineering from the Academy of Equipment, Beijing, China in 1997. Then received his M.A’s degree in Signal and Information processing from the Academy of Equipment, Beijing, China in 2005. His major field of study is information transmission..He is the chairman of the System Software Laboratory. his main research interests include hardware design and requirements, data transmission, and system analysis and integration..
(7)
Figure
Related documents
The tracking results for the indoor sequence: (a) the block-based compression approach in [2] using 49 coefficients per person, (b) our sparse representation framework using 20
Ask registrants conditional questions only after sessions are chosen Deliver post-event questions only to attendees of specific sessions Automate emails of session registrant lists
ECC Report 213. Impact of Number Portability between Fixed and Mobile Services (Service Portability)
Also some location-based services using non-geographic numbers (e.g. 800 numbers) have traditionally relied on the Calling Line Identification (CLI) to direct the call to the
The program was created to assist school districts states where there is federally owned property in making up the lost local tax base not received due to federal property
So that NSObject 's methods don’t have to be implemented twice—once to provide a runtime interface for instances and again to duplicate that interface for class objects—class
The limited evidence we have identified on other LTNC self-management programmes suggests that the Hertfordshire programme is innovative and has the potential to improve
Using a cross-sectional travel survey, the objective of this paper is to quantify the relationship between commuters’ stated choice satisfaction (a proxy for
The analysis of 1’500 randomly selected toilets in the urban slums of Kampala showed that only 22 percent of households have access to private sanitation facilities; the remai-
