INTERNATIONAL JOURNAL OF PHARMACEUTICS & DRUG ANALYSIS VOL.5 ISSUE 5, 2017; 193- – 197 ; http://ijpda.com; ISSN: 2348-8948
Research Article
Development and
Validation of UV
Spectrophotometric
Method for the
Estimation of Curcumin
in an Ayurvedic
Formulation
Haridrakhand
Warule Pooja S*, Patel Vipul P, Gosavi Seema. A.
Department of Quality Assurance Techniques,
Sanjivani College of Pharmaceutical Education and Research,
Kopargaon- 423603, Maharastra.
Date Received: 13th May 2017; Date accepted:
24th May 2017; Date Published: 25th May 2017
Abstract
A rapid, simple, selective and precise UV-Visible spectrophotometric method has been developed for the determination of curcumin in ayurvedic polyherbal formulation Haridrakhand. The intake formulation was subjected for maceration process using methanol as a solvent for the extraction of curcumin as a one of the ingredients in turmeric powder. The formulation containing 32 parts of turmeric powder out of total content. The spectro-photometric detection of curcumin was carried out at an absorption maximum of 421nm using metha-nol as a solvent. The method was validated accord-ing to ICH guidelines. The linearity range was found to be 1-25μg/ml with a correlation coefficient of 0.993. The accuracy was found to be within limit. The LOD and LOQ were found to be 1.29 and 4.3 μg/ml; respectively. The results demonstrated that the method can be conveniently employed for rou-tine quality control analysis of Curcumin in
Ayur-vedic formulation of Haridrakhand.
Keywords: Haridrakhand, polyherbal formula-tion, Curcumin, UV spectrophotometry, Validaformula-tion, ICH.
Introduction:
Haridrakhand is an important polyherbomineral Ayurvedic formulation. It is used in shitapitta, skin disorders, allergies, urticaria, psoriasis. The main and active ingredient of Haridrakhand formulation is turmeric [1].
The major ingredients of Haridrakhand are Hari-dra (curcuma longa), Haritaki (terminaliachebula), Nishottar (Oprculina turpenthum), Darve (Berberis aristata), Ajmoda (Carum coxburghinanum), Musta (Cyperus rotundus), Yavani (Trachyspermum annani), Chitrak (Plubago zeylanica), Katuka (Picrorrhiza kur-roo), Jeerak (Cuminum cyminum), Pipali (Piper on-gum), Ela (Clettaria cardamomum), Twak ( Cinnamo-mum zeyhnicum), Tejpatra (Cinnamomum tamala), Vidanga (Embelia ribes), Guduchi (Tinospora cardi-ofolia), Kostha (Sassurea lappa), Triphala (Terminalia chebulia, Terminalia belerica, Emblia officinalis), Dha-nyak (Coriandrum sativum), Loha bhasma (Ash of iron), Sharkara (Sugar) etc. [2].
Turmeric is one of the important components of Haridrakhand formulation. Turmeric power is showing very good results in skin disorders, pso-riasis and related complications. Traditionally, the plant Curcuma longa widely used to impart flavor and color to the food and pharmaceuticals. Cur-cumin is the active ingredient of turmeric; turmeric contains 2.85% to 6.14%w/w. Curcumin has the ability to suppress both acute and chronic inflam-mation. Also helps to prevent the damage of the skin from UV rays of the sun [3, 4]. Curcumin is
al-most in soluble in water, but it is soluble in metha-nol, ethametha-nol, DCM or DMSO [5].
Curcumin is widely extracted by means of macera-tion, digestion and infusion [6, 7]. Different
analyti-cal methods have been developed in recent year for the quality control analysis of herbs and their for-mulation including; HPLC, HPTLC and UV-Visible Spectrophotometry [8] As per the ICH guideline of
There-fore, the aim of the present work was to develop and validate accurate, precise and robust method for the analysis of Haridrakhand containing cu cumin as a major ingredient in form of turmeric powder by using UV Visible spectr
The same method will be acceptable for routine quality control testing of an ayurvedic formulation Haridrakhand.the chemical structure of curcumin shown in fig. 1.
Fig. 1: Chemical structure of curcumin MATERIAL AND METHODS:
Material:
Haridrakhand (Satyam Healthcare Pvt. Ltd., Vad dara, Gujarat, India) was purchased from local market at Baroda, Gujarat. Double beam UV/ ble Spectrophotometric (SHIMADZU 1650 Tokyo, Japan) with 10mm quartz cuvettes were used for spectral measurements. All the other chemicals and reagents used were of analytical grade and quality.
Method:
Preparation of extract from Haridrakhand form lation:
Maceration:
1 gram of dried powder of Haridrak
ml of methanol (curcumin is soluble in methanol) in a shaker with 210 rpm at room temperature for 2 days. The extract was filtered through wha filter paper. Other portions of the solve added to the solids and the extraction was r peated until the reactant was colorless. The extracts were combined and filtered. [10]
Preparation of standard stock solution
Curcumin (10mg) was accurately weighed and transferred in a 100ml volumetric flask. Methanol was added to obtain a concentration of 100μg/ml (Stock-I). From Stock-I 10 ml of solution was wit drawn and transferred to a 100ml volumetric flask and made up the volume with methanol to obtain a concentration of 10μg/ml
(Stock-fore, the aim of the present work was to develop date accurate, precise and robust method r the analysis of Haridrakhand containing cur-cumin as a major ingredient in form of turmeric powder by using UV Visible spectrophotometer. ceptable for routine quality control testing of an ayurvedic formulation hemical structure of curcumin
Fig. 1: Chemical structure of curcumin
Haridrakhand (Satyam Healthcare Pvt. Ltd., Vado-dara, Gujarat, India) was purchased from local market at Baroda, Gujarat. Double beam UV/
Visi-tric (SHIMADZU 1650 Tokyo, Japan) with 10mm quartz cuvettes were used for spectral measurements. All the other chemicals and reagents used were of analytical grade and quality.
Preparation of extract from Haridrakhand
formu-khand with 30 ml of methanol (curcumin is soluble in methanol) in a shaker with 210 rpm at room temperature for 2 days. The extract was filtered through whatman1 filter paper. Other portions of the solvent were added to the solids and the extraction was
re-tant was colorless. The extracts
Preparation of standard stock solution
Curcumin (10mg) was accurately weighed and flask. Methanol was added to obtain a concentration of 100μg/ml I 10 ml of solution was with-drawn and transferred to a 100ml volumetric flask and made up the volume with methanol to obtain -II). From the
above stock solution-II aliquots
8ml and 10ml were withdrawn and transferred into 10 ml volumetric flasks and made up the final volume with methanol to obtain a conce
2μg/ml, 4μg/ml, 6μg/ml and 8μg/ml, respectively.
Determination of maximum wav
Curcumin 5μg/ml solution was scanned in UV spectrophotometer in the range of 200
thanol was used as blank. Wavelength correspon ing to maximum absorbance of curcumin in m thanol was observed at 421nm.
Fig.2 Determination of maximum wav
Preparation of standard calibration curve
The standard calibration curve of cu
obtained by measuring the absorbance of curcumin solution in concentration range (2
pared from stock solutions in methanol
in triplicate. Calibration curve of curcumin was then plotted with absorbance on y
min concentration on x-axis shown in fig. 3.
Fig. 3: Calibration curve of Curcumin Analytical Method Validation
Validation can be defined as (ICH) E
documented evidence, which provides a high d 0
0.02 0.04
0 5 10
A
b
s
.
conc. Calibration of curcumin
aliquots of 2ml, 4ml, 6ml, drawn and transferred into 10 ml volumetric flasks and made up the final lume with methanol to obtain a concentration of 2μg/ml, 4μg/ml, 6μg/ml and 8μg/ml, respectively.
nation of maximum wavelength
Curcumin 5μg/ml solution was scanned in UV spectrophotometer in the range of 200-800 nm. Me-thanol was used as blank. Wavelength correspond-ing to maximum absorbance of curcumin in
me-mination of maximum wavelength
Preparation of standard calibration curve
The standard calibration curve of curcumin was obtained by measuring the absorbance of curcumin solution in concentration range (2-10μg/ml) pre-pared from stock solutions in methanol at 421nm
tion curve of curcumin was then plotted with absorbance on y-axis and
curcu-axis shown in fig. 3.
Fig. 3: Calibration curve of Curcumin
Validation can be defined as (ICH) Establishing documented evidence, which provides a high
de-y = 0.003x + 0.000 R² = 0.993
15
Calibration of curcumin
abs
Available online at http://ijpda.com
gree of assurance that a specific activity will consis-tently produce a desired result or product meeting its predetermined specifications and quality cha-racteristics. The method was validated for several parameters like linearity, Accuracy, Precision, Rug-gedness, Robustness, Limit of detection (LOD), Limit of quantification(LOQ) as per ICH guide-lines (Q2)R1[11].
Linearity and range
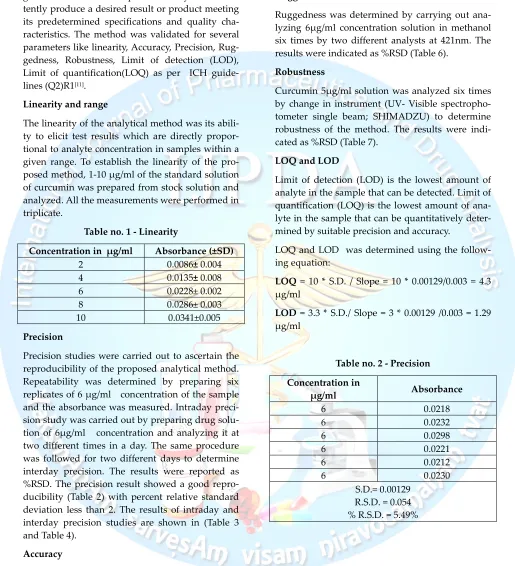
The linearity of the analytical method was its abili-ty to elicit test results which are directly propor-tional to analyte concentration in samples within a given range. To establish the linearity of the pro-posed method, 1-10 μg/ml of the standard solution of curcumin was prepared from stock solution and analyzed. All the measurements were performed in triplicate.
Table no. 1 - Linearity
Concentration in µg/ml Absorbance (±SD)
2 0.0086± 0.004
4 0.0135± 0.008
6 0.0228± 0.002
8 0.0286± 0.003
10 0.0341±0.005
Precision
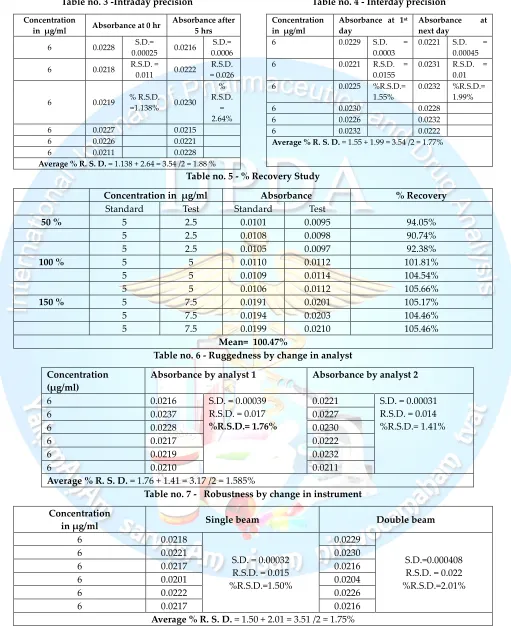
Precision studies were carried out to ascertain the reproducibility of the proposed analytical method. Repeatability was determined by preparing six replicates of 6 μg/ml concentration of the sample and the absorbance was measured. Intraday preci-sion study was carried out by preparing drug solu-tion of 6μg/ml concentrasolu-tion and analyzing it at two different times in a day. The same procedure was followed for two different days to determine interday precision. The results were reported as %RSD. The precision result showed a good repro-ducibility (Table 2) with percent relative standard deviation less than 2. The results of intraday and interday precision studies are shown in (Table 3 and Table 4).
Accuracy
Accuracy of the proposed method was determined using recovery studies. The recovery studies were carried out by adding different amounts (50%, 100%, and 150%) of the pure curcumin. The results are shown in (Table 5).
Ruggedness:
Ruggedness was determined by carrying out ana-lyzing 6μg/ml concentration solution in methanol six times by two different analysts at 421nm. The results were indicated as %RSD (Table 6).
Robustness
Curcumin 5μg/ml solution was analyzed six times by change in instrument (UV- Visible spectropho-tometer single beam; SHIMADZU) to determine robustness of the method. The results were indi-cated as %RSD (Table 7).
LOQ and LOD
Limit of detection (LOD) is the lowest amount of analyte in the sample that can be detected. Limit of quantification (LOQ) is the lowest amount of ana-lyte in the sample that can be quantitatively deter-mined by suitable precision and accuracy.
LOQ and LOD was determined using the follow-ing equation:
LOQ = 10 * S.D. / Slope = 10 * 0.00129/0.003 = 4.3 μg/ml
LOD = 3.3 * S.D./ Slope = 3 * 0.00129 /0.003 = 1.29 μg/ml
Table no. 2 - Precision Concentration in
µg/ml Absorbance
6 0.0218
6 0.0232
6 0.0298
6 0.0221
6 0.0212
6 0.0230
Table no. 3 -Intraday precision
Concentration
in µg/ml Absorbance at 0 hr
Absorbance after 5 hrs
6 0.0228 S.D.=
0.00025 0.0216
S.D.= 0.0006
6 0.0218 R.S.D. =
0.011 0.0222
R.S.D. = 0.026
6 0.0219 % R.S.D.
=1.138% 0.0230
% R.S.D.
= 2.64%
6 0.0227 0.0215
6 0.0226 0.0221
6 0.0211 0.0228
Average % R. S. D. = 1.138 + 2.64 = 3.54 /2 = 1.88 %
Table no. 4 - Interday precision
Concentration in µg/ml
Absorbance at 1st
day
Absorbance at
next day
6 0.0229 S.D. =
0.0003
0.0221 S.D. =
0.00045
6 0.0221 R.S.D. =
0.0155
0.0231 R.S.D. =
0.01
6 0.0225 %R.S.D.=
1.55%
0.0232 %R.S.D.=
1.99%
6 0.0230 0.0228
6 0.0226 0.0232
6 0.0232 0.0222
Average % R. S. D. = 1.55 + 1.99 = 3.54 /2 = 1.77%
Table no. 5 - % Recovery Study
Concentration in µg/ml Absorbance % Recovery
Standard Test Standard Test
50 % 5 2.5 0.0101 0.0095 94.05%
5 2.5 0.0108 0.0098 90.74%
5 2.5 0.0105 0.0097 92.38%
100 % 5 5 0.0110 0.0112 101.81%
5 5 0.0109 0.0114 104.54%
5 5 0.0106 0.0112 105.66%
150 % 5 7.5 0.0191 0.0201 105.17%
5 7.5 0.0194 0.0203 104.46%
5 7.5 0.0199 0.0210 105.46%
Mean= 100.47%
Table no. 6 - Ruggedness by change in analyst Concentration
(µg/ml)
Absorbance by analyst 1 Absorbance by analyst 2
6 0.0216 S.D. = 0.00039
R.S.D. = 0.017
%R.S.D.= 1.76%
0.0221 S.D. = 0.00031
R.S.D. = 0.014 %R.S.D.= 1.41%
6 0.0237 0.0227
6 0.0228 0.0230
6 0.0217 0.0222
6 0.0219 0.0232
6 0.0210 0.0211
Average % R. S. D. = 1.76 + 1.41 = 3.17 /2 = 1.585%
Table no. 7 - Robustness by change in instrument Concentration
in µg/ml Single beam Double beam
6 0.0218
S.D. = 0.00032 R.S.D. = 0.015 %R.S.D.=1.50%
0.0229
S.D.=0.000408 R.S.D. = 0.022 %R.S.D.=2.01%
6 0.0221 0.0230
6 0.0217 0.0216
6 0.0201 0.0204
6 0.0222 0.0226
6 0.0217 0.0216
Available online at http://ijpda.com
RESULST AND DISCUSSION
The proposed method provides a accurate, simple, rapid, linear, economical and convenient method for the analysis of Curcumin using UV spectropho-tometry. The wavelength corresponding to maxi-mum absorbance in methanol was found at 421nm. Beers law was obeyed in the concentration range of 1-25 μg/ml and correlation coefficient found to be 0.993. Accuracy of the proposed method was de-termined by the recovery studies, and %recovery (100.47%) obtained indicates that the method is accurate. The method was found to be precise as %RSD values for interday and intraday was found to be 1.77% and 1.88% respectively. The method was also found to be rugged and robust as the % RSD values were found to be 1.41% and 2.01% re-spectively. The limit of detection and limit of quan-tification of the proposed method was found to be 1.29 and 4.3 μg/ml respectively, indicating that the method developed is sensitive.
CONCLUSION
Based on above results, the proposed developed method for estimation of curcumin in presence of other plant constituents was found to be simple, rapid, linear, accurate, precise, reliable, robust and economical for laboratory scale determination of curcumin in Haridrakhand formulation. The pro-posed method is specific without and interference of other ingredients and hence can be applied for routine quality control analysis and estimation of Curcumin in polyherbal Ayurvedic formulation like Haridrakhand.
REFERENCES
1. Chaudhari Varsha , et al, a preliminary phar-macognostical and physicochemical assay of haridrakhanda granules: a pilot studyijrap 2011, 2 (6) 1681-1684 ,International Journal of Research in Ayurveda & Pharmacy ISSN 2229-3566 (Research Article)
2. V d. Joshi Y. G. editor, kayachikitsa 1st ed.
Pune Balmitra Prakashan 2002 p.951, 952, 1010. 3. Bagchi A: Extraction of Curcumin. Journal of Environmental Science- Toxicology and Food Technology 2012; 1(3): 01-16.
4. Choudhary N and Singh B: Potential Thera-peutic Effect of Curcumin - an update. Journal of Pharmaceutical Education Research 2012; 3(2): 64-71
5. H.H. Tonnesen, J.Z. Karlsen, Lebensm. Unters. Forsch., 1985, 180, 402-404.
6. G.W. Schieffer, J. Liq. Chromatogr. Related Technol., 2002, 25, 3033-3044.
7. M. Mahkam, M. Nabati, H.R. Kafshboran, Iran. Chem. Commun., 2014, 2, 172-178.
8. Srinivasan KR. A chromatographic study of the curcuminoids in curcuma longa Linn. J. Pharm. Pharmacol. 1953; 5: 448-453.
9. Marsin SM, Ahmad UK, Smith RM. Applica-tion of supercritical fluid extracApplica-tion and chro-matography to the analysis of turmeric. J Chromatogr Sc. 1993; 31: 20-25. 5
10. Jansirani.D1*, Saradha.R1, Salomideborani.N1, Selvapriyadharshini , Comparative evaluation of various extraction methods of curcuminoids from Curcuma longa. Journal of Chemical and Pharmaceutical SciencesISSN: 0974-2115 11. ICH Guideline Q2 (R1), Validation of
analyti-cal procedures: text and methodology, No-vember 2005.
12. .ICH Harmonized Tripartite Guidelines, Vali-dation of analytical procedures: text & bcme-thodology, Q2 (R), Nov 2005
13. . Kunnumakkara AB, Anand P, Aggarwal BB: Curcumin inhibits proliferation, invasion, an-giogenesis and metastasis of different cancers through interaction with multiple cell signal-ing proteins. Cancer Lett 2008; 269: 199–225. 14. Rubesh Kumar S, Ram kishan J, Venkateshwar
Roa KN, Duganath N, R Kumanam. Simulta-neous Spectrophotometric estimation of cur-cuminoid and gallic acid in bulk drug and ayurvedic polyherbal dosage forms, Journal of Chromatography B, 2003; 783 :287-295.
15. World Health Organization, Quality Control Methods for Medical Plants Materials, Gene-va, 1998; 1-15. [updated 1998; cited 2011 Jul 9].
Available from:
http://apps.who.int/medicinedocs/en/d/Js2200e /.
16. Pharmacoepical standards for Ayurvedic For-mulations, Central Council for Research in Ayurvedic and Siddha, New Delhi: Ministry of Health and Family Welfare; 1987, 112-23. 17. Aarunava Gandait et al., Validated method for