A study towards application-driven social
network analysis
Hui Li
a, Jiangtao Cui
a, Bingqing Shen
ba School of Computer Science and Technology, Xidian University, Xi’an 710071, China Email: {hli,cuijt}@xidian.edu.cn
b University of Macau, China Email: [email protected]
Abstract— Social network is a social structure of nodes that are tied by various kinds of relationships, such as kinships, friends, web links, colleagues, citation links, etc. Recently, large on-line social networks have become very popular among web users.
In this paper, we present a thoroughly overview towards the recent efforts in social network research from a graph data management perspective. We identify a series of re-search areas that have drew much attention in last few years, such as viral marketing, community identification, information diffusion, link prediction and evolution analysis, social influence study and privacy issues. In each of these areas, we present a detailed comparison over a series of corresponding approaches showing their pros and cons, based on which we conclude and summarize some future research directions and potential applications for each of these areas.
Index Terms— social network, graph mining, knowledge discovery, information theory, web 2.0
I. INTRODUCTION
Social network analysis (SNA) views social relation-ships in terms of network theory consisting of nodes and ties. Nodes are the individual actors within the networks; ties are the relationships between the actors. The relation-ship could be friendrelation-ship, communication, trust, etc. In the sequel, we will use the term node and individual inter-changeably. The power of SNA stems from its difference from traditional social scientific studies, which assume that it is the attributes of individual actors that matters. SNA produces an alternate view, where the attributes of individuals are less important than their relationships and ties with other actors within the network.
Social network have been tested to benefit a series of applications, such as e-commerce, online marketing, next generation web system, etc. Hence, studying the real-world social networks is of much importance in research field. However, the large volume of graphical data, high velocity of the evolution of those data and the variety of networks have proposed much challenge in analyzing real-world social networks. Social network analysis have drew much attention in graph data management research
Manuscript received xxx, 2013. c2013 IEEE.
This work was supported in part by the National Natural Science Foundation of China (GrantNo.61202179 and 61173089) and the Fun-damental Research Funds for the Central Universities
field. In detail, there exist 6 main research directions as follows. Viral marketing and e-commerce, aims to find the direct use of social network data in marketing and business. Community identification, aims to find communities from real-world networks, not only in stable ones but also in evolutionary ones where the communities are also evolving. Information diffusion, aims to find the pattern how a piece of information propagate from individual to individual through word-of-mouth effect within a social network. Link prediction, aims to discover hidden links between persons or communities or make recommendations for possible friends. Social influence study aims to evaluate the influence that each individual exhibits over their neighbors, trying to find the most in-fluential persons within a given network. Privacy issues is another important directions that aims to propose effective ways to protect the privacy of each user, especially for those sensitive information, in order to publish the social network data for research.
In this paper, we conduct a graph data-driven review over the aforementioned six different research areas in social network analysis. State-of-the-art research efforts in each of these areas have been studied and summarized in this work. We present systematic comparisons over corresponding approaches which are focusing on the same problem. Throughout the study, many potential problem and research directions are identified.
In summary, the rest of this paper is organized as follows. In Section II, we give a brief introduction over the basic findings and fundamental concept in social network study. After that, a series of network properties that are used to describe social network characteristics is introduced in Section III. In Section IV, we identify six research directions in social network study and discuss in detail the research efforts in each of these directions. Besides, we also summarize some other work that do not belong to these directions in Section V. In Section VI, we propose some potential applications and future research fields. Afterwards, we conclude this paper in last section.
II. BASIC DISCOVERY AND APPLIED FIELD
explore how the way human contact with each other will affect the spread of certain diseases such as HIV within a population; in news diffusion to help understand how news and new technologies will spread within a social network [1] or cascading within a blogsphere [2]–[4]; in viral marketing to help collect the underlined information among the customers as well as the common interest trend which aims to publish better strategies [5].
A. Six Degree Seperation Theory and Small World Phe-nomena
1) Definition: Six Degree Seperation Theory refers to the concept that anyone is an average of 6-hops away from each person on earth. This theory has been experimentally justified for a certain years though not been proved by mathematical equations. This theory can be tracked back to 1909 when Italian radio pioneer Marconi delivered his Nobel Prize speech that an average of 5.83 radio relay stations are needed to cover the globe. The theory actually came into being in 1970s after a paper of American psychologist Stanley Milgram’s published in Psychology Today. The paper is well known as ’Milgram’s small world experiment’, which aims to empirically measure the connectedness between people in the world and hence find out the average length of two randomly selected people participating the experiment fell around 5.5 or 6. This idea both directly and indirectly influenced a great deal of early thought on social networks.
2) Experiment findings: In the late 1960s, Travers and Milgram conducted an experiment in which randomly selected individuals in Boston, Massachusetts, and Om-aha, Nebraska, were asked to direct letters to a target person in Boston, each forwarding his or her letter to a single acquaintance whom they judged to be closer than thmeselves to the target. Subsequent recipients did the same. The average length of resulting acquaintance chains for the letters that eventually reach the target was around six.
In 1998, Wattz and Strogatz found the average sepera-tion degree among American actors is about 3.65 [6]. In 2001, Wattz attempted to recreate Milgram’s experiment again on the Internet, using e-mail message instead of real mail. Wattz found the average number of intermediaries was around 6 [7]. In 2007, Leskovec and Eric Horvitz ex-amined a data set of instant messages collected from MSN network composed of 30 billion conversations among 240 million people. They found the average path length among Microsoft Messenger users to be 6.6 [8]. There is a Facebook application called ”Six Degrees” which calculates the degrees of seperation between different people who participate in the application. It is reported to have 4.5 million users till April 7, 2008. The average degrees of seperation of all the user within the application is about 5.98.
3) Open questions and discussion: One of the key features of Milgram’s experiment is that participants are asked to choose the person they know who is most likely to know the target individual. But in many cases,
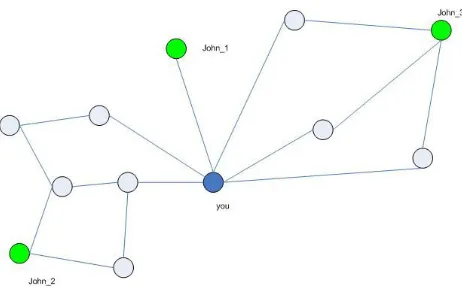
Figure 1. Friendship graph
the participant may not know which of their friends is the most likely one to know the target. Thus, since the participants of the Milgram experiment do not have a topological map of the social network, they might actually be sending the package further away from the target rather than sending it along the shortest path. This may create a slight bias and over-estimate the average number of ties needed for two random people. That is each individual participating in the experiment only has a local knowledge of their local circle, without any knowledge about the whole graph structure. That introduced another property of social network, which is ”searchable”. The experiment also proved that ordinary people are able to direct messages through their network of acquaintances to reach a specific target person in only a few steps, also known as navigation problem in social network. In this area, Wattz proposed a model that offers a model as an explanation of searchability of social network. [9] Their model based on recognizable personal identities: sets of characteristics measured along a number of social dimensions. Jon Kleinberg raised another model to answer the question whether short paths can be found between any two vertices by actors in the network lacking global information about the graph to use when routing. [10] He showed that this is not possible in all families of random graphs with small diameter, but instead depends on very specific properties of certain classes of such graphs. Graphs where short paths can be found are often called ”navigable”. This remains a particular practical interest, some other models have also been proposed. [11]. The Freenet project which aims to provide a platform on the Internet to let people publish and obtain information without fear of censorship has developed their own model [12] to assure users retrieve the information they need.
Besides, the navigability of a social network also include the problem of search efficiency with less time and space consuming as well as better ranking strategy. V.Vieira et.al [13] has proposed an efficient search ranking algorithm on large online social networks. The algorithm strikes a balance between producing good re-sults and reducing query processing time.
same patterns as their interactions in real life. That is, when a user searches for a person’s name, he/she is more likely to be pleased when seeing people that are closer in the social space. That leads to the following basic ranking function:
R(John) = 1 minL(John)
where minL(John) is the shortest path between John and the user, R(John) is the rank of the user John. This rank is computed for the user names that match the query partially. To overcome the large space and query processing time spent by using brute-force breadth-first search algorithm, they introduced ”seed” which is a certain number of pre-selected nodes in the graph. Starting from each seed, they ran a bread-first search reaching out to all nodes in the network. For each node reached, they annotated it with its distance to the seed they started the bread-first search from. In that way, a vector of distances to seeds is formed to each node in the graph. They called it vectors of seed distances, for example
Duser = [2,1,2,3], DJohn 1 = [1,3,2,2], DJohn 2 = [2,1,1,2], DJohn 3 = [1,2,3,1]
Current user is at 2,1,2,3 distances from seeds S1,S2,S3,S4, respectively. For ”John 1”, the seed distance vector is given by 1,3,2,2, and so on. Then we can find ”John 2” is the closest to the user with a distance of 2 with S2 as the intermediary. However, we can find the minimum distance for John and current user is at least 2 in this model as the result of seeds as an intermediate node though not necessary in many cases. In this case, the distance vectors allow to approximate the minimum distance. The higher the number of seeds, the approximation tends to be for a higher number of nodes.
B. Graph Parameters to be used
1) Diameter:
• Effective Diameter. minimum number of hops in
which some fraction(often 90%) of all connected pairs of nodes can reach each other.
• Characteristic Path Length. for each node in the graph, consider the shortest path, from it to every other node take the average of them, find themedian of each start node’s average, that is characteristic path length.
• Average Diameter. the same as Characteristic path length, but to find the mean of each start node’s average.
2) Clustering coefficient:
• Clustering Coefficient. measures the clumpiness of
a graph. Suppose a node i has ki neighbors, and there are ni edges between the neighbors. Then the clustering coefficient of nodei is defined as
Ci=
2ni
ki(ki−1) for undirectedki>1,
ni
ki(ki−1) for directedki>1, 0 forki = 0,1
• Global Clustering Coefficient. the clustering
coeffi-cient for a whole graph.
C= 1 N
N X i=1
Ci
alsoC= |closed triads|
|open triads| can be used to define global
clustering coefficient, where a closed triad can be explained as a triangle while an open one means a triangle with a missing edge.
3) The parameters in real world graphs: Watts and Strogatz [6] find a clustering coefficient of 0.79 for the actor network where two actors are linked if they appear in the same movie, however a corresponding random graph with the same size has a coefficient of 0.00027; for power grid network it is 0.08 while for the corresponding random is 0.005. They also find the characteristic path length will drop much quicker than clustering coefficient as the randomness of the graph increases.
III. CHARACTERISTICS OF SOCIAL NETWORK A. Dataset Characteristics
1) Densification power law: It was believed that as a network evolves, the number of degrees grow linearly in the number of nodes. However, Leskovec et al. [15] found that several real world social network graphs evolves according to a power law: the number of nodes N(t) at time t is related to the number of edges E(t) by the equation:
E(t)∝ N(t)α,1≤α≤2
where the parameterαis called the Densification Power Law exponent and remains stable over time. They found that this law exist for several different graphs such as paper citations, patent citations and Internet AS graph, only varies in the exactαvalues. Leskovec and Kleinberg [15] has found that most real world graphs densify over time, with the number of edges growing superlinearly in the number of nodes.
2) Shrinking diameter: It has been experimentally shown that the effective diameter tends to decrease as the network grows. This contradicts an earlier belief that the diameter slowly increases as the network became larger. Leskovec and Kleinberg [15] has found that the average distance between two nodes often shrinks over time, in detail, their results showed the effective diameter of a graph decreases as the graph grows over time. For the citation graph in their study, it can be explained as the result of subsequent papers acting as ”bridges” by citing earlier papers from other areas.
3) Centrality: An important parameter for each node in a social network graph is the centrality, which measure the importance of a node in spreading some information or the closeness of the contacts among the network. The way to measure a node’s centrality varies much. Generally, a node with high centrality should satisfy the following conditions:
• is close to many other nodes
• there are many pairs of nodes which needi as their
intermediary in their communications
The above conditions result in the following centrality measures:
1) Degree centrality [16]. This method identifies the centrality of a node using its degree. This focuses on the level of communication activity. The more ability to directly communicate with others, the higher centrality got.
2) Closeness centrality [17]. A node is of higher cen-trality when it is closer to many more nodes than all the other nodes. Closeness centrality represents independence: the possibility to communicate with many others depending on a minimum number of intermidiaries. In another way, degree centrality can be considered as a special case of closeness centrality where independence is so important that only directly connections are being considered. 3) Betweenness centrality [18]. This measure focus on
the community control, the possibility to intermedi-ate in the communications of others. Betweenness centrality focuses on the communication control: the possibility to intermediate in the communica-tion of others. Since in large networks such as large online social networks, exact computation of betweenness centrality for each node is pro-hibitive, Geisberger [19] proposed an algorithm to achieve better approximation of betweenness centrality within large networks.
4) Adjacency matrix analysis [20]. Use the eigenvector which is associated with the largest characteristic eigenvalue of the adjacency matrix. This approach utilize the matrix representation of graphs, in the early model, they neglects multiple paths joining nodes of the graph, in a improved edition they used a parameter to weight indirect paths and also accounted for the link between power and centrality.
B. Social Roles
1) Definition: Social roles is always defined as an expected behavior in a given social position or a social status. A social role is often related to the tasks and behaviors that an individual should perform targets to some other individual or groups. For example, husband role can be explained as a series of related responsibilities and obligations towards another actor in a wife role.
C. Social Capital
1) Definition: Social capital comes from the concept that social contacts affects the productivity of individuals and groups. In another way, social capital is essentially the idea that better connected people enjoy higher returns on their efforts [21].
IV. MINING ON SOCIAL NETWORKS A. Viral Marketing and E-commerce
Viral marketing is an application of social network mining that explores how individuals can influence the buying behavior of others. Traditionally, companies have employed direct marketing (where the decision to market to a particular individual is based solely on the one’s characteristic) and mass marketing (where individuals are targeted based on the population segment to which they belong). Neither of the two takes into consideration about the influence that customers can have on the purchasing behavior of others. For example, consider a person who decides to see a particular movie and persuades a group of friends to see the same movie. Viral marketing aims to optimize the positive word-of-mouth effect among customers. By considering the interaction and social con-nections among the customers, viral merketing may obtain higher profits than traditional marketing, which does not touch this area. The network value of a customer is the expected increase in sales to others that results from marketing to that customer. Leskovec et.al conducted a careful study about the recommendation networks features and their propagation model [22].
Viral marketing considers a customer’s network value. Ideally, we would like to mine a customer’s social rela-tions to predict the probability of he/she to buy a specific product based on the intrinsic features of the customer as well as the influence from his/her friends in the network. This brings the problem of finding the optimal set of customers to which to market that can benefit the most. But the task of finding the optimal set of customers is known to be NP-hard; however, it can be approximated within 63% of the optimal as Kempe et.al. [23] showed in their paper. In this way, viral marketing is more or less the same as the key player problem. Tim Carnes et.al. [24] has showed another modified scenario of key player finding( will be discussed later).
Node state
Neighbor state Fraud Accomplice Honest
Fraud ǫp 1−2ǫp ǫp
Accomplice 0.5 2ǫp 0.5−2ǫp
Honest ǫp (1−ǫp)/2 (1−ǫp)/2
TABLE I. PROPAGATIONMATRIX
Figure 2. Execution of Netprobe
fraudsters will interact in small cliques of their own. The propagation matrix is set as [Table.1]: where ǫp is set to 0.05 in their paper, and the belief of nodei in state σis computed using below equations:
mij(σ) :=Pσ′Ψ(σ′, σ)
Q
n∈N(i)\jmni(σ′),
bi(σ) :=kQj∈N(i)mji(σ)
wheremij is the message vector sent by nodeitoj,N(i) is the set of nodes neighboring i, k is a normalization constant, bi(σ) is the belief of node i in state σ. their future work is to find a way to auto generate the parameter ǫ which is manually set as 0.5 in the experiment.
Larry Blume et.al [5] has studied the price-setting problem from the analysis of buyer-traders-seller triple. In their model, traders set prices strategically, and then buyers and sellers react to the prices. They found that how the profit obtained by the traders depend on the underlying graph, that is, a trade can make a profit when it has an ”essential” connection in the network structure, thus the graph structure in detail provides a measure for the amount of benefit of traders.
B. Community Mining and Mining Newsgroups
With the growth of the web, community mining has attracted increasingly attention. A great deal of such work has focused on mining implicit communities of web entities(web pages, individual profiles, authors etc.) [26] [27], of scientific literature from the web, and of docu-ment citations. A community is a group of objects with some common properties. Community mining is in fact subgraph identification or node clustering. For example, in
paper citation linkage, two papers are related if one paper cites the other, which indicates they share some common interest or topic issues. A graph of paper citation linkages can be mined to identify a community or set of papers on a particular research topic or area.
Finding communities within virtual environments such as e-mail and the web is of much interest and attraction recently. Some studies have been carried out to identify virtual communities in blogs, such as Ravi Kumar’s work in 2003 [3]. Kumar applied Kleinberg’s bursty algorithm to identify communities as bursts of hyperlinks between blogs where the bursts are obtained from the time graph extracted from the blog graph as a result of crawling the blogs. Another alternative approach is to use clustering algorithms to automatically find communities in blogs. As blogs are web pages, web search algorithms can also be used to extract communities. Besides, Alvin Chin and Mark Chignell proposed their method for finding com-munities in blogs [26]. They studied the problem using a mixed approach combining graph analysis and a sense of community survey. They used visualization indicators together with some social network analysis indicators to measure the sense of community in a mathematical model. The network analysis indicators include Degree Centrality, Betweenness Centrality, Closeness Centrality and k-cores which measure different properties of com-munity from several aspects. The afterward survey was used to supplement the networks analytic measures of centrality to determine which blogs could be part of a community. Finally, the set of identified blog communities was provided as feedback to the candidate blogs and used to recommend new links between blogs in order to grow communities within the social hypertext.
Flake et.al [28] have also used connectivity and graph theory for identifying web communities , this is another major approach in discovering online communities. Hide-hiko Ino et.al [29] also used graph theory approach to discover communities within a web graph. They first discussed some available definitions of community. They modified the model proposed by Flake which is called FLG-community, and developed a more restrict one called IKN-community. An IKN-community is a vertex subset C⊂V that satisfies the following conditions:
Condition 1. P
v∈Cwuv > P
v∈V−Cwuv for allu∈C. Condition 2. P
v∈Cwuv ≤Pv∈V−Cwuv for allu∈V −C. where wuv is a weight between each pair of vertex u and v, wuv is 0 if there is no link between u and v. It should be 1 if there exists a link between the two vertices unless explicitly stated otherwise. Their algorithm of finding IKN-communities within a given interaction graph can complete within O(mn2logn)
et.al [30] have done. They presented a unique approach that uses the correlation between the distribution of a term that represents a topic and the link distribution in the citation graph where the nodes are limited to the documents containing the term. It distinguishes from other approaches which studied either the textual data or citation links alone. Their approach was based on the intuition that if a term is relevant to a topic, the documents containing the term would have denser connectivity than a random selection of document.
Web-based social network analysis is closely related to Web mining. A typical newsgroup posting consists of one or more quoted lines from another posting followed by the opinion of the author. Such quoted responses form ”quotation links” and create a network in which the vertices represent individuals and the links ”responded-to” relations. The task of newsgroup mining is to classify and partition authors in the newsgroup into opposite camps by analyzing the graph structure of the responses. A quota-tion graph is always constructed by building a quotaquota-tion link between person i and person j if i has quoted from a posting which is written by j. Thus, we need to form an bipartition of the vertices, one partition is those for an issue and the other is those against it. An interesting phenomenon is people always more frequently respond to a message when they disagree than when they agree. Thus, the problem becomes: as most edges in a newsgroup graph represent disagreement, we need to maximize the number of edges between two partition sets. But the max-cut problem is NP-hard, several approximation algorithm has been proposed to minimize the performance gap against the optimal solution.
Rakesh Agrawal et.al [31] proposed their algorithm to effectively classify people into opposite camps within a given topic in the context of newsgroups. Hence they showed in their result that methods based on statistical analysis of text yield low accuracy. This may be be-cause the vocabulary used by the two sides tends to be largely identical and many newsgroup postings consist of relatively small number of words. Thus, they utilized a link-based iterative classification approach to study the problem. Their algorithm was constructed as: let the total number of iteration bem, in each iterationi:
1) Use links from labeled data to predict class labels on unlabeled data.
2) Sort predicted labels by confidence.
3) Acceptkclass labels, wherek=N(i/m), andN is the number of instances in test data.
Let wij be the weight of the link between vertices vi andvj. Let the vertices in the training set have scors of either +1 or -1 according to their class labels. The score for labeled vertices in the test set is their score in the previous iteration; the score for unlabeled vertices is 0. The scoresfor a vertexvi in the test set is computed as:
s(vi) := P
j(−s(vj)wij) P
jwij
The sign of s(vi) gives the predicted class label, and
|s(vi)| gives the confidence of the prediction.
C. Information Diffusion and Cascading Behavior in So-cial Networks
Social networks are important channels of information diffusion both by distributing valuable content, and by spreading questions and then transferring the answers back to those who asked. The dynamics of information dissemination in social networks is of paramount impor-tance in processes such as rumors or fads propagation, spread of product innovations or ”word-of-mouth” com-munications. Due to the difficulty in tracking a specific information when it is transmitted by people, most un-derstanding of information spreading in social networks comes from models or indirect measurements.
Many researches in this field focus on maximizing the diffusion speed within a given network, to achieve this goal, most of them try to find some particular nodes in the network to spread the information initially with minimal cost and maximal influence. This task is often related with the key player finding problem which will be discussed in later section [32] [24] [33].
D.Gruhl et.al [2] conducted a research on the diffusion model of topics in blogspace. They showed that for some topics, their popularity remained constant in time which they called ”chatter” while for other topics the popularity is more volatile which they called ”spikes”. Actually the information flow within a blogspace is called cascade. Blogs have become an important medium of information because of their timely publication, ease of use, and wide availability. They often make headlines, by discussing and discovering evidence about political and important events. Blogs link to another blog by citing a hyperlink to the other blog’s page. Aggregating links from several blog posts creates a directed graph. Such a graph is the data source that is to be mined for the patterns of information propagation in blogspace. Jure Leskovec et.al [4] studied the cascading behavior in large blog graphs. They showed some interesting observations in the paper.
1) The probability that a post written at time tp ac-quires a link at timetp+ ∆ is :
p(tp+ ∆)∝∆−1.5
2) Probability of observing a cascade on n nodes follows a Zipf distribution:
p(n)∝n−2
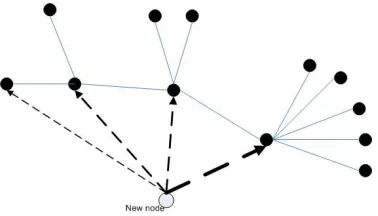
Figure 3. BA model graph. new node prefers to connect to existing nodes with high degree. The dashed lines show possible edges for the new node, weight indicate the possibility.
D. Link Prediction and Evolution of Social Network
Social networks are dynamic, they changes over time. New links appear will indicate new interactions between objects. A link prediction problem can be modeled as: at timetwe have a snapshot of social networkGand wish to predict the edges that will be added to the network during the interval from timetto a future timet′. As an example, consider a social network of coauthership among scientist. Intuitively we may predict that two scientists who are ”close” in the network may be likely to collaborate in a future time t′. In another way, link prediction can be thought of a contribution to the study of social network evolution models. Since social networks are managed by individuals, their links tend to mirror or, in some cases, establish new types of social relations, thereby creating a social network. Studying the evolution of this network allows the discovery of emerging social structures and their growth trends.
As the evolution of a social network always obeys some laws such as densification power law, shrinking diameters and etc., some network evolution models has been proposed to capture the way network evolutes.
• Preferential Attachment model. In these models, the
rich get richer as the network grows, leading to power law effects. Each outgoing edge from the new vertex connects to an old vertex with a probability propotional to the in-degree of the old vertex.
P(edge to existing vertex v) =Pk(v) +k0 i(k(i) +k0)
where k(i) represents the current in-degree of an existing node i, and k0 is a constant. Barabasi and
Albert [35] proposed another similar model called BA model. In this model, network starts with m0
nodes and grows in stages. In each stage, one node is added along with m edges which link the new node to m existing nodes [Fig.3]. The probability definition changes to
P(edge to existing vertex v) =Pk(v) ik(i) wherek(i)is the degree of nodei.
• The Forest Fire model. It is based on the notion that new nodes attach to the network by ”burning”
through existing edges in epidemic fashion. It uses two parameters,forward burning probability,p, and backward burning ratio,r, which are described be-low. Suppose a new node v, arrives at time t. It attached to the graphGin the following steps:
1) It chooses an ambassador node w at random, and forms a link tow.
2) It selects x links incident to w, where x is a number that is binomially distributed with mean (1−p)−1 . It chooses from out-links and
in-links of wbut selects in-links with probability rtimes lower than out-links. Letw1, w2, ..., wx denote the nodes at the other end of the selected edges.
3) The new node v forms out-links to w1, w2, ..., wx and then recursively applies step (2) to these nodes.
Liben-Nowell and Jon Kleinberg has proposed their algorithm to solve the problem of link prediction [36]. Given a snapshot of a social network, can we infer which new interactions among its members are likely to occur in the near future? They developed approaches to link prediction based on measures of the ”proximity” of nodes in a network. Experiments on large co-authorship networks suggest that information about future interac-tions can be extracted from network topology alone, and that fairly subtle measures for detecting node proximity can outperform more direct measures. In effect, the link prediction problem asks: to what extent can the evolution of a social network be modeled using features intrinsic to the network itself. Their approach based on the methods: For a node x, let Γ(x) be the set of neighbors of xin network G . Several approaches are based on the idea that two nodes xand y are more likely to form a link if Γ(x) and Γ(y) have large overlap; this follows the natural intuition that such node pairs represent authors with many colleagues in common, and hence are more likely to come into contact themselves. In this way, they set several different score measures for the probability of thatxandy will cooperate in a specific future time.
score(x, y) :=|Γ(x)∩Γ(y)| (1)
score(x, y) :=|Γ(x)∩Γ(y)|/|Γ(x)∪Γ(y)| (2)
score(x, y) :=|Γ(x)| · |Γ(y)| (3)
O’Madadhain et.al [38] proposed an algorithm for prediction and ranking of link existence based on event-based network data. One of the main contribution of their paper is solving the problem of predicting future event co-participation of entities. That is, how likely is it that a given pair of individuals will co-participate in at least one event over some specific future time period? Specific examples of this question include ”how likely is it that A will send an email to B in the next week?” and ”How likely is it that author X will coauthor a paper with author Y next year?” They consider below the specific problem of answering the question ”given the existing event data, will entitiesvj andvk co-participate in at least one event in a future specified interval?”. Their approach is to treat it as a data-driven classification problem (in which ”co-participating” is one class, and ”not co-”co-participating” is the other). The methods used are primarily probabilistic classifiers, which assign a probability to each class condi-tioned on the values of a set of specified features, whose nature may vary depending on the data set. They defined the conditional probability as:
p(vj, vk ∈Pt,t+∆t|f(Υ1,t, X, Y) =w)
where vj, vk ∈ Pt,t+∆t is a binary proposition defining whether entities vj and vk co-participate in any event in the time periodt, t+∆t,fis a function returning a vector wof feature values,Υ1,tis the historical event data up to timet, andX, Y are the relevant entity and event covariate data.
Ravi Kumar et.al [3] proposed tools to address the evo-lution of communities in blogspace. Blogspace is defined as the space of weblogs. Their study showed in detail about the evolution of connected component structure and microscopic community structure. Their results showed that Blogspace underwent a transition behavior around the end 2001, and has been rapidly expanding over the past year, not only the metric in scale, but also in metrics of community structure and connectedness.
After that, in 2006, Ravi Kumar [39] again studied the evolution of large online social networks such as Flickr and Yahoo!360. They hence provided a model of the evolution of online social networks to explain the key aspects of network growth in a simple manner, in which they characterizing users as either passive members; in-viters who encourage offline friends to migrate online; and linkers who fully participate in the evolution of network. Y.Berger-Wolf [40] proposed a new mathematical and computational framework that enables analysis of dy-namic social networks and captures some properties of dynamic features for social networks. They modeled the graphs by timesteps, they introduced the concept of partitions,P1, P2, ..., PT , each partition is related to the graph at one timestep and is a set of disjoint groups. Their model aims to find the dynamic behavior of communities within the series of partitions. Similar work has been done by Tantipathananandh et.al [41] which studies the problem in a node coloring approach. Backstrom et. al. [42] studied formation of groups and the ways they
grow and evolve over time. To estimate probability of an individual joining a community, they proposed using fea-tures of communities and individuals, applying decision-tree techniques. To identify communities that are likely to grow, they also used community features on a decision-tree based analysis.
Chakrabarti et. al. [43] proposed evolutionary settings for two widely-used clustering algorithms (k-means and agglomerative hierarchical clustering). They define evo-lutionary clustering as the task of incrementally obtain-ing high-quality clusters for a set of objects while also maintaining similarity with clusters identified in previ-ous timestamps. To obtain the clusters for a particular snapshot, they also use history information to obtain a clustering consistent with earlier snapshots. Falkowski et. al. [44] analyze the evolution of communities that are stable or fluctuating based on subgroups. Although they analyze interaction graphs, their focus is different from ours. They examine overlapping snapshots of inter-action graphs and apply standard statistical measures to identify persistent subgroups. Our focus is on identifying key events and behavioral patterns that can characterize, model and predict future behavioral trends. In this regard, we specifically target nodes of the network and analyze their evolutionary behavior.
There are still some other link mining work in social network [45], one is conflict of interest detection in social networks, that is predicting the probability of potential relations between suspicious nodes. Even two individuals does not contact with each other obviously, they may know each other secretly. Aleman-Meza et. al. [46] pro-posed a model for conflict detection of paper reviewing problem, how to better arrange the reviewer of each paper. Their study was based on the data set of DBLP and FOAF, they try to give the author of paper and each reviewer a connection score which represents the probability of them knowing each other even though they are not directly connected in either DBLP or FOAF data set. This kind of work also can be used to detect terrorists networks to detect terrorism attack.
E. Key Player Problem
Who are the most important actors in a given social network? As studied before by Borgatti [32], there are two types of key-player problems.
• Find a set of k nodes whose removal maximally disconnects the network. These individual nodes may be targeted for immunization to prevent an infection from becoming an epidemic.
• Find a set ofknodes which are maximally connected to the rest of the network. These nodes could be targeted to diffuse information in a social network in the shortest time.
important stories? They modeled the question as selecting nodes(sensor locations, blogs) in a network, in order to detect the spreading of a virus or information as quickly as possible. That is a standard key player problem. In the paper, they studied the problem in such a way, how to find a set of nodes as sensors so that once outbreak happens the system sensors can detect the outbreak as soon as possible. Naturally, one may want to minimize the detection time as well as the affected population before the outbreak is detected. Optimization of either these two objectives is NP-hard, their solution was proved to be not too far from optimal one. So that the problem changed to:
max
A⊆ΛR(A)subject toc(A)≤B
where R(A) is a placement score of a placementA, which we intend to maximize, c(A) is the related cost of such a placement A, B is a given budget. To accomplish the task, they introduced a penalty function:
π(A) =X
i
P(i)πi(T(i,A))
where for a placementA⊆Λ,T(i,A) = mins∈A(i, s)is the time until event i is detected by one of the sensors in A, and P is a given probability distribution over the events. We assumeπi(t)to be monotonically nondecreasing in t, i.e., we never prefer late detection if we can avoid it. We also set T(i,∅) =∞, and setπi(∞)to some maximum penalty incurred for not detecting the event i. Then R can be defined as:
R(A) :=X
i
P(i)Ri(A) =π(∅)−π(A)
As a basic research finding of the previous model, Kempe et.al. [23] showed that the problem of selecting a set of nodes with maximum influence is submodular,i.e., they exhibit a diminishing returns property: Reading a blog (or placing a sensor) when we have only read a few blogs provides more new information than reading it after we have read many blogs. As proved in the paper, in such a submodular function, the greedy algorithm provides a (1−1/e)(63%) approximation.
Tim Carnes et. al. [24] studied a slightly different algorithm problem, how to introduce a new product into an environment where a competing product was also being introduced. The main difference is, Kempe et al [23] assumed that there was only one company introducing a product. Their work contribute to the answer to select the most influential nodes to spread new products without any other competitors. Carnes et al studied the problem from a follower’s perspective, where a competitor’s com-parable product’s has been introduced into market. Their experiment results showed that by using knowledge of the social network and the set of consumers targeted by the competitor, the follower may still in fact capture a majority of the market by targeting a relatively small set of the right consumers.
Agarwal et al [47] proposed a model to measure the significance of blogs. They developed a ranking algorithm
to discover influential bloggers within a blogsphere. They solved the problem with the help of a blog-post influence graph where the influence of a blog post flows along the nodes. IfI denotes the influence of a node(or a blog post p), thenInfluenceFlowacross that node is:
InfluenceFlow(p) =ωin
|ι| X m=1
I(pm)−ωout |θ| X n=1
I(pn)
whereωin andωout are the weights that can be used to adjust the contribution of incoming and outgoing influ-ence respectively.pmdenotes all the blog posts that link to the blog postp, where1≤m≤ |ι|; andpndenotes all the blog posts that are referred by the blog postp, where 1≤n≤ |θ|.|ι|and|θ|are the total number of inlinks and outlinks of blog post p. InfluenceFlow accounts for the part of influence of a blog post that depends on inlinks and outlinks. Then influence of a blog postpcan be defined as:
I(p) =ω(λ)×(ωcomγp+InfluenceFlow(p))
whereω is a weight function which rewards or penalizes the influence score of a blog post depending on the length λof the post.ωcom denotes the weight that can be used to regulate the contribution of the number of comments γp towards the influence of blog postp.
Hence, for a bloggerB, we can calculate the influence score for each of B’s N posts and use the maximum influence score as the blogger’siIndex:
iIndex(B) = max(I(pi))
where1≤i≤N , with the help ofiIndex we can rank bloggers within a blogsphere.
F. Privacy and Security Issues in Social Networks
As said in the talk by Kleinberg [48], except the problem of inferencing social processes from data, the problem of maintaining individual privacy in studies of social networks is another important issue. Much of the research on large-scale social systems has been carried out on data that is public where the users still expect to gain as higher privacy as possible. How can such data be made available to researchers while protecting the privacy of the individuals represented in the data? Many of the standard approaches here are variations on the principle of anonymization, the names of individuals are replaced with meaningless unique identifiers, so that the network structure is maintained while private information has been suppressed.
The research in this field include the problem of mea-suring the trust and reputation of each individual within a network [50]. Shashank Pandit et.al [25] proposed a system called Netprobe to detect frausters among users within a online auction networks. They developed a belief propagation algorithm to study the trustworthness of each users within the network(discussed in detail previously).
G. Differences from Graph Mining
There are some important differences between social networks analysis and graph mining [51] though they share many concepts, ideas and algorithms. Most signif-icantly, social network data is based on social relations among individuals or groups of individuals, either offline realworld relationships or online virtual relationships. It is not randomly connected graph data. Graph mining task always focuses on computational cost issues while for social networks analysis, computational cost is rarely an important issue in many researches.
V. OTHER RELATED WORK
• Entity identification. Entity disambiguating is an-other research area in social network which tries to identify the people’s profiles on different sites. [52] As numbers of large social network sites emerges as the trend of web2.0, each individual may have sev-eral different profiles on the web, each in one social network site. How to identify an individual while we have several different profiles on hand becomes a interesting research issue. For example, person a may have profile P1 on a subgraph G1 of Friend-ster(www.friendster.com), P2 on a subgraph G2 of Facebook(www.facebook.com) and P3 on a subgraph G3 of Flickr(www.flickr.com), by studying the local circle topology and graph analysis of G1,G2,G3, we may get a prediction that P1,P2 and P3 represent the same person. Another popular approach is based on text, through the analysis of P1,P2 and P3 features, measures the similarity among profiles only, this is not covered in social network analysis.
• Network extraction from online data [53]. As the trend of emerging social network websites, large websites based on social relations such as Friendster, Facebook, Orkut etc. came into being. To extract a subset of the network structure from these websites becomes a important issue. Masoud Makrehchi [54] used a support vector space approach to extract relationships network among persons in a dataset.
• Information-seeking and collective
problem-solving [55]. Jeffrey Davitz [56] proposed a general interaction model for the underlying social networks and then a specific model (iLink) for social search and message routing. A key contribution is the development of a general learning framework for making such online peer production systems work at scale.
• Topology analysis [57]. There are some studies re-garded to the structural analysis of a specific social
network, which aims to achieve better understand-ings about the target network features. Jun Zhang et.al [58] studied a java forum members network structure and the degree distribution of the network, and proposed a expertise ranking algorithm to rank the expertisation of them.
VI. DISCUSSION AND FUTURE RESEARCH DIRECTION
A group of questions remain unanswered or partially answered at best. These are rich topics for future inves-tigation. Most of the work on social network has con-centrated on homogeneous relationship and homogeneous network. Less attention has been paid to networks con-structed by heterogeneous types of relationship, neither heterogeneous networks with heterogeneous underlying relationships between individuals.
Another interesting topic is navigationability of social networks, this is still an open area although much studies has been carried out. This problem can be traced back to the experiment: which neighbor to select to deliver a mail as an intermediary when an individual has to send the mail to a target who he does not know before. In another word, from the perspective of a node, with only local information, which neighbor of it should be sent a query that regard to some information it does not know directly but known by at least one node within the network. A different problem is, with the whole structure of the network on hand, how to find the shortest path between two nodea andb in the minimal time.
Other topics such as research social network with weighted links where each edge in the network has an associated weight indicating the strength of tie need to be looked into.
VII. CONCLUSIONS
Social network analysis (related to network theory) has emerged as a key technique in modern sociology, anthropology, sociolinguistics, geography, social psychol-ogy, communication studies, information science, orga-nizational studies, economics, and biology as well as a popular topic of speculation and study. We illustrated several basic concept and theory of social network anal-ysis, such as six degree seperation theory and small world phenomena. After that, we discussed some major features, characteristics and measures that are widely used in social network analysis research. We further discussed the interesting topics within the research of social network analysis. Finally we compared it with graph mining work which is close to social network analysis. While much progress has been made in the previously mentioned problems, there does still exist space that we can make improvement and innovation work.
ACKNOWLEDGMENT
REFERENCES
[1] M. M. T. W. Nicole Immorlica, Jon Kleinberg, “The role of compatibility in the diffusion of technologies through social networks,”EC’07.
[2] D. L.-N. A. T. D. Gruhl, R. Guha, “Information diffusion through blogspace,”WWW’2004.
[3] P. R.-A. T. Ravi Kumar, Jasmine Novak, “On the bursty evolution of blogspace,”WWW’2003.
[4] C. F.-N. G. M. H. Jure Leskovec, Mary McGlohon, “Ca-cading behavior in large blog graphs,”SDM’2007, 2007. [5] J. K.-E. T. Larry Blume, David Easley, “Trading networks
with price-setting agents,”EC’07, June 2007.
[6] S. H. Duncan J.Watts, “Collective dynamics of ’small-world’ networks,” Nature, vol. 393, pp. 440–442, June 1998.
[7] D. J. Peter Sheridan Dodds, Roby Muhamad, “An experi-mental study of search in global social networks,”Science, vol. 301, pp. 827–829, Aug. 2003.
[8] E. H. Jure Leskovec, “Planetary-scale views on a large instant-messaging network,”WWW’2008, 2008.
[9] M. Duncan J.Watts, Peter Sheridan Dodds, “Identity and search in social networks,” Science, vol. 296, pp. 1302– 1305, May 2002.
[10] J. Kleinberg, “The small-world phenomenon: an algorith-matic perspective,”TC’00, 2000.
[11] P. R. Jon Kleinberg, “Query incentive networks,”
FOCS’05, pp. 132–141, 2005.
[12] O. Sandberg, “Neighbor selection and hitting probability in small-world graphs,”The Annals of Applied Probability 2008, 2008.
[13] R. D. P. B. D. d. C. R. B. R.-N. Monique V.Vieira, Bruno M.Fonseca, “Efficient search ranking in social net-works,”CIKM’2007, Nov. 2007.
[14] C. S. Cliff Lampe, Nicole Ellison, “A facebook in the crowd: Social searching vs. social browsing,”CSCW’2006, Nov. 2006.
[15] C. F. Jure Leskovec, Jon Kleinberg, “Graphs over time: Densification laws, shrinking diameters and possible ex-planations,”KDD’05, Aug. 2005.
[16] M. Shaw, “Group structure and the behaviour of individu-als in small groups,”Journal of Psychology, vol. 38, no. 1, pp. 139–149, Jan. 1954.
[17] M. Beauchamp, “An improved index of centrality,”
Behav-ioral Science, vol. 10, p. 161C163, 1965.
[18] L. Freeman, “A set of measures of centrality based on betweenness,”Sociometry, vol. 40, pp. 35–41, 1977. [19] D. S. Robert Geisberger, Peter Sanders, “Better
approxi-mation of betweenness centrality,”ALENEX’08, 2008. [20] P. Bonacich, “Power and centrality: a family of measures,”
American Journal of Sociology, vol. 92, p. 1170C1182,
1987.
[21] L. G. Louis Licamele, “Social capital in friendship-event networks,”ICDM’06, 2006.
[22] B. A. H. Jure Leskovec, Lada A. Adamic, “The dynamics of viral marketing,”ACM Transactions on the Web, vol. 1, no. 1, May 2007.
[23] E. T. David Kempe, Jon Kleinberg, “Maximizing the spread of influence through a social network,” KDD’03, 2003.
[24] S. M. A. v. Z. Tim Carnes, Chandrashekhar Nagarajan, “Maximizing influence in a competitive social network: A follower’s perspective,”ICEC’07, Aug. 2007.
[25] S. W. C. F. Shashank Pandit, Duen Horng Chau, “Net-probe: A fast and scalable system for fraud detection in online auction networks,”WWW’07, 2007.
[26] M. C. Alvin Chin, “A social hypertext model for finding community in blogs,”HT’06, Aug. 2006.
[27] Z. F. T. A. Xiaowei Xu, Nurcan Yuruk, “Scan: A structural clustering algorithm for networks,”KDD’07, Aug. 2007.
[28] C. L. G. F. M. C. Gary William Flake, Steve Lawrence, “Self-organization and identification of web communities,”
IEEE Computer, vol. 35, no. 3, 2002.
[29] A. N. Hidehiko Ino, Mineichi Kudo, “Partitioning of web graphs by community topology,”WWW’05, May 2005. [30] C. L. G. Yookyung Jo, Carl Lagoze, “Detecting research
topics via the correlation between graphs and texts,”
KDD’07, Aug. 2007.
[31] R. S. Y. X. Rakesh Agrawal, Sridhar Rajagopalan, “Mining newsgroups using networks arising from social behavior,”
WWW’03, 2003.
[32] B. S., “The key player problem,”the National Academy of
Sciences Workshop on Terrorism., 2002.
[33] C. G. C. F. J. V. N. G. Jure Leskovec, Andreas Krause, “Cost-effective outbreak detection in networks,” KDD’07, 2007.
[34] K. H. B. L. Xiaodan Song, Yun Chi, “Information flow modelling based on diffusion rate for prediction and rank-ing,”WWW’07, May 2007.
[35] A. R. Barabasi, A.-L., “Emergence of scaling in random networks,” Science, vol. 286, pp. 509–512, 1999. [36] J. K. David Liben-Nowell, “The link prediction problem
for social networks,”CIKM’03, 2003.
[37] M.E.J.Newman, “Clustering and preferential attachment in growing networks,”Phys.Rev.E, vol. 64, July 2001. [38] P. S. Joshua O’Madadhain, Jon Hutchins, “Prediction
and ranking algorithms for event-based network data,”
SIGKDD Explorations, vol. 7, no. 2, pp. 23–30, Dec. 2005.
[39] A. T. Ravi Kumar, Jasmine Novak, “Structure and evolu-tion of online social networks,” KDD’06, Aug. 2006. [40] J. S. Tanya Y.Berger-Wolf, “A framework for analysis of
dynamic social networks,”KDD’06, Aug. 2006.
[41] D. K. Chayant Tantipathananandh, Tanya Berger-Wolf, “A framework for community identification in dynamic social networks,” KDD’07, Aug. 2007.
[42] J. L.Backstrom, D.P.Huttenlocher, “Group formation in large social networks: membership, growth, and evolution,”
KDD’06, Aug. 2006.
[43] A. D.Chakrabarti, R.Kumar, “Evolutionary clustering,”
KDD’06, Aug. 2006.
[44] M. T.Falkowski, J.Bartelheimer, “Mining and visualiz-ing the evolution of subgroups in social networks,”
IEEE/WIC/ACM International Conference on Web
Intel-ligence, 2006.
[45] C. P. D. Lise Getoor, “Link mining: A survey,”SIGKDD
Explorations, vol. 7, no. 2, pp. 3–12, Dec. 2005.
[46] C. R. L. D. P. K. A. P. S.-I. B. A. A. J. T. F. Boanerges Aleman-Meza, Meenakshi Nagarajan, “Semantic analytics on social networks: Experiences in addressing the problem of conflict of interest detection,”WWW’06, May 2006. [47] L. T. P. S. Nitin Agarwal, Huan Liu, “Identifying the
influential bloggers in a community,” WSDM’08, Feb. 2008.
[48] J. Kleinberg, “Challenges in mining social network data: Processes, privacy, and paradoxes,”KDD’07, Aug. 2007. [49] J. K. Lars Backstrom, Cynthia Dwork, “Wherefore art thou
r3579x? anonymized social networks, hidden patterns, and structural steganography,”WWW’07, May 2007.
[50] L. L. Mudhakar Srivatsa, Li Xiong, “Trust guard: Coun-tering vulnerabilities in reputation management for decen-tralized overlay networks,”WWW’05, May 2005. [51] C. F. Deepayan Chakrabarti, “Graph mining: Laws,
gener-ators, and algorithms,”ACM Computing Surveys, vol. 38, Mar. 2006.
[52] A. M. Ron Bekkerman, “Disambiguating web appearances of people in a social network,”WWW’05, 2005.
[53] M. H. Yutaka Matsuo, Junichiro Mori, “Polyphonet: An advanced social network extraction system from the web,”
[54] M. S. K. Masoud Makrehchi, “Learning social networks fromweb documents using support vector classifiers,”
IEEE/WIC/ACM International Conference on Web
Intel-ligence, 2006.
[55] J. L. Jing Zhang, Jie Tang, “Expert finding in a social network,”DASFAA’07, 2007.
[56] S. B. D. G. A. H. Jeffrey Davitz, Jiye Yu, “ilink: Search and routing in social networks,”KDD’07, Aug. 2007. [57] H. K. YongYeol Ahn, Seungyeop Han, “Analysis of
topo-logical characteristics of huge online social networking services,”WWW’07, May 2007.
[58] L. A. Jun Zhang, Mark S.Ackerman, “Expertise net-works in online communities: Structure and algorithms,”
WWW’07, May 2007.
Hui Lireceived the B.Eng from Harbin Institute of Technology in 2005 and Ph.D. degree from Nanyang Technological Uni-versity, Singapore in July 2012, respectively. He is a lecturer in School of Computer Science and Technology, Xidian University, China. His research interests include data mining and knowledge discovery.
Jiangtao Cuireceived his B.S. degree, M.S. degree and Ph.D degree in Computer Science and Technology from Xidian Uni-versity, China in 1998, 2001 and 2005, respectively. He is currently a professor at Xidian University, China. His current research interest includes hi-dimensional data indexing, image processing and database technology.