Page 20 www.ijiras.com | Email: [email protected]
Effects Of Play On Performance Of Learners In Early Childhood
Development And Education Centers Of Kyuso Sub-County -
Kenya
Esther Wangeci Mwai
Dr. Paul Maithya
Dr. Lucy Ndegwa
Lecturer, School of Education, Maasai Mara University
I. BACKGROUND TO THE STUDY
Study of play through time and across cultures has consistently demonstrated two characteristic features of play in human societies. First, it is clear that play is ubiquitous among humans, both as children and as adults, and that children’s play is consistently supported by adults in all societies and cultures, most clearly in the manufacture of play equipment and toys. Second, it emerges that play is a multi-faceted phenomenon, with a variety of types that appear in all
societies, but that there are variations in the prevalence and forms that the various types of play take in different societies. Several studies have compared play across cultures or sub-cultures, in relation to cultural attitudes and practices.
Cote and Bornstein (2009), for example, have reported a number of studies comparing play and attitudes to play amongst mothers and young children in Japanese, South American and European immigrant sub-cultures in the United States. A number of clear and consistent patterns emerge from these studies Early childhood development and Education Abstract: Play is an essential component of learning among children. Children learn best through play. Without using play, learning in children is impaired and apparently performance is affected. This study was conducted with an aim of investigating the effects of play on performance of learners in early childhood development and education centers in Kyuso sub-county, Kitui County in Kenya. The study used a survey research design to collect information in a standardized form from the sampled population. The target population was one hundred and sixty (160) teachers in the one hundred and twenty eight (128) early childhood development and education (ECDE) centers in Kyuso sub-county. Questionnaires were used to collect data from teachers of E.C.D.E Centers in the sub-county. The sample was an adequate representation of ECDE teachers in Kyuso sub-County E.C.D.E centers. The respondents were both male and female teachers. The study specifically used simple random sampling method and Questionnaires were used to collect data which were tested for both reliability and validity .The data collected was analyzed by the help of statistical package for social science (SPSS). Both descriptive and inferential statistics of analysis was used. Descriptive data was analyzed using frequency and percentages and presented using frequency tables and descriptive statements. Infeential analysis was done to establish the relationship between the variables. The study concluded that; ECDE teachers have various ways of developing play activities to suit their children. Play activities boosted performance in language activities, music and movement activities, science activities and mathematics activities. The study recommends for a replication of this study especially in areas designated as urban areas. This will enhance generalization of the findings of the current study.
Page 21 www.ijiras.com | Email: [email protected] (ECDE) is critical for future well-being of young children.
During the first few years, children’s brain develop in ways that have a lasting impact in their binocular vision, emotional control, habitual ways of responding, language abilities and early cognitive skills (UNICEF, 2001) Consequently ECDE programmes play an important role in preparing children socially, emotionally and intellectually for later education. ECDE programmes provide educational play opportunities (Nicolai, 2003).
According to Henderson (2006: 7), most pre- schools facilitate teaching without or with very little time for children to play. They lack adequate playing materials for children. This therefore underlines the efforts to rear a child holistically. The first Seminar on ECDE in Kenya was conducted in 1982 in Malindi town by Barnard Van Lee Foundation in conjunction with the Ministry of Education (M.O.E) to review the progress of the sub-sector, Waithaka (2002). This seminar made a few recommendations pertaining pre-school education in Kenya. One recommendation was use of play in early years of learning. The participants agreed that children learn better through playing with concrete materials, Waithaka (2002). They also agreed that through play children tend to perform a given task effectively. Another key recommendation was on the training of the early childhood development and education teachers (ECDE). By this recommendation, Kenyan government started setting up training institutions for ECDE teachers all over the country. It was agreed that trained ECDE teachers do better in terms of teaching which includes utilizing play for teaching and learning purposes. This study was compelled to find out how play affect performance in ECDE centers of Kyuso Sub-county in Kitui County.
A. STATEMENT OF THE PROBLEM
Despite the fact that play is the background of learning among children, overwhelming evidence that play has a great impact in children learning and a Consensus that if play is not used, the essence of learning in ECDE is lost. There is a dire need of data on effect of play on learning in various activities among ECDE children. The use of play definitely affects performance however, how it influences and the extent to which it influences is yet not known. This is the problem that the researcher wish to investigate with view of coming up with insights on how play affects performance among ECDE children in Kyuso Sub-county of Kitui County (K.C) in Kenya.
B. PURPOSE OF THE STUDY
The research investigated effects of play on performance of ECDE learners aged three (3) to six (6) years in Kyuso Sub-county of Kitui County, Kenya.
C. OBJECTIVES OF THE STUDY
The study was guided by the following three objectives: To find out the attitude of ECDE teachers on the use of
play activities in teaching learners at ECDE level.
D. RESEARCH QUESTIONS
The study answered the following three research questions.
What is the attitude of ECDE teachers on the use of play activities in teaching learners at ECDE level?
E. SIGNIFICANCE OF THE STUDY
The findings of the current study will be of significance to teachers, society, community and stakeholders in the following anticipated ways:-
It identified that ECDE teachers have a positive attitude towards use of play in ECDE centers.
Identified that most ECDE teachers use free play activities and to a little extent use directed activities to enhance performance.
Highlighted that play influences performance positively among ECDE learners.
ECDE teachers develop play activities and materials by the guidance of activity books by Kenya Institute of Curriculum Development (KICD).
II. LITERATURE REVIEW
Although it is simple to compile a list of play activities, it is much more difficult to define play. Scales called play “that absorbing activity in which healthy young children participate with enthusiasm and abandon” (Scales, 1991). Csikszentmihalyi (1981) describes play as “subset of life and arrangement in which one can practice behaviour without dreading its consequences (Csikszentmihalyi ,1981).Garvey (1977) gave a useful description of play for teachers when she defined play as an activity which is positively valued by the player, self-motivated , freely chosen , engaging and ,which has certain systematic relations to what is not play (Garvey 1977).These characteristics are important for teachers to remember because imposing adult values , requirements, or motivations on children’s activities may change the very nature of play. According to Waithaka (2002) In terms of young children, play means changing movement ;to act or imitate part of a person or character ;to employ a piece of equipment ;exercise or activity for amusement or recreation ; fun or just as opposed to seriousness or even the action of a game.
A. PLAY ACTIVITIES
Page 22 www.ijiras.com | Email: [email protected] other siblings, games with rules- children are involved in a
game and have to conform to a structure of present rules B. TYPES OF PLAY
Play for young children assume many different forms. An early researcher on children play Mildred Parten, (1932) focused on social interactions between children during play activities. Parten’s categories of play are not hierarchical. Depending on the circumstances, children may engage in any form of different types of play. Parten does note however that in her research with two-to- five years old, participation the most social types of groups occurs most frequently among the older children. Parten (1932). On looker behaviour, Playing passively by watching or conversing with other children engaged in play activities. Solitary independent, playing by oneself. Parallel, playing, even in the middle of a group, while remaining engrossed in activity, children playing parallel to each other. Sometimes use each other’s toys, but always maintain their independence. Associate, when children share materials and talk to each other but does not coordinate play objectives or interests. Cooperative, when children organize themselves into roles with specific goals in minds (e.g to assign the roles of doctor, nurse, patient and play hospital).
C. ATTITUDE OF ECDE TEACHERS ON PLAY
Orodho (1990) found out that teacher’s attitudes either negative or positive had a role to play in teaching and learning of early childhood science activities. Margolin (2002) says attitude of the teacher is critical in laying foundation of the learners. In many studies, positive attitudes are strongly correlated with positive mindsets. Attitudes influence teachers thinking ,behavior and motivation (Cassidy, Buell, Pugh-Hoese and Rusell,1995; Pajares,1996).The strength of teachers attitude helps determine “how much effort they will expend on an activity, how long they will persevere when confronted with an obstacle, and how resilient they will be when faced with adversity” (Vartuli ,2005)
Attitude is the feeling and believes which individuals hold towards an object or an aspect of education (Koballa 1998). Generally, attitudes are categorized as positive or negative. When positive, the person with the attitude thrives whilst negative attitudes negate achieving of objectives. Teachers with positive attitudes towards play will promote play whilst those with negative attitudes will ignore and not use play. There is little information on how attitude specifically affects the use of play in learning institutions. The study will therefore take her time to investigate this.
D. THEORIES ON PLAY
Play is a voluntary activity pursued without ulterior purpose and, on the whole, with enjoyment or expectation of enjoyment. (English and English, 1958). Theories of play were first developed during 18th and 19th centuries. Two theories affected the perception of why and how children play; the surplus energy theory and the instinct theory.
a. SURPLUS ENERGY THEORY
This theory advocates that, the child builds up excess energy and that active play is necessary to get rid of the surplus. Curtis (1916) proposed that when a child or animal does not need to expend all its energy in obtaining food, shelter or gaining a living that the leftover energy would be used for play. The current study utilizes the knowledge of this theory as the teacher is expected to utilize play to harness this surplus energy for the benefit of learning.
b. THE INSTINCT THEORY
This theory proposed by Rousseau suggests that play is inherited and that the child will engage in behaviours and activities instinctively. Stanley Hall, a leader of child study movement, attributed play to heredity as part of the recapitulation theory. Curtis (1961), explained this theory as follows “in his wild life of the savage there were certain activities, which were almost universal. It was necessary to pursue and capture his game, to find it while hiding, to strike it down with a stick or stone or shoot it with a bow and arrow. Often he had to climb trees, to vault over obstacles, or leap across brooks. At other times he was the hunted, and he had to flee or hide from such means as lay at hand. There were universal activities of savage man throughout the days of unrecorded history and it is these same activities that survive in the play of the child ” (Curtis, 1916:5). Since play is seen as instinctive, the study views this theory as an applicable to her study as teachers can just utilize that which exists in a child to boost learning and improve performance in the ECDE centers. This theory is therefore relevant and applicable in the study.
E. CONCEPTUAL FRAMEWORK
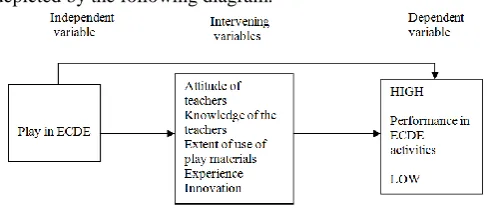
The researcher conceptualized the current research as depicted by the following diagram.
Figure 2.1: Conceptual Framework Of The Current Study
Page 23 www.ijiras.com | Email: [email protected] source for the information of play will have a positive
correlation with high performance. Apparently, negative attitude of the ECDE teachers towards use of play, inadequate knowledge on use of play, little extent of using play, inexperience and lack of innovation will lead to low performance.
III. METHODOLOGY A. RESEARCH DESIGN
The researcher used a survey design where a sample is selected from the large population and results are generalized. Gay(1995) asserts that survey design can be used to assess cause and effects of events. According to Orodho (2005), Survey deals with incidences, distribution and interrelations of educational variables. This design was therefore considered fitting for the study. The Survey design entails an in-depth empirical collection of data about a phenomenon.
B. STUDY POPULATION
The research was carried out in Kyusosub-County of Kitui County in Eastern region of Kenya. Kitui County has ten educational divisions and Kyuso is one of them. The study population was one hundred and sixty (160) teachers teaching in the one hundred and twenty eight (128) ECDE centres in KyusoSub-County. Most of the ECDE centres have one teacher. However, thirty two ECDE centres have two teachers each and hence a total of one hundred and sixty teachers (160).
C. SAMPLE SIZE AND SAMPLING TECHNIQUES. The researcher sampled a total of eighty (80) teachers out of one hundred and sixty from the study population. This sample represented fifty percent (50%) of the one hundred and sixty teachers in the Sub-county. The researcher’s sample (respondents) was therefore a representative of the study population of the teachers of ECDE centres in KyusoSub-county of Kitui County.The researcher specifically used simple random sampling method to obtain a representative sample. This is a probability sampling method whereby the researcher came up with a list of all ECDE centers in the Sub-county. The list of sampled schools from the study population was developed to ease the data collection procedure. According to Kothari, (2002) and Mugenda and Mugenda. (1999), simple random sampling method is appropriate for a population which is homogeneous in nature. The names of all the ECDE centers in the Sub-county were written on small pieces of papers folded and placed in a bucket and then the researcher randomly picked eighty (50%) pieces. According to Orodho, (2005) between thirty and fifty percent of the target population is enough to gather data for use in a survey study. This is also supported by Mugenda and Mugenda, (1999); Kothari, (2002); and Aryet al.(2006). The ECDE centers sellected formed the sample that was used for collecting data.Simple random sampling technique provided all the respondents with an equal opportunity to participate in the study.
D. INSTRUMENTS FOR DATA COLLECTION
Questionnaires were in gathering the data. Some of the items were open ended and others were closed-ended. Questionnaires were used because they covered high number of respondents in a given relatively short time. The respondents had freedom, privacy and confidence to put down what they felt was right because they did not reveal their identity. Questionnaires were a cheaper method of collecting data. The study established the content validity by seeking expert judgment from her supervisors in Maasai Mara University. To achieve this, the developed questionnaire was handed over to the supervisors who checked and confirmed that they measured effect of play on performance and gave comments about it. The instruments were then revised based on the supervisor’s recommendations. The researcher then re-submitted the corrected version of the instruments to the supervisor for final comment.
Kothari, (2002) asserts that a reliable instrument consistently produces the expected results when used more than once to collect data from the same sample randomly drawn from the population. To establish reliability, the study’s questionnaire were administered to four ECDE teachers who were not in the final study from the neighboring Sub-county. The study re-administered the questionnaires after one week to the same ECDE teachers to obtain scores for computing for. The Pearson’s Product Moment Correlation Coefficient Formula was used to compute the correlation coefficient index between the two scores to establish the extent to which the contents of the questionnaire were consistent in eliciting the same responses.
r = ∑xy (∑ x2) (∑ y2) Where
r = Pearson reliability coefficient index
x = the deviation of X scores from the mean (first test administration)
y = the deviation of Y scores from the mean (second test administration)
This study’s correlation coefficient index (r) is 0.9. Orodho, (2004) recommends a correlation coefficient index (r) of at least 0.8 or above. This study was therefore regarded as reliable.
E. DATA ANALYSIS
Page 24 www.ijiras.com | Email: [email protected] understood standard proportions. The data was then presented
using tables and figure in chapter four of this research thesis.
IV. FINDINGS A. RESULTS AND DISCUSSIONS
a. IMPORTANCE OF USE OF PLAY ACTIVITIES ON
CHILDREN
The study sought data on whether the respondents thought the play activities were imperative to children and apparently affecting performance. Data obtained was tabulated as shown in Table 4.1.
Response Frequency (n) Percentage (%)
Strongly Agree 72 90
Agree 8 10
Uncertain 0 00
Disagree 0 00
Strongly Disagree 0 00
Total 80 100
Table 4.1: Importance of Play Activities to Children According to Sampled Teachers
Table 4.1 indicates that, majority of the respondents strongly agreed that play activities were important to children learning. This constituted ninety percent of the respondents. A lesser percentage just agreed that play activities are essential to the children learning. This constituted ten percent of all respondents. Generally, all respondents believed that play is imperative to the children learning. In the light of importance of play the study, perceived the respondents as having positive attitudes towards play activities. Under typical conditions, a person with a positive attitude would tend to promote it. Therefore sampled teachers were likely to promote the use of play in their teaching.
The study obtained data on effects of play on learning of ECDE children. This was achieved by use of the questionnaire. The question addressed the issue on whether the play deprivations cause adverse effects on learning of early childhood children. The data obtained are presented in table 4.2.
Response Frequency (N) Percentage (%)
Strongly Agree 72 90
Agree 0 8 10
Uncertain 0 00
Disagree 0 00
Strongly Disagree 0 00
Total 80 100
Table 4.2: Effect Of Play Deprivations In Early Childhood According To Sampled Teachers
Table 4.2 clearly shows that almost all sampled respondents strongly agreed that play deprivations in early childhood caused adverse effects. The findings also concurs with the existing literature according to Waithaka (2002) that
shows deprivation of play to children could cause negative effects on learning on ECDE children.
B. PERFORMANCE OF PUPILS IN VARIOUS
ACTIVITIES
a. PERFORMANCE IN LANGUAGE ACTIVITIES
AFTER USE OF PLAY
The study sought to find out whether there was any trend in the performance of ECDE learners. Teachers were asked to rate their pupils’ performance in Term I, Term II and Term III of 2012. The study used one-way-repeated measures ANOVA (Analysis Of Variance) to detect two things: whether there was a significant difference in the learners’ performance in the four areas between Term I, Term II and Term III and whether there was a significant trend in performance from Term I to Term III.
One way repeated measure ANOVA with Huynh-Feldt correction was done to assess whether there was a significant difference in teachers’ ratings of learners’ performance in language activities in Term I, Term II and Term III. The results showed that the performance in language in the three terms was significantly different F(1.81,139.0)= 59.22 p<.001. Table 4.3 shows the mean and standard deviations for teachers’ ratings of performance in language activities in the three terms.
Term Mean Standard
Deviation
F sig value Term I
4.79 1.532
86.77 .000 Term II
5.73 1.402
Term III
6.53 1.673
Table 4.3: Means and Standard Deviations for Performance in Language
A look at Table 4.3 reveals that the mean rating for performance in language increased from 4.79 in Term I to 5.73 in Term II and then to 6.53 in Term III. The ANOVA revealed a significant linear trend F(1,77)= 86.77 p<.001. The results reveals that the mean rating for performance in language activities increased from Term I to Term II and then from Term II to Term III
b. INFLUENCE OF PLAY ON PERFORMANCE OF
PRE-MATHEMATICS ACTIVITIES
Table 4.4 shows the mean and standard deviations of the teachers’ ratings of performance in pre-mathematics activities before and after play activities were introduced.
Mean
Standard Deviation
t value sig value Before play
activities were introduced
3.60 1.41
7.54 0.000
After play activities
were
Page 25 www.ijiras.com | Email: [email protected] introduced
t(77)= 7.54 p<.001; F(1.9, 143.3)= 27.28, p<.001 Table 4.4: Means and Standard Deviations of Teachers Rating
of Performance in pre-Mathematics activities
Table 4.4 shows that the mean rating for performance in pre-mathematics activities before teachers began using play activities was 3.60 and the mean rating after they began using play activities was 5.19. These figures suggest that performance in pre-mathematics improved with the introduction of play activities. To test whether play activities significantly improved performance in pre-mathematics, a paired samples t-test was done. The result showed that the increase in teachers’ rating of performance was statistically significant t(77)= 7.54 p<.001. The mean increase in ratings of performance was 1.59 with 95% confidence intervals of 1.17 to 2.01. The Eta Squared statistic (.42) indicates a large effect size (Cohen 1988). This suggests that play activities had a major effect on performance in pre-mathematics activities.
c. PERFORMANCE IN PRE-MATHEMATICS
ACTIVITIES AFTER USE OF PLAY
One way repeated measure ANOVA with Huynh-Feldt correction was done to assess whether there was a significant difference in teachers’ ratings of learners performance in pre-mathematics in Term I, Term II and Term III. Table 4.5 shows the means and standard deviations for teachers’ rating of performance in pre-mathematics in Term I, Term II and Term III.
Term Mean Standard
Deviation
F value sig value
Term I 5.35 1.366
Term II 6.01 1.391 41.5 .000
Term III 6.74 1.647
Table 4.5: Means and Standard Deviations for Ratings of Performance in pre-Mathematics
An examination of Table 4.5 reveals that the mean for ratings of pre-mathematics performance increased from 5.35 in Term I to 6.01 in Term II and again increased to 6.74 in Term III. This shows that performance in pre-mathematics as rated by the teachers increased from Term I to Term III. The results of the ANOVA also revealed a significant linear trend F(1,77)= 41.5 p<.001. The trend in performance in pre-mathematics activities with the mean rating increasing from Term I to Term II and then from Term II to Term III.
d. INFLUENCE OF PLAY ON PERFORMANCE OF
PUPILS IN SCIENCE ACTIVITIES
Table 4.6 shows the mean and standard deviations of the teachers’ ratings of performance in science activities before and after play activities were introduced.
Mean
Standard Deviation
t test sig value Before play
activities were introduced
3.51 1.44
9.33 .000
After play activities were introduced
5.40 1.73
Table 4.6: Means and Standard Deviations of Teachers Rating of Performance in Science activities
Table 4.6 shows that the mean rating for performance in science activities before teachers started using play activities was 3.51 and this rating improved to 5.40 after they started using play activities. This suggests that use of play activities improved learners’ performance in science activities.
To assess whether play activities significantly improved performance in science, a paired samples t-test was carried out. The result indicated that the difference in teachers’ rating of performance before and after using play activities was statistically significant t(77)= 9.35 p<.001. The mean increase in rating of performance was 1.88 with 95% confidence intervals of 1.48 to 2.29. The Eta Squared statistic (.53) indicates a large effect size (Cohen 1988). This finding shows that play had a major effect on performance in science activities.
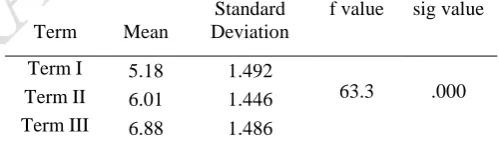
A one way repeated measure ANOVA with Huynh-Feldt correction was done to assess whether there was a significant difference in learners performance in science in Term I, Term II and Term III as rated by the teachers after the play activities. The results showed that performance in science activities in Term I, Term II and Term III was significantly different F(1.6, 122.1)= 63.32 p<.001. Table 4.12 shows the mean and standard deviation of teachers’ ratings in performance in science in the three terms.
Term Mean
Standard Deviation
f value sig value
Term I 5.18 1.492
63.3 .000 Term II 6.01 1.446
Term III 6.88 1.486
Table 4.7: Means and Standard Deviations for Ratings of Performance in Science activities
An examination of Table 4.7 reveals that mean ratings for performance in science activities increased from 5.18 in Term I to 6.01 in Term II and again to 6.88 in Term III. This shows that there was improvement in science activities performance from Term I to Term III. The results of the ANOVA showed that there was a significant linear trend in science activities performance F(1,77)= 84.68 p<.001.
DID PLAY INFLUENCE PERFORMANCE IN MUSIC AND MOVEMENT ACTIVITIES?
Table 4.14 shows the mean and standard deviations of the teachers’ ratings of performance in music and movement activities before and after play activities were introduced.
Mean
Standard
Deviation N Before play activities
were introduced
3.94 1.86 80
After play activities were introduced
5.99 1.93 80
Page 26 www.ijiras.com | Email: [email protected] Table 4.14 shows that before teachers started using play
activities, their mean rating for performance in music and movement activities was 3.94. After they started using play activities their mean rating increased to 5.99. This indicates that performance in music and movement activities improved as a result of using play activities.
A paired samples t-test was done to ascertain whether the use of play brought about a statistically significant improvement in performance in music and movement activities. The results showed there was a statistically significant improvement in teachers’ ratings of performance in music and movement activities (77)= 9.12 p<.001. The mean increase in rating of performance was 2.05 with 95% confidence intervals of 1.60 to 2.50. The Eta Squared statistic (.51) indicates a large effect size (Cohen 1988). This finding shows that play had a major effect on performance in music and movement activities.
PERFORMANCE IN MUSIC AND MOVEMENT ACTIVITIES
A one way repeated measure ANOVA with Huynh-Feldt correction was done to assess whether there was a significant performance in learners performance in music and movement activities in the three terms as rated by the teachers. The results showed that the performance in Term I, Term II and Term III were significantly different F(1.77, 136.46)= 80.56 p<.001. Table 4.13 shows the mean and standard deviations for teachers’ ratings of performance in music and movement activities in the three terms.
Term Mean
Standard
Deviation N
Term I 5.59 1.498 78
Term II 6.50 1.393 78
Term III 7.74 1.533 78
Table 4.15: Means and Standard Deviations for Performance in Music and Movement activities
A look at Table 4.15 reveals that mean teachers’ ratings of performance in music and movement activities increased from 5.59 in Term I to 6.50 in Term II and then to 7.74 in Term III. This finding indicates that performance in music and movement activities increased from Term I to Term III. The ANOVA showed a significant linear trend in performance F(1,77)= 115.06 p<.001. Figure 4.4 is a graphic representation of this trend. The results indicates that an increase in mean rating of performance from Term I to Term II and then again from Term II to Term III.
c. WAYS OF DEVELOPING PLAY ACTIVITIES FOR
USE TO INFLUENCE PERFORMANCE
The researcher was also concerned on where the teachers obtain information on use of play materials in ECDE centers. This data was obtained and is show by the table 4.16 that follows.
Source of information
S1 S2 S3 S4 S5 S6 S7 S8
Frequency 60 20 68 8 4 4 4 4
Percent 75 100 85 10 5 5 5 5
Table 4.16: Source of Information for Sampled ECDE Teachers on the Use of Play
KEY.
S1 ECDE syllabus. S2 Activities book by KICD. S3 Hand book for ECDE. S4 Resource people. S5 Radio. S6 Story books. S7 Picture books. S8 Resource books.
From the table 4.16, it is true that all teachers get information on use of play from more than one source. All the sampled teachers (100.00 %) obtain information from activities book. Majority of teachers also obtain extra information from teachers’ handbook for ECDE. This was eighty five percent (85 %). There is also a large sample that obtains information from ECDE syllabus (75 %). A lesser percentage (10 %) got information from resource persons. Other sources of information are radio, story books, picture books and resource books. The researcher is convinced beyond reasonable doubt that the sampled teachers know where to get information on use of play.
d. THE EXTENT OF USE OF PLAY IN VARIOUS
ACTIVITY AREAS
The study investigated the extent of using play in various activity areas. The following data was obtained.
Table 4.17.Extent Of Use Of Play In Sampled Schools
The table indicates that sampled teachers didn’t use the play always during their teaching endavour. This shows that teachers sampled do not believe play is absolutely important in teaching in ECDE hence they did not use it to teach every activity. Seventy five percent of teachers said that they used play frequently in their teaching. Twenty five percent of the teachers responded by stating that they rarely used play in their teaching. It was also impressing to note that no teacher who did not use play at all. This indicates that the teachers sampled had a positive attitude towards use of play in teaching. This shows an encouraging trend in use of play by sampled ECDE teachers in teaching language, mathematics, science, music and movement. The findings present a positive trend where performance in sampled ECDE centers will show an upward trend upon use of the play.
Response Frequency (N) Percentage (%)
Always 0 0.00
frequently 60 75.00
Rarely Not at all
20 0
25.00 0.00
Page 27 www.ijiras.com | Email: [email protected] V. SUMMARY OF USE OF PLAY IN LEARNING TO
IMPROVE PERFORMANCE LANGUAGE, MATHEMATICS, SCIENCE AND MUSIC AND
MOVEMENT ACTIVITIES
The researcher investigated teacher’s attitudes towards play. The study revealed that all the teachers were of the view that play is important with 90% strongly agreeing that play was important. The study also revealed that all the teachers were of the opinion that depriving children of play was detrimental to their development. Teachers’ attitudes are important determinants of learning outcomes in early childhood education (Orodho 1990 &Margolin 2002). Their attitude towards play also determines their disposition towards it. According to Vartuli (2005), teachers with an inclination towards play are more likely to encourage their pupils to play and provide conditions essential for play. The study established that ECDE teachers in Kyuso Sub-county view play positively hence one can conclude that their attitude towards play is good for the children.
A. CONCLUSIONS
From the data analyzed, the study concludes that; ECDE teachers have a positive attitude towards use of play in ECDE centers of Kyuso Sub-County. Use of play positively influences performance in language, pre-mathematics, science and music and movement activities. ECDE teachers obtain information on use of play activities from curriculum activities book for ECDE.
B. RECOMMENDATIONS
The researcher came up with the following recommendations;
County governments should provide funds for purchasing playing materials to all ECDE centers in to enhance performance.
Parents should be educated on the importance of play in children and so there should be workshops in pre-schools for parents to come and improvise the materials.
Teachers: All the ECDE teachers in the Sub-county should act as the role models by participating in play. They should create time to be with children during play. Curriculum developers: The time allocated for playing in
centers should be increased to allow children to explore, discover and experiment.
C. SUGGESTIONS FOR FURTHER RESEARCH
As a result of the study, the researcher identified certain areas that might require additional research. The following are the areas of study that the researcher recommends;
A replication of this study especially in areas designated as urban areas. This will enhance generalization of the findings of the current study.
Studies to establish the exact effects of teachers’ attitude towards use of play activities in areas designated as rural.
REFERENCES
[1] Ary, D., Jacobs, L.C., Razavier, A., & Sorenson , C., (2006), Introduction to research in Education, (7th Edition) Belmont, Thomas Wadsworth.
[2] Berk, L (1985).Relationships of caregiver education to child oriented attitudes, job satisfaction and behaviours
towards children, child care. New York: Macmillan.
[3] Chapman, J., (2009), Early Intervention, Parent Involvement in Early Schooling and long term school success. Doctoral Dissertation, unpublished, Madison: University of Wisconsin, Madison.
[4] Csikszentmihalyi, M., (1981). Some paradoxes in
definition of play. New York, Leisure press.
[5] Curtis, H.S., (1916). Education through play. New York: Macmillan.
[6] Garvey, C., (1977). Play, Cambridge, M. A: Harvard university Press.
[7] Henderson, S.E and Sudgen, D.A (1992). Movement
Assessment Battery for children manure. The
psychological cooperation. Columbus Ohio: Merill
Publishing Company.
[8] Koballa (1998).Understanding Teaching Profession, Benin City: Osasu Printing Press.
[9] Kothari, C.R., (2002), Research methodology- Methods
and techniques, NewDelhi, New Age.
[10]Margolin J.B (2002). Teaching young children at school
and at home. New York: Macmillan Publishing Co. Inc.
[11]Mugenda, O. and Mugenda, A. (1999), Research
methodology: Qualitative and Quantitative approach,
Nairobi, Achem press.
[12]Nicolai S. (2003). The new meaning of Educational
Change. London: RoutledgeFalmer.
[13]Orodho J.A (2004). “The path of development through science and technology; The dilemma of Kenya”. Seminar paper No 20209 presented at the Bureau of Research at Kenyatta University (October 23rd 1990).
[14]Parker (1999).Curriculum and Instruction: an
introduction to methods of Teaching. London: Macmillan
Publishers.
[15]Parten, M. B. (1932). Social participation among pre-school children. Journal of abnormal psychology, 21 (3) 243-269.
[16]Scales, B. Almy, M.J Nicolopulou, A.J Ervin – Tripp, S. (1991). Defending play in the lives of children. New York, Teacher’s college, Columbia University.
[17]Vartuli (2005).Readings in Education Psychology, Owerri: Barloz Publishers Inc.