R
esearch
A
rticle
INFLUENCE OF CHELATING AGENT (PVA & PEG) ON THE MICROSTRUCTURE AND
MAGNETIZATION OF NI-ZN NANOFERRITES
1
Laxminadh, M.
*,2GSVRK Choudary,
3Dr. Padmaja Rani
,
G.,
4Ch Sivasankara Rao, and
5
Ravi Kumar, G.
1
Department of Physics, Marri laxma reddy Institute of technology, Dindigul, Secunderabad 500043, India
2
Department of Physics, Bhavan’s Vivekananda College, Sainikpuri, Secunderabad 500094, India
3
Department of Physics, JNTU College of Engineering Kakinada, Kakinada-533003, India
4
Department of Basic Sciences and Humanities, Vignan's Nirula Institute Of Technology And Science For Women,
Guntur-522005, India
5
Department of Physics, Sreenidhi Institute of Science and Technology, Hyderabad, Telangana, 500029, India
ARTICLE INFO ABSTRACT
The selection of suitable chelating agent for particular ferrite composition becomes critical in attaining an optimum particle size with a precise control. Since the increase in viscosity and prevention of cation segregation due to addition of chelating agent and the nature of cat-ions play crucial role in controlling the particle size. In this view nano crystalline Ni0.65Zn0.35Fe2O4 ferrites have been synthesized by sol-gel technique using PVA and PEG as chelating agents at different annealing temperatures. The heat treated samples were characterized by X-ray diffraction, FT IR spectra, transmission electron microscopy and VSM. The impact of chelating agents on the crystallite size, particle size, and saturation magnetization at different annealing temperatures has been studied as part of investigation. FT IR spectra reveal the presence of PVA and PEG in the ferrite samples up to 6000C.
INTRODUCTION
Study of ferrites has been the subject of many researchers for the past several years due to their novel electromagnetic properties. Though the performance of these ferrites markedly improved, effective function in microwave frequency range still remains a challenging task. It is well known that chemical, structural, and magnetic properties of ferrite particle are strongly influenced by their composition and microstructure which are sensitive to method of preparations and annealing
temperatures (Li et al., 2004; Caruntu et al., 2002). The study
of nano crystalline spinel ferrite particles has attracted great interest among researchers due to their relevance to application in biological fields, magnetic resonance imaging enhancement, magnetically guided drug delivery, sensors and pigments (Sugimoto, 1999; Safarik, 2002). This goal is achieved more easily using wet chemical methods such as sol-gel process. Polymerizable complex method seems to be the easiest and the most elegant variation of sol-gel methods.
*Corresponding author: GSVRK Choudary,
Department of Physics, Bhavan’s Vivekananda College, Sainikpuri, Secunderabad 500094, India.
The completion of this technique requires only inexpensive chemicals, a beaker, a stirrer, a hot plate and a furnace. It is not sensitive to the presence of water, it does not require inert atmosphere and even without careful control of gel processing time and stirring rate one should be still able to obtain samples of excellent homogeneity (Hiromitsu Kozuka and Sumio sakka). It is the combination of these factors that explains the growing interest of this method for the synthesis of ferrites among the researchers. The basic idea of this approach involves preparation of a precursor solution, in which the ions are well mixed on a molecular scale. The precursors are heated to cause decomposition of chemical constituents and produce the desired multi-component oxide phase. The homogeneity of metal ions distribution achieved in the solution allows formation of nanoscale powders at lowering synthesis temperature due to shorter diffusion path. The chelating agent dissolved in de-ionized water is added to precursors so as to arrest particle growth while heating. The addition of chelating agent increases viscosity and in some cases changes the pH of the precursor solution. The increase in viscosity is often referred to as gelation.
Article History:
Received 28th May 2015
Received in revised form 30th June, 2015 Accepted 21st July, 2015
Published online 31st August, 2015
International Journal of Recent Advances in Multidisciplinary Research Vol. 02, Issue 08, pp.0631-0636, August, 2015
Keywords:
Crystallite size, Particle size,
Annealing temperature, PVA and PEG.
A chelating agent forms several bonds with a single metal ion
providing necessary environment to prevent cat-ion
segregation. The increase in viscosity and prevention of cat-ion segregation allows outstanding control in arresting the particle growth. Also the nature of cat-ions affects the rate of viscosity
increase (Arima et al., 1996; Kakihana et al., 1997). Therefore
selection of suitable chelating agent for particular ferrite becomes critical in attaining an optimum particle size with a precise control. In the present investigation a familiar Ni-Zn composition Ni0.65Zn0.35Fe2O4 has been chosen and processed through sol-gel method using two chelating agents polyvinyl alcohol (PVA) and polyethylene glycol (PEG). A systematic investigation by procuring enough information through various techniques has been carried out to optimize the method of
processing, heating temperature, and particle size.
Experimental
The method of preparation of samples was described elsewhere
(Mahesh Kumar et al., 2008). FT IR spectra of finely crushed
powder were recorded for the all samples in the range - 4000
cm-1 to 400 cm-1 on MAGNA 550 Nicolet Instruments
Corporation wherein KBr is used as solvent in 1:3 proportions.
The spectrum, transmittance (%) against wavenumber (cm-1)
has been used for the interpretation of the result. The XRD
measurements were carried out using Bruker D8 Advance X-ray diffractometer. The x-rays were produced using a sealed
tube and the wavelength of x-ray was 0.154 nm (Cu K-alpha). The x-rays were detected using a fast counting detector based on Silicon strip technology (Bruker LynxEye dtector). The TEM (Hitachi H-7500) at required magnifications is used to obtain structural information from the samples that are very much thin to transmit electrons. Room temperature magnetization of the sample was measured using a VSM (115 PAR-EG&G Model) under an external magnetic field of 20
kOe.
RESULTS AND DISCUSSION
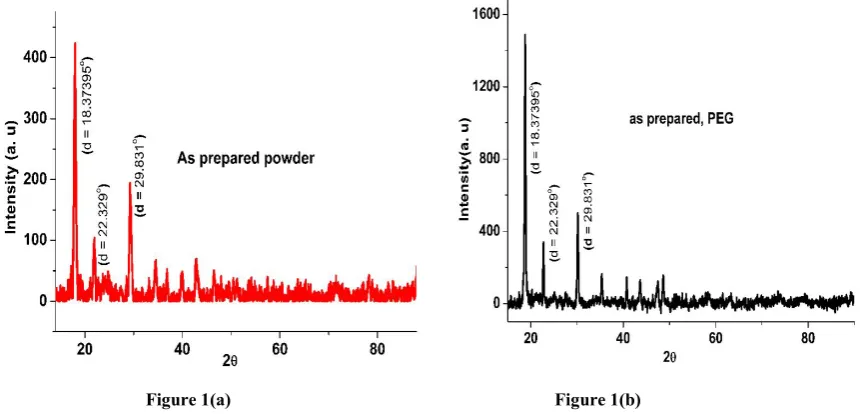
The XRD patterns of asprepared Ni0.65Zn0.35Fe2O4 with PVA
and PEG matrices are shown in Figure 1(a) and 1(b).
As the observed x-ray diffraction peaks of as prepared powder
(figure 1(a)) correspond to nickel oxide [d= 18.373o,jcps
85-1977], zinc oxide [22.329o,jcps 78-1124], ferric oxide [29.96o,
jcps 87-1166] and magnetite [29.831o,jcps 19-0629], the initial
ingredients are simply converted into oxides with no indication
of ferrite formation at 100 0C. To initiate the formation of
ferrite via the solid state reaction among the ingredient oxides present in asprepared powder, the sample were annealed to higher temperatures.
At 200 oC (Fig 2a and 2b) start of ferrite formation has been
observed with the appearance of the standard peaks corresponding to characteristic reflection of Ni-Zn JCPDS Card
no. 08-0234. In the PVA sample annealed at 200 oC (Figure 2a),
non-reacted nickel oxide and zinc oxide has been observed to persist in the material. In order to obtain single phase spinel structure with narrow peaks, it is thought necessary to anneal the materials to higher temperatures. The required ferrite
formation has been observed to be completed at 400 0C and
X-ray diffraction pattern of the material (Figure 2a and 2b)) has shown single phase spinel structure with broad peaks representing smaller crystallite size.
The observed gradual increase in sharpness, intensity and decrease in full width at half maximum of X-ray diffraction
peaks of powdersannealed at 600 0C and 750 0C in both PVA
and PEG matrices (Figure 2a and 2b) asserts the improved crystallization process with annealing temperature. Crystallite size estimation in all the samples has been made from full width at half maximum values of x-ray diffraction patterns
using Scherer equation. Crystallite size at 4000C, 6000C and
7500C has been found increasing with increasing annealing
temperature (Table 1). The growth of crystallite size beyond
400oC was assumed to depend solely on annealing temperature
as polyethylene glycol (PEG) and polyvinyl alcohol (PVA) are
known to leave the system between 200 0C and 400 0C (Nasser
et al., 2008; Caruso et al., 1999; Koseoglu et al., 2011; Xiaotun
et al., 2003). To ascertain this fact, FT IR spectra were
recorded for the samples containing both PVA and PEG heated
at 200oC, 400oC, and 600oC in the range - 3000 cm-1 to
400 cm-1 on MAGNA 550 Nicolet Instruments Corporation as
shown in Figure 3(a) and 3(b).
Figure 1(a) Figure 1(b)
Figure 2(a) Figure 2(b)
Figure 2(a), 2(b). XRD patterns of the basic Ni-Zn ferrite annealed at different temperatures with PVA and PEG matrices
Figure 3(a, b). FT IR spectra of Ni-Zn ferrite annealed at different temperatures with PVA and PEG matrices
In these FT IR spectra several characteristic band were
observed. The bands at wavenumbers 590 cm-1 (1) and 425
cm-1 (2) correspond to two sublattices, tetrahedral and
octahedral sites of spinel ferrite while the bands at 3404 cm-1,
2924 cm-1, 1407 cm-1 in PVAspectra and 3397 cm-1, 2901 cm-1,
1360 cm-1in PEGspectra are attributed to O-H stretching, C-H
stretching and C-H bending respectively . With increase in temperature, it is observed that the transmission intensity of bands corresponding to O-H stretching, H stretching , and C-H bending in PVA and PEG spectra gradually decrease indicating that both the chelating agents were present to certain
extent in the samples even at 6000C attributing to good control
of particle size.
From these spectra it is found that each spectrum consist of two significant absorption bands which reveal the formation of single phase of spinel ferrites having two sublattices, tetrahedral site and octahedral site. The observed first band at
higher wavenumber of 590 cm-1 (1) and the second band at
lower wavenumber of 425 cm-1 (2) have been attributed to
the stretching vibrations of bond between cation and oxygen ions at tetrahedral and octahedral sites respectively. The
difference in the positions of absorption bands (1, 2), has
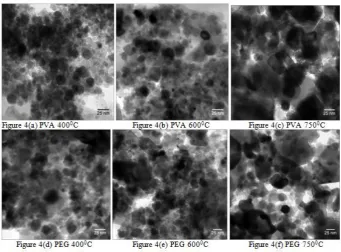
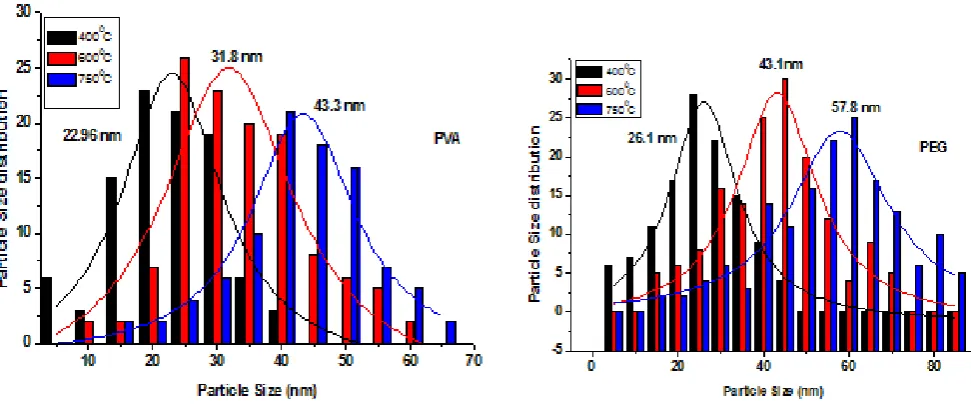
been attributed to the difference in bond lengths (cation and oxygen ions) within tetrahedral and octahedral sites (Rao, 1963). It is also observed that there is no shift in wavenumbers corresponding to tetrahedral and octahedral sites indicating no change in cation distribution with increase temperature. Figure 4(a) to 4(f) shows transmission electron micrographs of basic nickel-zinc ferrite annealed at different temperatures with PVA and PEG matrices where fine and uniform particles have been observed. The average particle size has been estimated from volume averages of number of TEM pictures for a particular sample by fitting the particle size distribution with a Lorentz function. These fittings for all samples at different annealing temperatures with PVA and PEG matrices are shown in Figure 5(a) and 5(b).
PVA and PEG matrices
Crystallite size is usually referred to particle whose size is less than 100 nm. In case of nanomaterials, Scherrer equation using full width at half maximum corresponding to experimentally observed x-ray diffraction peaks would provide crystallite size
(Hall, 2000; Cullity and Stock, 2003). The particle size has
been determined from shape analysis of transmission electron micrographs. The crystallite and the particle sizes are observed to be comparable for all the samples (Table 1). This results show that the synthesized powder has nono- sized crystallites.
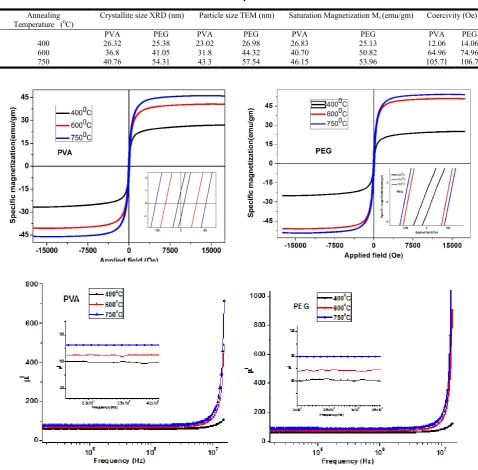
Figure 6(a) and (b) show room temperature magnetic hysteresis loops of basic composition, Ni0.65Zn0.35Fe2O4, annealed at different temperatures with PVA and PEG matrices. These curves highlight two very important facts, one the increase in specific saturation magnetization and the other, broadening of the hysteresis loop (inset picture in Figure 6(a) and 6(b)) indicating increase in coercivity of these samples with annealing temperature. The obtained values of saturation magnetization are lower than those of bulk ferrite (Smit and Wijin, 1961). The lower value of saturation magnetization at smaller size is attributed to the surface effects that appear as a result of finite size of nonocrystallites and which lead to a non-colinearity of the magnetic moments at the nanocrystallite surface. The effects reduce as the crystallite size increase and
the surface/volume ratio decrease (Kodama et al., 1996; Caizer,
2002; Mollard et al., 1977). Also increasing annealing
temperature causes an increase in density of the material and a decrease in the number of pores that act as pinning centers for the electron spins (Smit and Wijin, 1961). The gradual increase in particle size with annealing temperature may produce larger magnetic domains with improved spin alignment. The field required for the rotation of spins in such a case increases and thereby causing higher coercive force in the material. All these factors contribute and naturally lead to increase in saturation
magnetization.
As the particle size increases, coercivity increases initially and attains a maximum at a critical size which is controlled by the anisotropy energy responsible for opposing spin rotation away from the easy axis of magnetization. Further increase in particle size, beyond the critical value, results in transition from single domain to multi-domain behavior where the coercivity starts decreasing with increasing particle size (Pankhurst and Pollard, 1993). At transition from single domain to multi domain, magnetization increases due to domain wall movement under
the action of the magnetic field. Though PVA and PEG served
as good chelating agents in controlling the crystallite size, the effect of annealing temperature on the crystallite size established PVA matrix is better of the two due to lower particle size. This might be the due to the fact that PVA has provided high dense matrix in controlling the crystallite size than PEG. But higher saturation magnetization and coercivity have been noticed for Ni-Zn ferrites in PEG matrix due to larger grain growth.
Observed variations in magnetizations also seem to following the same trend as that of the crystallite sizes in both the matrices under study.
Conclusion
As more flexibility lies with smaller crystallite size to tailor the properties, PVA is considered as suitable chelating agent than PEG for nickel Zinc ferrite in attaining an optimum particle size with a precise control. Further heat treatment beyond
7500C would give better idea to ascertain this fact.
Acknowledments
“The part of this work (X-ray diffraction) was performed at
UGC-DAE Consortium for Scientific Research, Indore”. We
are also grateful to DST and SAIF, IIT Mumbai, India for providing transmission electron microscope and FT-IR measurements.
Table 1. Comparison of crystallite size, particle size, saturation magnetization and coercivity of Ni-Zn ferrite annealed at different temperatures with PVA and PEG matrices
Annealing Temperature (0C)
Crystallite size XRD (nm) Particle size TEM (nm) Saturation Magnetization Ms (emu/gm) Coercivity (Oe)
PVA PEG PVA PEG PVA PEG PVA PEG 400 26.32 25.38 23.02 26.98 26.83 25.13 12.06 14.06 600 36.8 41.05 31.8 44.32 40.70 50.82 64.96 74.96 750 40.76 54.31 43.3 57.54 46.15 53.96 105.71 106.7
Authors also thank Mr. Shiva Kumar, IIT Kanpur for VSM measurements. One of the authors (GSVRK Choudary) would be thankful to the management of Bhavan’s Vivekananda College, Sainikpuri, Secunderabad, for their constant support.
REFERENCES
Arima, M., Kakihana, M., Nakamura, Y., Yashima, M. and
Yoshimura, M. 1996. J. Am. Ceram. Soc., 79: 2847–2856
Caizer, C. 2002. J. Magn. Magn. Mater. 251, 304.
Caruntu, D., Remond, Y., Chou, N.H., Jun, M.J., Caruntu, G., He, J., Goloverda, G., Connor, C.o’. and Kolesnichenko, V.
2002. Inorg. Chem., 41, 6137
Caruso, F. Susha, A.S. Giersig, M. Mohwald, H. 1999. Adv.
Mater 11, 950.
Cullity, B. D. and Stock, S. R. 2003. Elements Of X-Ray
Diffraction 3rd edition Addison-Wesley series in metallurgy
and materials
Hall, B. D. 2000. J. Appl. Phys. 87 (2000)1666
Hiromitsu Kozuka and Sumio sakka, Handbook of sol–gel
science and technology-processing, characterization and
applications, Kluwer academic publishers, pp 77
Kakihana, M., Okubo, T., Arima, M., Uchiyama, O., Yashima,
M., Yoshimura, M. and Nakamura, Y. 1997. Chem. Mater.
9: 451–456
Kodama, R.H. Berkowitz, A.E. McNiff, E.J. and Foner, S.
1996. Phys. Rev. Lett. 77, 394.
Koseoglu, Y. Bay, M. Tan, M. Baykal, A. Sozeri, H. Topkaya,
R. and Akdogan, N. 2011. J. Nanopart. Res., 13, pp.
2235–2244.
Li, F., Liu, J.J., Evans, D.G. and Duan, X. 2004. Chem. Mater.
16 1597
Mahesh Kumar, A., Chaitanya Varma, M., Charu Lata Dube,
Rao, K.H. Subhash C. Kashyap, 2008. J. Magn. Magn.
Mater. 320, 1995
Mollard, P. Germi, P. and Rousset, A. 1977. Physica., 86–88B.
Nasser, A. M. Barakat, Kee-Do Woo, Muzafar A. Kanjwal, Kyung Eun Choi, Myung Seob Khil and Hak Yong Kim,
2008. Langmuir 24, 11982-11987.
Pankhurst, Q.A. Pollard R.J. 1993. J. Phys. Condens. Matter 5
8487.
Rao, C. 1963. Chem. Appl. IR Spec., Academic press,p.356
Safarik, I. and Safarikova, M. 2002. in: H. Hofmann, Z.
Rahman, U. Schubert (Eds.), Magnetic Nanoparticles and
Biosciences in Nanostructured Materials, Springer, pp.1-23.
Smit, J. and Wijin, H.P.J. 1961. Les ferrites, Bibl. Tech.
Philips, Paris,
Sugimoto, M. 1999. J. Am. Ceram. Soc., 82, 269.
Xiaotun, Y. Lingge, X. Choon, N. S. and Hardy, C. S. 2003.
Nanotechnology, 14, 624.