Vol. 06, Issue 02 (February. 2016), ||V2|| PP 35-40
Study on the change of porosity and permeability of sandstone
reservoir after water flooding
Wang Ziyi
College of Earth Sciences, Northeast Petroleum University, DaQing, Hei Longjiang, China, 163318
Abstract: After water flooding development, Great changes have occurred in the porosity and permeability of sandstone reservoirs with the development time. The value of these parameters will effect reserves calculation and numerical simulation, and have an important role of guiding development adjustment programs and tapping remaining oil. In this paper, the varieties of reservoir parameters were analyzed with the results of logging interpretation and core analyzing. The values of porosity and permeability gradually increased with the development time. There exists four period during the whole stage: platform period, slow ascent period, fast rising period and relatively stable period. It is mainly related to the formation process of the underground seepage network. The change of porosity and permeability is mainly affected by reservoir properties, water injection time and well density. The better the original physical property of the reservoir, the longer the injection time and the greater the density of well network, then variation of porosity and permeability is larger. When the
well spacing density reach 50-60 well/km2 and average water saturation is about 55 percent, reservoir porosity
and permeability will not increase obviously.
Keywords: Reservoir; Porosity; Permeability; Water saturation; Well density
The research results at present show that the porosity and permeability of the reservoir have changed
to a different degree with the increase of the oil field exploitation time. Especially in the heterogeneous reservoirs, Long-term water injection leads to the formation of the preponderance flow path. there is different water-injected multiple in different location, so porosity and permeability changes are different. Furthermore, the reservoir heterogeneity is further exacerbated. It will directly affect the distribution of the remaining oil in oilfields. Therefore, it has important significance to grasp the rules of the variation of reservoir porosity and permeability to the adjustment of oilfield development. In this paper, the variation of porosity, permeability with time was studied with the data of cores and well logging in Xingshugang oilfield Sapu oil layer, and the reasons leading to the changes were analyzed.
Xingshugang oilfield is located in the Heilongjiang Province, Daqing City. The reservoir of SA Pu
layer buried depth is 1000m around, Reservoir was formed in fluvial delta depositional environment, there mainly developed sand bodies such as meandering river, delta distributary plain, delta front and prodelta during the period.
The target area began to be developed from the 1960s and has experienced four well network period
till today: The basic well pattern (1960-1983), the first well pattern (1984-1993), the second well pattern (1994 to 2006), the third well pattern (2007-2015). Because the data of drilling, logging and cores can be reflected the characteristics of the reservoir parameters in different time, the variation of reservoir parameters during different periods can be analyzed using these data.
I.
THE CHANGE OF POROSITY AND PERMEABILITY OF RESERVOIR AFTER
WATER FLOODING
With the data of porosity and permeability value from different core wells in different time, after
water flooding, The average porosity is generally increased by 0.5-4% and the average permeability is increased
unequal 100-600×10-3μm2. The porosity and permeability changes of different sand body were different. In
Table 1 The change of porosity and permeability of different sand bodies before and after water flooding
Sand body types Thickness
(m)
Porosity(%) Permeability(×10-3μm2)
before after rise before after rise
Meandering river 6.7 28.41 31.68 3.27 909.42 1470.1 560.68
Overwater channel 3.9 28.24 30.32 2.08 755.71 1002.45 246.74
Submerged channel 3.2 28.26 28.54 0.28 407.42 659.21 251.79
Overwater non channel 0.9 27.96 28.1 0.14 354.25 548.04 193.79
Submerged non channel 0.6 26.05 26.72 0.67 141.98 304.38 162.4
From the table 1, porosity and permeability of different sand bodies are increased with the increase of water injection time, but the increasing extent was different. The greater the thickness of the single sand bodies, the greater the increase in porosity and permeability. so the thickness of sand body in a certain extent can reflect the formation of sand bodies. The relation of porosity, permeability and thickness of single sand body were analyzed with the data from core wells in different periods, the results show that porosity and thickness, permeability and thickness have positive correlation. There exists different porosity and permeability change trend with different thickness: when thickness is greater than 2m, the change of porosity and permeability are little with thickness growth; while thickness is less than 1m, the change of porosity and permeability are greater with thickness increase; when the thickness is in the range of 1-2m, there exist a middle porosity and permeability change range. Therefore, according to the thickness, the single sand body is divided into three types, type I (the thickness of single sand body is greater than 2m), type II (the thickness of single sand body is between 1-2m), type III(the thickness of single sand body is greater than 1m).
Fig. 1 the cross-plot of porosity, permeability and the thickness of the single sand body
Porosity and permeability of all wells every year in target area were computed and counted, the porosity and permeability of different type sand bodies changed with time (Fig. 2).
(1) The porosity and permeability of different type sand bodies showed an upward trend, and the greater the thickness of the single sand body, the greater the rise.
The rise of type I sand bodies increased the maximum, the average porosity increased from 26.1% to 30.1%, the
average penetration increased from 447×10-3μm2 to 102×10-3μm2.
The rise of type II sand bodies was in the middle, the average porosity increased from 25.9% to 28.9%, the
average penetration increased from 293×10-3μm2 to 61×10-3μm2.
The rise of type Ⅲ sand bodies is the smallest, the average porosity increased from 25.8% to 28.1%, and the
average permeability increased from 60×10-3μm2 to 178×10-3μm2.
Fig.2 The scatter plots of porosity, permeability and well density of different type sand bodies with time
The platform period before 1978: During this period, underground seepage field were forming, Interconnected pore throat network is in the formation stage. Average water saturation is less than 35% in the target area and average porosity and permeability keep no change.
Rapid rise period between 1979-1993: During this period, the change of reservoir parameters is relatively large.
Porosity of type I sand bodies increased by 2.5% and the permeability increased by about 165×10-3μm2. Porosity
of type II sand bodies increased by only 2% and the permeability increased by about 87.6×10⁻³μm2. Porosity of
type III sand bodies increased by only 1.3% and permeability increased by about 45.3×10⁻³μm2 In this stage, average water saturation in target area is always between 35-50%.
Slowly rising period between 1994-2005: During this period, the reservoir parameters change is slightly,
Porosity of type I sand bodies increased by 1.2% and the permeability increased by about 74.2×10⁻³μm2.
Porosity of type II sand bodies increased by only 0.9% and the permeability increased by about 55×10-3μm2.
Porosity of type III sand bodies increased by only 0.6% and the permeability increased by about 30.5×10⁻³μm2.
In this stage, average water saturation in target area is always between 50-55%.
Relatively stable period after 2007: During this period, the change trend of reservoir parameters is not obvious. At this time, the average water saturation in the area is more than 55%.
II.
THE INFLUENCE FACTORS OF RESERVOIR PARAMETERS CHANGE IN
DIFFERENT PERIODS
It is considered that the change of reservoir parameters is mainly due to the migration of fine particles
in the reservoir such as matrix and clay minerals, the change of the supporting mode among the particles and the distribution of pore throat size and so on. And these changes belongs to micro characteristic, they are mainly affected by the macro factors: Physical property of sand body, water injection time and well density.
(1) The effect of sand body physical property
As shown in Figure 2, the change of porosity, permeability of type I sand body is the greatest and the
different hydrodynamic conditions in different depositional environment; there are greater particle size, thickness and better physical property in the sand bodies formed under high energy strong hydrodynamic environment. Conversely, there are smaller particle size, thickness and worse physical property in the sand bodies formed under low energy hydrodynamic environment.
Table 2 Main properties of different sand bodies
Sand body type Particle size(mm) diameter(Average pore
μm)
Porosity (%)
Permeability (×10-3μm2)
Type I 0.16 11.52 30.05 1189.76
Type II 0.12 7.77 28.41 633.32
Type III 0.07 5.16 26.39 223.18
The differences of physical properties of different sand bodies are mainly caused by the diameters of
the pore throat, In the process of water injection development, the fluid flow in the reservoir pore throats follow
Poiseuille Law. Flow velocities (v) of single-phase liquid in capillary can be expressed as: 2 8 r p v L
In the formula: v: velocity, μm/s;r: pore diameter, μm;Δp: capillary pressure , Pa;μ:fluid viscosity, pa·s; L:
capillary length ,μm.
In the same pressure difference, the same channel length and the same fluid conditions, the flow rate(v) of fluid
mainly depends on the pore diameter(r). If there are two equal length channels, the diameters is R1 and R2 respectively, and r1>r2. The ratio of the flow rate in the two channels is:
2 1 1 2 2 v r v r
Then v1>v2, it showed that the faster the flow rate in the large pores. Due to water flooding front is actually composed of pores of different sizes, the velocity in large pore throat is much faster than in the little pore throat, Therefore, there are much more current quantity in large pore throat than in the little pore throat, the scouring action in large pore throat is more stronger. At the same time, fine particles of sand bodies can be flow out of reservoirs more easily along large pore throat, which leads to the increasing of porosity and permeability. Therefore, the greater the grain size, the greater the porosity and permeability, the stronger the effect of water injection on the porosity and permeability.
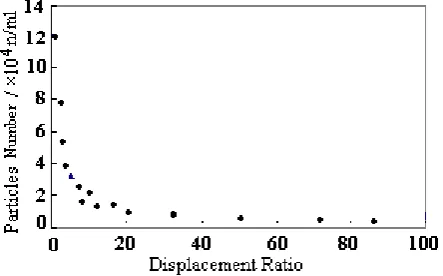
Figure 3 the scatter plot of particle number in displacement liquid and injection multiples
(2) The effect of water injection time
From Figure 2, with the increase of water injection time, the value of porosity and permeability increased gradually. But the change range is different in different period.
When oilfield is in the basic well pattern period, Underground seepage network were forming. During this stage, the injection water has not full of all pore throat networks, injection water is mainly used for filling new injection pore throat networks. Thus, the porosity and permeability value remain relatively constant, that is porosity and permeability platform period.
velocity of the fluid is more faster, the particles in the pores are migrated easily, the rise of porosity and permeability is more higher.
Through water flooding scouring experiment with cores, the particles number is observed using Laser particle counter, The experimental results were shown in Figure 3, with the increase of injection time, the number of migrated particles present a first more and then few change trend, therefore with water flooding time increased, the rise of porosity and permeability are also showed a trend of first fast and then slow change trend.
(3) The influence of the well density
From Figure 2, there is good relevance between porosity, permeability and well density. The larger the well spacing density, the more the porosity and permeability increase.
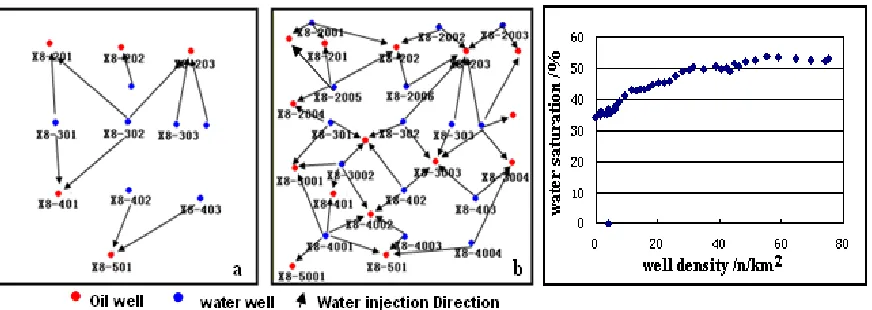
It is mainly due to the increase of the number of the effective directions of single well, and the increase of the scope of water injection. As shown in Figure 4, without considering the type of sand body connectivity, the number of the effective direction of single well is 2 in the original well pattern(Fig.4-a), while the number of the average effective direction of single well is up to 2.5 after well pattern infilling(Fig.4-b). The fact shows that: the number of water channels is increased, swept volume of water injection is expand, the scope of water transformation is increased, so more particles migrated out of the underground, that leads to porosity and permeability of reservoirs increase intensified.
However, the increase of porosity and permeability will not last with the increase of well density, but there is a limitation. The statistics of the relationship between well density and water saturation, the result can be shown in Figure 5, with the increase of well density, water saturation increases, when the well density reach 50-60 well /
km2, Water saturation is no longer increased. The well spacing is about 200-250m. Even if the density of well
pattern is increased, the porosity and permeability will not increase obviously.
III.
CONCLUSION
In this paper, the variation of reservoir parameters after water flooding is analyzed by means of logging interpretation and core analyzing. The following results are obtained:
(1)The porosity and permeability increased with the increasing of development time.
(2)The change of porosity, permeability is not uniform. It can be divided into four stages, which are the platform period, the fast rising period, the slow rising period and the relatively stable period. The phenomenon is mainly related to the formation process of the underground seepage network.
(3) the change of property and permeability is mainly affected by the sand body properties, the length of water injection time and well density.The better the original physical property of the reservoir, the longer the injection time and the greater the density of well network, then variation of porosity and permeability is larger. When the
well spacing densities reach 50-60 well/km2 and average water saturation is about 55 percent. Underground
seepage network is relatively fixed, the porosity and permeability will not increase obviously. Fig. 4 Schematic diagram of the single well effect
direction in the condition of different well density
Fig. 5 the scatter plot of well density
REFERENCE
[1] Song Wanchao, Sun Huanquan, Sun Guo, et a.l. Dynamical geologic process of development liquid—taking Shengtuo Oilfield as an example[J]. Acta Petrolei Sinica, 2003, 23(3): 52-55.
[2] LI Cungui, Xu Shouyu. Law of pore structure verity in reservoir during a long episode water flooded development [J]. Petroleum Exploration and Development, 2003, 30(2):94-96.
[3] Zhang Hongxing, Liu Qingnan, Li Fengqin. Variations of Petro physical parameters after sandstone reservoirs watered out in Daqing Oil Field [J]. SPE: 30884, 1995
[4] P.Behrenbruch, H.M.Goda. Two-Phase Relative Permeability Prediction: A Comparison of the Modified Brooks-Corey Methodology with a New Carman-Kozeny Based Flow Formulation [J]. SPE: 101150, 2006