RESEARCH ARTICLE
VALIDITY AND RELIABILITY OF ARABIC VERSION OF LOW BACK PAIN RATING SCALE IN
PATIENT WITH LOW BACK PAIN
1,*
Ragwa Tawfeq,
2Wadida H. Elsayed PhD and
3Olfat Ibrahim PhD
1
Physical Therapist in outpatient clinic of Physical Therapy, 28th health center, 10th of Ramadan City, Egypt
2
Profeesor of Physical Therapy, Basic Science Department, Faculty of Physical Therapy, Cairo University, Egypt
3
Lecturer of Physical Therapy, Basic Science Department, Faculty of Physical Therapy, Cairo University, Egypt
ARTICLE INFO ABSTRACT
Study Design: Translation and validity and reliability testing. Objective: To adapt the low back pain rating scale (LBPRS) cross-culturally to Arabic language, investigate the validity, reliability and feasibility of the Arabic version of LBPRS in an Arabic-speaking sample with low back pain.
Method: The English version of the LBPRS which had 3 components (back and leg pain, disability index and physical impairement) was translated into Arabic (LBPRS-Ar) and back-translated according to established guidelines. An expert committee reviewed all reports and agreed by consensus to a prefinal version of the Arabic LBPRS. This team was of 10 experts. Sixty-five patients with low back pain completed the LBPRS-Ar after two days, to assess its test-retest reliability. Further psychometric testing was done by assessing internal consistency, face validity, content validity and feasibility to asses it. Missed data index was used to count missed data in relation to total data. Results: The study showed The scale items were filled by patients and it needed three minutes or less to be answered in about 75% of all sheets, Cronbach ’s alpha equals 0.875 (good) and the spearman’s rank correlation coefficient between test and retest results were statistically significant.
Conclusion: The Arabic version of the LBPRS has a 3-factors and is a valid, reliable, and feasible tool that can be used to assess back pain in Arabic-speaking patients with low back pain. Therefore. It can be recommended for clinical and research purposes.
INTRODUCTION
Low back pain (LBP) is a very common health problem worldwide and a major cause of disability affecting performance at work and general well-being. LBP can be acute, sub-acute, or chronic. Though several risk factors have been identified (including occupational posture, depressive moods, obesity, body height and age). The causes of the onset of low back pain remain obscure and diagnosis difficult to make. Back pain is not a disease but a constellation of symptoms. In most cases, the origins remain unknown (Atlas and Deyo, 2001). Low back pain prevents normal activity and affects the capacity to work. For society, it means lost work days; for the individual, it means both lower income and a reduced quality of life as a result of pain and immobility (Burström et al, 2003). Since low back pain is common and difficult to treat effectively, it is a condition that leads to long-term absence and, consequently, a high economic burden to society.(Maetzel and Li,2002).Several studies have been performed in Europe to evaluate the social and economic impact of LBP. In the United Kingdom, LBP was identified as the most common cause of disability in young adults, with more than100 million work days lost per year (Croft et al., 1993).
*Corresponding author: Ragwa Tawfeq,
Physical Therapist in outpatient clinic of Physical Therapy, 28th health center, 10th of Ramadan City, Egypt.
A physiotherapy outcome measure is a test or scale administered and interpreted by physiotherapists that has been shown to accurately measure a particular attribute of interest to patients and therapists, and is expected to be influenced by intervention(Cole ,1994; Rene man et al, 2002).Important properties of an outcome measure include the validity, practicality, precision, reliability, responsiveness and the ability to detect change in a specific condition (Lurie, 2000). There has been an increase in the recognition of the importance of outcome measures amongst physiotherapists over the last decade(Bayar et al, 2003). The low back pain rating scale (LBPRS) is a rating questionnair designed to evaluate the clinical outcome of LBP patients. This tool includes three different components: pain, disability and physical impairment (Manniche et al,1994). The three different components are weighted: 60 points for pain scoring, 30 points for disability and 40 points for physical impairment. Therefore, combining them, the final LBPRS score ranges from 0 (in patient without back problems) to 130 (in disabled patient). The questionnaire can be filled out in about 15 min and scored in about 3–5 min. The scale is available in Danish and English (Manniche et al., 1994). Turkish (Filiz et al., 2005), German (Nuhr et al, 2004) and Polish (Radziszewski, 2008). The scale has been validated in Danish (Manniche et al,1994)and culturally adapted into German (Nuhr et al, 2004). Any questionnaire was translated needs to be valid and reliable with the translated language even if it was valid and reliable with its original language.
Article History:
Received 20th may, 2019 Received in revised form 10th June, 2019 Accepted 24th July, 2019 Published online 31st August, 2019
International Journal of Recent Advances in Multidisciplinary Research
Vol. 06, Issue 08, pp.5123-5128, August, 2019
Keywords:
Natural Physical Fertility, Rainfed Rice, Ferralsol Hyperdystric,
As an Arabic version has not been developed with full cross-culture adaptation. We chose to translate the LBPR questionnaires into Arabic, as it is less costly and time consuming than generating a new measure, and to investigate its validity and reliability. The purposes of this study were to translate, and cross culturally adapt the LBPRS to Arabic language and to investigate the validity, reliability and feasibilty of the Arabic version of LBPRS in Arabic-speaking patients with LBP complaints. Also our goal was to have a tool in Arabic that would facilitate international research in musculoskeletal disorders as well as to serve health practitioners in their everyday clinical practice. The LBPRS questionnaire has been translated properly, validated and culturally adapted, to be used in different language and social environments.This offers a standard measure for use in international studies and clinical practice and allows clinicians and researchers to share information and direct comparison across countries.
MATERIALS AND METHODS
This study was conducted on outpatient clinic of physical therapy in 28th health center in 10th of Ramadan City, Egypt to investigate the validity, reliability and feasibility of Arabic version of the LBPRS in patients with low back pain. This study followed guidlines that recommended for translating, adapting and validating psychological instruments (Borsa et al., 2012; Sousa and Rojjanasrirat, 2011). The study was approved by the ethical commeti of the Faculty of Physical Therapy Cairo University Egypt.
Experts: One expert panel; consists of ten experts, Experience not less than ten years or at least master degree and fluent in English and Arabic) participated in this study.
Patients: Sixty-five patients with low back pain; referred by physician, able to read and write (not illiterate), didn’t have deformity, and no medications were administered, and each participant signed consent form. Patients fill the data collection sheet which was used to collect demographic data (name, age, sex, weight, height, and LBPRS).
Translators: Two Translators for translating from English to Arabic (forward translation)
• One translator must be knowledgeable about health terminology and the content area of the construct of the instrument in Arabic.
• The other translator must be knowledgeable about the cultural and linguistic nuances of the Arabic
Two Translators for translating fram Arabic to English (backward translation)
• One translator must be knowledgeable about health terminology and the content area of the construct of the instrument in the English.
• The other translator must be knowledgeable about the cultural and linguistic nuances of the English.
Procedures
Translation and Cross-cultural Adaptation: The translation and cross-cultural adaptation of the LBPRS
were based on the guidelines established by (Borsa et al.,
2012; Sousa and Rojjanasrirat, 2011).
Forward translation: Translation of the original score into Arabic (forward translation or one-way translation):
• Scale in English was translated to Arabic (A1 and A2) two forward-translated versions of the scale was produced.
• Use two bilingual and bicultural (preferred) translators whose mother language is Arabic, but who have distinct backgrounds:
• One translator must be knowledgeable about health terminology and the content area of the construct of the instrument in the Arabic.
• The other translator must be knowledgeable about the cultural and linguistic nuances of the Arabic
Comparison of the two translated versions of the score (A1 and A2):
All of the research teamcompared the A1 and A2, and compared both the A1 and A2 with the English version of the scale.
A committee approach (third independent individual or translator, translators who participated in Step 1, and investigator and/or other members of research team) was used to resolve ambiguities and discrepancies and derive the preliminary initial translated Arabic version (PI-A).
Blind back-translation (blind backward translation or blind double translation) of the preliminary initial translated version of the scale:
The PI-A → Back-translated to English (TL1 and B-TL2)
two back-translated versions was produced.
two bilingual and bicultural translators was usad, but who have distinct backgrounds:
One translator must be knowledgeable about health terminology and the content area of the construct of the instrument in the English.
The other translator must be knowledgeable about the cultural and linguistic nuances of the English.
Comparison of the two back-translated versions of the scale (B-TL1 and B-TL2) synthesis II:
Comparison between the two back-translations (B-TL1 and B-TL2) of the scale, and between both B-TL1 and B-TL2 and the original English scale:
Evaluate similarity of the instructions, items and response format regarding wording, sentence structure, meaning and relevance.
Pilot testing of the pre-final version of the instrument in the target language with a monolingual sample: cognitive debriefing
It is highly recommended to use an expert panel which consist of the( 10 experts) to further examine the instrument for:
Clarity of the instructions, items and response format (face validity) and to provide suggestions to improve its clarity using dichotomous question (clear-unclear).
Content equivalence (content-related validity)
relevant; 2 = unable to assess relevance; 3 = relevant but needs minor alteration; 4 = very relevant and succinct.
According to the suggestions of the experts the following changes had been made to improve the clarity of the index to the minimum acceptable value so that it can be given to the patients:
After the modified pre –final version passed face and content validity tests, it is called final version.
Feasibility (ability to use on larger sample) was evaluated by the assessment of the frequency of missing answers per item and administration time.
Patients with low back pain completed the sheet again after two days.
Data analysis: Statistical analysis was conducted using SPSS for Windows, version 23 (SPSS, Inc., Chicago, IL). Alpha level set at 0.05.
Descriptive statistics of patients and sheets were made using mean, standard deviation (SD), minimum (min) and maximum (max).
Face validity was investigated by clarity index and expert proportion of clearance.
Content validity was investigated by index of content validity (CVI).
Feasibility index was calculated using missed item index and time taken to fill the questionnaire.
Internal consistency reliability was measured using Cronbach’s coefficient alpha. Retestreliability was measured using mean scores and Spearman’s rank Correlation coefficient
Testing the validity and reliability: To explore the validity and reliability of the LBPRS-Ar, the questionnaire was administered to 65 patients with low back pain. Eligibility Criteria for patients were: age more than 18 years, a written consent of the patient, and low back pain lasting more than 3 months. Patients were excluded if they had severe lumbar radiculopathy, low back pain related to vertebral fracture, back surgery, cognitive impairment, infectious disease, neurological deficits, cancer, or other systemic diseases with possible effect on the musculoskeletal system.
Floor/Ceiling Effects: Floor/ceiling effects were considered to be present if more than 15% of respondents achieved the lowest or highest possibletotal score (Agarwal et al., 2006).
Internal Consistency and Test-Retest Reliability: The internal consistency is considered to be good if the value of the Cronbach α is more than 0.70. Test-retest reliability was tested using intra class-correlation (ICC) with good and excellent reliability being, respectively, indicated by values of 0.60 to 0.80 and more than 0.80. (Shrout et al., 1979) The sample size was estimated based on a method developed to calculate the required number of subjects in a reliability study (Trouli et al., 2008; Walter et al.,1998).
RESULTS
Participants: Seventy patients with low back pain complaints visited the Health Center. Five patients did not meet the eligibility criteria and were excluded from the study. All eligible subjects agreed to participate in the study and returned to complete the questionnaires for a second time after 2 days (100% response rate).
Descriptive statistics for missing items, and the scale items were filled out by 100 % in all sheets, because each subject fill the scale in an interview with the researcher so that the researchermade sure that all items were filled out. The general impression of the patients about the questionnaire and the instructions were easy to understand and that the items were important to their situation.
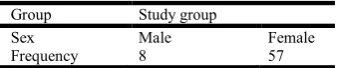
Descriptive Analysis of subjects’ general characteristics: As shown in table (1) Study group consisted of 65 Patients 8 Male and 57 Female table (2), there mean age value was (44.28 ± 15.46) years ranged from 21 to 70 years. Also, as shown in table 1 the mean height of subjects is (170.14 ± 8.94) and mean weight of (86.03 ± 16.81) while subjects’ mean BMI is (29.72 ± 18.61).
BMI: Body Mass Index
Floor/Ceiling Effects: The LBPRS-Ar had no floor/ ceiling effects as no one of patients achieved the minimum(0 patient, 0%) or maximum
(0 patients, 0%) possible scores.
Experts Results
Face validity analysis: Face validity is defined as the degree to which test respondents view the content of a test.
Descriptive Analysis of the experts’ general characteristics: To investigate the face validity of the new Arabic version of LBPRS, three expert Physiotherapists were chosen from Faculty of Physical Therapy, Cairo University Hospital with mean experience of (16.2 ± 6.85 years) with minimum of 8 years and maximum of 32years of experience (Table 3). As shown in table (4), two of them is a PhD holders and one of them is a bachelor degree holder.
N: number, SD: standered deviation
Index of clarity for the Arabic version of LBPRS: According to the experts' opinions, and after application of expert’s suggested modifications, the index of clarity of all items (Table 5), after modification was 100%, so the clearly of the Arabic version of LBPRS was perfect according to experts' opinions, with index of clarity universal agreement = 100 %.
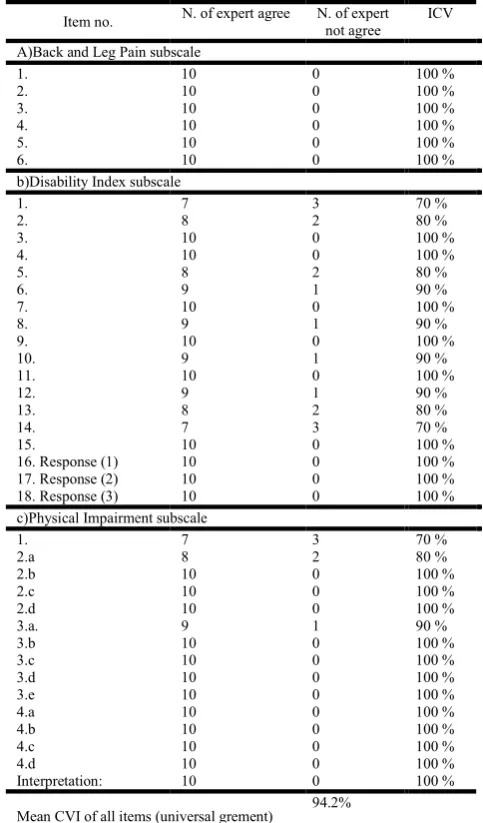
Content validity analysis: As shown in Table (4) and, according to the experts' opinions, 26 items(representing 100%) were relevant with Index of Content Validity (ICV)= 100% ,3 items(representing 70%)had ICV of 100%,4 items (representing 80 %)had ICV of 100% and 5 items (representing 90%)had ICV of 100% . Also, the mean CVI of all items was ICV = 94.2%, So the content validity of the Arabic version of patient and observer scar assessment was perfect according to experts' opinions.
Reliability of LBPRS Arabic version
Internal consistency (correlation of items in the questioner): As shown in table (7) the internal consistency was measured by Cronbach’s alpha. Results revealed that the internal consistency of LBPRS was good with Cronbach’s
Table (1): Sex distribution in the study group
Group Study group
Sex Male Female
Table 2. Patients general chractristics Minimum, Maximum, Mean and stander deviation
Mean Stander Deviation Minimum Maximum
Age 44.28 15.46 21 70
Weight 86.03 16.81 50 131
Height 170.14 8.94 155 189
BMI 29.72 5.54 18.61 41.40
Table 3. Experts mean and stander deviation of experience years
Experts Experience (years)
N 10
Mean 16.2
±S D 6.85
Minimum 8
Maximum 32
N: number, SD: standered deviation
Table 4. Experts specialty and scientific degree
Degree held Total
Master PhD
Frequancy 3 7 10
Percentage 30% 70% 100 %
Table 5. Arabic LBPRS Final version index of clarityaccording to experts’opinions
Item no. N. of expert
agree
N. of expert not agree
Item index of clarity A)Back and Leg Pain subscale
1. 10 0 100 %
2. 10 0 100 %
3. 10 0 100 %
4. 10 0 100 %
5. 10 0 100 %
6. 10 0 100 %
b)Disability Index subscale
1. 10 0 100 %
2. 10 0 100 %
3. 10 0 100%
4. 10 0 100 %
5. 10 0 100 %
6. 10 0 100%
7. 10 0 100 %
8. 10 0 100 %
9. 10 0 100 %
10. 10 0 100 %
11. 10 0 100 %
12. 10 0 100 %
13. 10 0 100 %
14. 10 0 100 %
15. 10 0 100 %
16. Response (1) 10 0 100 %
17. Response (2) 10 0 100 %
18. Response (3) 10 0 100 %
c)Physical Impairment subscale
1. 10 0 100 %
2.a 10 0 100 %
2.b 10 0 100 %
2.c 10 0 100 %
2.d 10 0 100 %
3.a. 10 0 100 %
3.b 10 0 100 %
3.c 10 0 100 %
3.d 10 0 100 %
3.e 10 0 100 %
4.a 10 0 100 %
4.b 10 0 100 %
4.c 10 0 100 %
4.d 10 0 100 %
Interpretation: 10 0 100 %
Mean index of clarity for all items (universal agrement)
100%
Table 6. Experts’ opinions according to ICV of the Arabic LBPRS
Item no. N. of expert agree N. of expert
not agree
ICV
A)Back and Leg Pain subscale
1. 10 0 100 %
2. 10 0 100 %
3. 10 0 100 %
4. 10 0 100 %
5. 10 0 100 %
6. 10 0 100 %
b)Disability Index subscale
1. 7 3 70 %
2. 8 2 80 %
3. 10 0 100 %
4. 10 0 100 %
5. 8 2 80 %
6. 9 1 90 %
7. 10 0 100 %
8. 9 1 90 %
9. 10 0 100 %
10. 9 1 90 %
11. 10 0 100 %
12. 9 1 90 %
13. 8 2 80 %
14. 7 3 70 %
15. 10 0 100 %
16.Response (1) 10 0 100 %
17.Response (2) 10 0 100 %
18.Response (3) 10 0 100 %
c)Physical Impairment subscale
1. 7 3 70 %
2.a 8 2 80 %
2.b 10 0 100 %
2.c 10 0 100 %
2.d 10 0 100 %
3.a. 9 1 90 %
3.b 10 0 100 %
3.c 10 0 100 %
3.d 10 0 100 %
3.e 10 0 100 %
4.a 10 0 100 %
4.b 10 0 100 %
4.c 10 0 100 %
4.d 10 0 100 %
Interpretation: 10 0 100 %
Mean CVI of all items (universal grement)
94.2%
Table 7. Internal consistency of the Arabic version of LBPRS by Cronbach's Alpha
Item Cronbach's Alpha
if Item Deleted
Cronbach's Alpha of scale as Total
back and leg pain 0.768 0.875
disability index 0.813
physical impairment
0.833
Table 8. Descriptive statistics of Arabic version of LBPRS in the first and second occasion
1st occasion (n=65) 2nd occasion (n=45)
Item Mean ±SD Mean ±SD
Back and leg pain 35.97 5.00 35.82 4.93
Disability index 17.69 4.36 17.40 4.37
Physical impairment 27.38 8.28 27.46 8.21
LBPRS total score 81.05 16.20 70.62 12.54
Table 9. Interclass Correlation Coefficient for Test re-test reliability of Arabic version of LBPRS
Item R value Correlation
strength P-value
Back and leg pain 0.989 Very strong P-< 0.0001
Disability index 0.984 Very strong P-< 0.0001
Physical impairment 0.995 Very strong P-< 0.0001
LBPRS total score 0.804 Strong P-< 0.0001
Table 10. Missed data index in 130 sheets
Item no. Missed data (not answered)
N. %
a)Back and Leg Pain subscale
7. 0 0%
8. 0 0%
9. 0 0%
10. 0 0%
11. 0 0%
12. 0 0%
b)Disability Index subscale
19. 0 0%
20. 0 0%
21. 0 0%
22. 0 0%
23. 0 0%
24. 0 0%
25. 0 0%
26. 0 0%
27. 0 0%
28. 0 0%
29. 0 0%
30. 0 0%
31. 0 0%
32. 0 0%
33. 0 0%
34. Response (1) 0 0%
35. Response (2) 0 0%
36. Response (3) 0 0%
c)Physical Impairment subscale
2. 0 0%
2.a 0 0%
2.b 0 0%
2.c 0 0%
2.d 0 0%
3.a. 0 0%
3.b 0 0%
3.c 0 0%
3.d 0 0%
3.e 0 0%
4.a 0 0%
4.b 0 0%
4.c 0 0%
4.d 0 0%
Interpretation: 0 0%
Total Missed Data Percentage 0.000%
Table 11. Correlation between weight and height and subcategories of the Arabic version of the LBPRS
Pearson’s correlation coefficient
Weight Hight Age
R
P-value
R
P-value
R
P-value Back and leg pain 0.729 <0.001 0.209 0.094 0.659 <0.001 Disability index 0.600 <0.001 0.032 0.798 0.532 <0.001 Physical impairment 0.632 <0.001 0.083 0.512 0.584 <0.001 LBPRS total score 0.709 <0.001 0.116 0.359 0.645 <0.001
alpha = 0.875. Table(7) showed Cronbach’s alpha if the item removed with no significant difference from the total scale Cronbach’s alpha which confirm a very good internal consistency of the Arabic version of LBPRS.
Reliability of LBPRS Arabic version
Internal consistency (correlation of items in the questioner): As shown in table (7) the internal consistency was measured by Cronbach’s alpha. Results revealed that the internal consistency of LBPRS was good with Cronbach’s alpha = 0.875. Table(7) showed Cronbach’s alpha if the item removed with no significant difference from the total scale Cronbach’s alpha which confirm a very good internal consistency of the Arabic version of LBPRS.
Test retest reliability analysis: To test the reliability of the Arabic version of LBPRS, patients were asked to re-fill the questionnaire another time after 2 days (2nd occasion). All 65 subjects complete the Arabic version of LBPRS. As shown in Table (8) the mean ± SD value of back and leg pain section was (35.97±5) for the first occasion and (35.82±4.93) for the second occasion for the same patients after 2 days with Interclass Correlation Coefficient (in average) 0.978 and P-value < 0.0001 Table (9). Regarding the results of disability index section, the mean ± SD is (17.69±4.36) for the first occasion and (17.4±4.37) for the second occasion for the same patients after 2 days with Interclass Correlation Coefficient (in average) 0.984 and P-value < 0.0001Table (9). Considering the results of physical impairment section, the mean ± SD is (27.38±8.28) for the first occasion and (27.46±8.21) for the second occasion for the same patients after 2 days with Interclass Correlation Coefficient (in average) 0.995 and P-value < 0.0001 Table (9). Farther more Table 11, showed that mean ± SD is (81.05±16.20) for the first occasion and (70.62±12.54) for the second occasion for the same patient after 2 days with strong Interclass Correlation Coefficient (in average) 0.804 and P-value < 0.0001 Table (9).
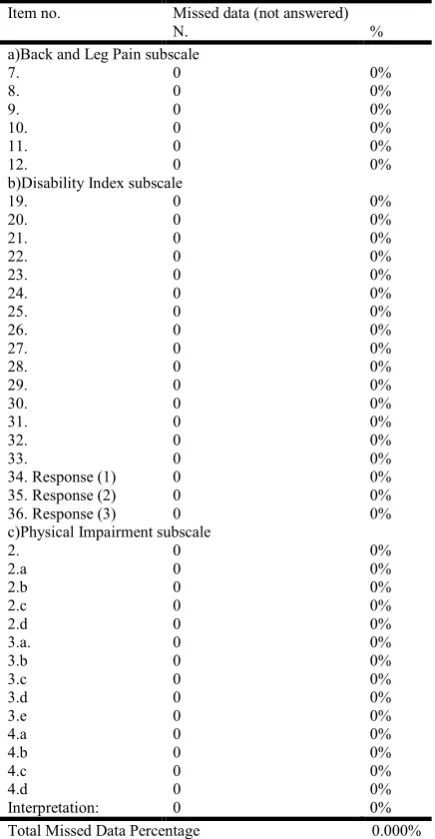
Feasibility measures: The feasibility measures were carried out on data from all sheets of the 1st occasion (65 sheets) and the second occasion (65 sheets) (retest sheets are enrolled in data) with total number of 130 sheets.
Missed item index: To assess the feasibility; sheets with missed data (items not answered by the patient) was counted for each item. Missed data index represent not answered data in relation to the total data as shown in table(10)The scale items were filled out by 100 % in all sheets, because each subject fill the scale in an interview with the researcher so that the researcher made sure that all items are filled out.
Other psychometric measures: As shown in Table (11), there was moderate positive correlation between Weight, and Back and leg pain, Disability index, Physical impairment and LBPRS total score (R-value = 0.729, 0.600, 0.632 and 0.709 respectively). Also, Age showed moderate positive correlation with Back and leg pain, Disability index, Physical impairment and LBPRS total score (R-value = 0.659, 0.532, 0.584 and 0.645 respectively). On the other hand, there was non-significant correlation between Height and Back and leg pain, Disability index, Physical impairment and LBPRS total score with R-values = 0.209, 0.032, 0.083 and 0.116 respectively).
DISCUSSION
statedthat Missing rate on the item level was considered acceptable if no single item had a missing rate exceeding 10% and completion time was considered acceptable if 95% of sheets were completed in less than 15 minutes. The Arabic version of LBPRS has good internal consistency and good test retest reliability as Cronbach’s alpha = 0.875 (0.789, 0.768) So, according to (George and Mallery, 2003)between 0.7 and 0.9 is referred as good internal consistency. The patients were asked to re-fill out LBPRS two days later. Feasibility was assessed by calculating the percentage of missing items and the floor and ceiling effects. Test-retest was evaluated using ICCs. Sixty-five patients with LBP were included. The LBPRS was obtained from all patients as there were no missing items. Neither a floor nor a ceiling effect was observed. the mean ± SD value of back and leg pain section was (35.97 ± 5) for the first occasion and (35.82 ± 4.93) for the second occasion for the same patient after 2 days with Interclass Correlation Coefficient (in average) 0.978 and P-value < 0.0001. Regarding the results of disability index section, the mean ± SD is (17.69 ± 4.36) for the first occasion and (17.4 ± 4.37) for the second occasion for the same patient after 2 days with Interclass Correlation Coefficient (in average) 0.984 and P-value < 0.0001. Considering the results of physical impairment section, the mean ± SD is (27.38 ± 8.28) for the first occasion and (27.46 ± 8.21) for the second occasion for the same patient after 2 days with Interclass Correlation Coefficient (in average) 0.995 and P-value < 0.0001. Farther more the mean ± SD is (81.05 ± 16.20) for the first occasion and (70.62 ± 12.54) for the second occasion for the same patient after 2 days with strong Interclass Correlation Coefficient (in average) 0.804 and P-value < 0.0001. These results come in agreement with similar results obtained by (Manniche et al., 1994) which stated thatThe scale presents a high interrater reliability (97.7%) was found without level difference between two observers using the scale.
Study Limitations: There are some limitations to consider in this study. Expert time availability, some translated words cannot be understood, Further studies should be conducted to establish the preliminary psychometrics of the Arabic-language version of LBPRS with bilingual participants, Further studies should be conducted to establish the full psychometric properties (construct and criterion validity) of Arabic-language version L0BPRS in a sample of the target population of interest, Further studies should be conducted to translate, adapt and validate other assessment instruments for LBP.
Conclusion
The results obtained from the current study and discussion follower it can lead to concluding that translated Arabic-language version LBPRS has face and content validity, feasibility and internal consistency and test retest reliability enough to measure the physical function in low back pain patients.
REFERENCES
AgarwalS, Allison GT., Agarwal A. et al., 2006. Reliability and validity of the Hindi version of the Neck Pain and Disability Scale in cervical radiculopathy patients. DisabilRehabil 28: 1405 – 11.
Atlas SJ, Deyo RA. 2001. ‘Evaluation and Managing Acute Low Back Pain in the Primary Care Setting’, J Gen Intern Med. vol. 16, pp. 120-131.
Bayar K., Bayar B., Yakut E., Yakut Y. 2003. ‘Reliability and construct validity of theOswestry Low Pack Pain Disability Questionnaire in the elderly with low pack pain’, The Pain Clinic, vol. 15, no. 1, pp 55-59.
Borsa, J., Damásio, B. and Bandeira, D. 2012. Cross-cultural adaptation and validation of psychological instruments: Some considerations. Paidéia (RibeirãoPreto), 22(53):423-432.
Burström K., Johannesson M., Diderichsen F. 2003.The value of the change in health in Sweden 1980/81 to 1996/97. Health Econ 12: 637-54.
Cole L., Houston S. 1999. ‘Linking outcomes management and practice improvement. Structured care methodologies: evolution and use in patient care delivery’, Outcomes
Manag Nurs Pract. vol. 3, no. 2, pp. 53-59.
Croft P et al: The prevalence and characteristics of chronic widespread pain in the general population. Journal of Rheumatology. (1993); 20:710-3.
Filiz M., Cakmak A., Ozcan E. 2005. The effectiveness of exercise programmes after lumbar disc surgery: a randomized controlled study. ClinRehabil. 19:4–11. George D. and Mallery P. 2003. SPSS for Windows step by
step: A simple guide and reference, 11.0 update,4th edition. Boston: Allyn and Bacon.
Lurie J. 2000. ‘A Review of Generic Health Status Measures in Patients with Low Back Pain’, Spine. vol. 25, no. 24, pp. 3125-3129.
Maetzel A., Li L. 2002. The economic burden of low back pain: are view of studies published between 1996 and 2001.
Best Pract Res ClinRheumatol., 16: 23-30.
Manniche C., Asmussen K., Lauritsen B. et al. 1994. Low back pain rating scale: validation of a tool for assessment of low back pain. Pain., 57:317-326.
Nuhr MJ., Crevenna R., Quittan M., Auterith A., Wiesinger GF. Brockow T. et al. 2004. Cross-cultural adaption of the Manniche questionnaire for German-speaking low back pain patients. J Rehabil Med., 36:267– 72.
Radziszewski KR. 2008. The functional status in patients with disco pathy of the lumbar spine receiving only conservative therapy or operative therapy. WiadLek 61:23–9. In Polish. Shrout PE., Fleiss JL. 1979. Intraclass correlations: Uses in
assessing raterreliability. Psychol Bull., 86: 420 – 8. Sousa, V. and Rojjanasrirat, W. 2011. Translation, adaptation
and validation of instruments or scales for use in cross-cultural health care research: a clear and user-friendly guideline. J EvalClinPract, 17(2):268-74.
Trouli MN., Vernon HT., Kakavelakis KN. et al., 2008. Translation of theneck disability index and validation of the Greek version in a sample of neck pain patients. BMC Musculoskelet Disord., 9: 106 – 13.
Walter SD., Eliasziw M., Donner A. 1998. Sample size and optimal designs for reliability studies. Stat Med., 17: 101 – 10.