ISSN (Online): 2320-9364, ISSN (Print): 2320-9356 www.ijres.org Volume 5 Issue 6 ǁ June. 2017 ǁ PP. 54-60
A Multistage Variation Analysis Model Based on Compliant Sheet
Metal Assembly
Zhenghao Chen
1, Yanfeng Xing
1*, Xuexing Li
21Automotive Engineering College, Shanghai University Of Engineering Science, Shanghai, China 2Key Laboratory Of Specialty Fiber Optics And Optical Access Networks, Shanghai University, Shanghai, China
ABSTRACT:
Compliant materials have been widely used due to the lightweight of vehicle body. However, the lack of methodologies of assembly variation has imposed a significant obstacle on dimensional control. This paper proposed a new assembly variation model to predict assembly deviation for compliant parts in a multi-stage assembly process concerning the relocation deviation propagation. 3-D variation model based on Euler transformation, displacement response method and force response method based on Method of Influence Coefficients are adopted to deduce the assembly variation model. The validity of the proposed model is verified by FEA method. A case of compliant sheet metal two-stage assembly is supplied to reveal the assembly variation during multistage assembly process through both experiment and simulation, and the conformity of the results suggest that the new model has more credibility than the traditional model without concerning variation caused by relocation during assembly process.Keywords:
Compliant, Multistage, Assembly process, Relocation, variation propagationI.
INTRODUCTION
In the past decade, compliant materials have been widely used in aircraft, automotive, marine, etc., due to the lightweight of vehicle body manufacturing. Due to the limitation of manufacturing technology, dimensional errors of parts and fixtures may occur in assembly process. Thus, a dimensional variation will be introduced during each assembly stage, and further propagated to the next stage, and finally accumulated in the final product. Up to now, lots of researches have been done in the area of sheet metal assembly variation analyzing. Hu [1] proposed the Stream of Variation theory (SOV) for the first time. Agrawal et al. [2] proposed regression model depicting the stream of variation during multistage assembly process. Mantripragada et al. [3] described dimension transform during assembly process using states transition model. Jin [4] and Ding et al. [5] established parts and fixture variation models according to multistage assembly process. Camelio and Hu [6] proposed sheet metal deviation accumulation model based on mechanical deviation model. Dahlström [7] and Ungemach et al. [8] proposed an assembly variation analysis method concerning contact type. Liao et al. [9] proposed an assembly variation analysis model based on wavelet analysis for flexible sheet metal. Hsieh [10] introduce finite element method to define the variation change before and after assembly process. Xing et al. [11] analyzed different fixture configurations. For the moment, few researches have been synthetically considered all the variation factors during the assembly variation model. Therefore, this paper proposed a new multistage variation analysis model based on Euler's transformation variation model This model is made up of relocation variation propagation model and single-stage variation model. Finally, a multi-stage assembly case is conducted to verify the model given.
II.
MULTISATGE ASSEMBLY PROCESS ANALYSIS
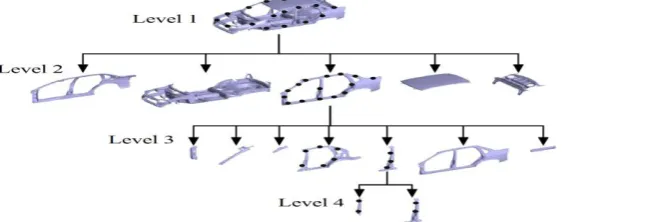
Welding assembly of Auto-body is a process that sheet metals are welded together step by step from subassembly to assembly (Figure 1). The body-frame assembly is formed through a certain assembly order from subassembly Level4 to frame assembly Level1.
III.
A MODEL OF VARIATION PROPAGATION CAUSED BY RELOCATION
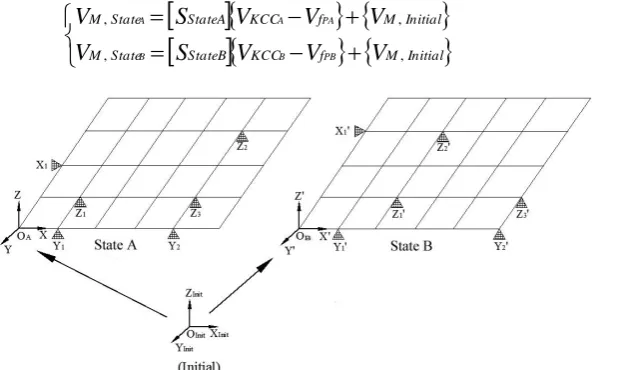
As shown in Figure 2, the locating mode has transformed from state A to state B. And the variations of sheet metal from both states are showed as follows, which is deduced on the basis of influence coefficient method and SOV theory proposed by Hu and Liu:
Initial M f KCC StateB State M Initial M f KCC StateA State MV
V
V
S
V
V
V
V
S
V
PB B B PA A A , , , , (1)Figure 2 Relocation variation diagram
In the expressions,
V
M,StateA andV
M,StateB represent part’s feature points variation of state A and state B.
S
StateA
and
S
StateB
represent part’s sensitive rigidity matrix of state A and state B which equals to
r
q
1 .Express
B
State M
V
, in terms of
A
State M
V
, from equation (1) to reveal the relationship among variables as shown in equation (2):
V
M,StateB
[
S
StateA,StateB]
V
KCC
V
fP
V
M,StateA
(2)Equation (2) can be viewed as the model of variation propagation caused by relocation. Variation propagates from state A to state B.
IV.
A MULTISTAGE VARIATION ANALYSIS MODEL BASED ON COMPLIANT SHEET
METAL ASSEMBLY
Multi-stage variation model proposed in this article consists of two models: Relocation variation propagation model and single-stage variation model.
4.1 Single-stage variation analysis model based on compliant sheet metal assembly Single-stage assembly consists of six steps:
Step1:“3-2-1”deterministic positioning;
Step2:“N-3”over-positioning which is used to decrease deformation of parts; Step3: Welding torch clamps the parts and starts welding;
Step4: Releasing the welding torch, this caused springback of parts for the first time; Step5: Releasing the“N-3”clamp, this caused springback of parts for the second time;
Step6: Releasing the“3-2-1”clamp, and the final deviation is formed. “3-2-1”Deterministic location constrains the parts translation and rotation. Variation caused by“3-2-1”locating process is represented by 3-D deviation model based on Euler transformation according to Cai et al. [12] as listed followed:
r
r
q
q
1 (3)
S
V
V
V
V
s
s
s
s
s
s
s
s
s
V
s
s
s
U
U
U
U
n n j nn n n n n j nj j j n
2 1 1 2 1 2 22 21 1 12 11 2 1 2 1 (4)Above all, the final assembly variation model of single-stage assembly can be deduced as followed:
V
M
S
MTX
V
WA
V
fWA
V
M*
(5)
V
W
S
A
V
A
V
fA
V
fA*
(6)
4.2 Multi-stage variation analysis model based on compliant sheet metal assembly
A Multi-stage variation analysis model can be deduced on the basis of single-stage variation analysis model and model of variation propagation caused by relocation. Assuming that the current assembling process is stage
k
, and then the input variation of stagek
1
can be inferred as below:
V
Mk
S
MTX,k
V
WA,StateB,kV
fWA,k
V
M,StateB,k
* 1
,
(7)In this equation,
*
1 , , , , , , ,,State k
State State k KCCk
f k
WAState k WA BP
S
A BV
V
PV
AV
;
*
1 , , , , , , ,,State k
State Stage k KCCk
f k
MState k M BP
S
A BV
V
PV
AV
1
4
,
3
,
2
,
1
n
k
;n
represents the total stages.P
represents relocation coefficient. WhenP
0
, there isno relocation at stage
k
; whenP
1
, there is a relocation at stagek
. When a new part is introduced into the welding step,P
0
.
WA* ,Stage,k1
A
V
,
M*,Stage,k1
AV
represent the initial variation of the part’s at measuring points and welding points.V.
ASSEMBLY VARIATION SIMULATION AND CASE STUDY
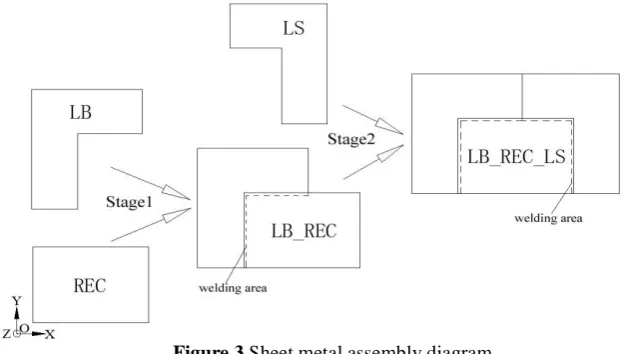
A case of multi-stage assembly based on compliant sheet metal is introduced to verify the model purposed in above sections. As Figure 3 shows, this case contains two stages: In stage1, L-shaped sheet LB and rectangular sheet REC were welded together into an assembly LB_REC. In stage2, assembly LB_REC and another L-shaped sheet LS were welded into the rectangular assembly LB_REC_LS.
Figure 3 Sheet metal assembly diagram 5.1 Initial conditions of the case
Figure 4 Dimension figure of sheet metal 5.2 3DCS_Analyst simulation
The simulation result is showed in Table 2 and Figure 5.
Table1 Initial module (mm)
Statistics Measure point Welding point Fixture
i j k
6Sigma 1 1 0.2 0.2 0.4
Mean 0 0 0 0 0
Table2 Simulation results (mm)
Statistics Assembly: LB+REC Assembly: LB_REC+LS
M1 M2 M3 M4 M5 M6 M7 M8 M9
Model 6Sigma 1.088 1.091 1.125 1.847 1.697 1.570 1.094 1.114 1.131 Mean -0.001 -0.0002 -0.006 -0.001 0.0003 -0.01 0.002 0.001 0.003 3DCS 6Sigma 1.09 1.09 1.13 1.72 1.59 1.52 1.09 1.11 1.13
Point M4, M5 and M6 in Figure 5 represent the relocation variation of measure points after sheet LB and sheet REC were welded and ready to move on to next stage. According to Figure 5, point M4, M5 and M6 show a good coherence in 6sigma. The mean difference of 6sigma value of point M4, M5, and M6 is 0.094mm. The range of theoretical model’s mean value is 0.009mm. That means the simulation result has a certain extent of effectiveness.
5.3 3dcs_Fea Simulation
Assume the initial module as showed in Table 3. The simulation result is showed in Table 4 and Figure 6.
Table3 Initial module (mm)
Statistics Measure point
Welding point
Over-locating point
Welding torch
Fixture
i j k
6Sigma 1 1 1 0.5 0.2 0.2 0.4
Mean 0 0 0 0 0 0 0
Table4 Simulation results (mm)
Measure point Model value 3DCS value
6sigma Mean 6sigma Mean
M1 2.942 0.015 2.23 0.01
M2 1.247 0.002 0.86 0.00
M3 2.520 -0.017 1.89 0.02
M4 7.216 0.056 7.51 0.03
M5 6.973 0.085 6.32 0.06
M6 6.987 0.054 6.55 -0.04
M7 6.761 -0.066 4.50 0.20
M8 1.656 0.005 3.44 0.12
M9 7.334 0.064 4.97 0.17
Figure6 3DCS_FEA simulation curve
Point M4, M5, M6, M7, M8, M9 in Figure 6 represent the variation of measure points on assembly LB_REC_LS after the whole assembling process was finished. According to Figure 6, all of the six points show a good coherence in 6sigma. The mean difference of 6sigma value is 1.298mm. The range of theoretical model’s mean value is 0.105mm. That means the simulation results accord with the model proposed.
5.3 physical experiments
Table5 Variation of two experiments (mm)
Measure point Model value 3DCS value
6sigma Mean 6sigma Mean
M1 2.942 0.015 2.23 0.01
M2 1.247 0.002 0.86 0.00
M3 2.520 -0.017 1.89 0.02
M4 7.216 0.056 7.51 0.03
M5 6.973 0.085 6.32 0.06
M6 6.987 0.054 6.55 -0.04
M7 6.761 -0.066 4.50 0.20
M8 1.656 0.005 3.44 0.12
M9 7.334 0.064 4.97 0.17
Figure7 Simulation curve of two experiments
Point M4, M5 and M6 in Figure 7 represents the relocation variation of measure point. These three points are used to verify the relocation variation model. Figure 7 shows the comparison curve for two sets of experiments. It can be concluded from the Figure8 that the trend of test A is obvious and the experiment’s result basically accord with the model’s result, while the trend of test B is less obvious. That means the part’s accuracy has a significant impact on assembly variation.
VI.
CONCLUSIONS
In order to enhance the accuracy of the variation analysis, this paper presents a new multistage variation analysis model based on compliant sheet metal assembly. Based on the experiment and simulation, conclusions and prospects are drawn as follows:
(1) Variation increased with the switch of stages. It is necessary to consider the relocation variation during multistage assembly. A model of variation propagation caused by relocation can optimize the current multistage assembly variation model and make it much more accurate and effective.
(2) Other factors that may influence the variation such as plastic deformation, thermal deformation are not taken into consideration in this article. Further study can be done based on the model proposed in this paper by introducing new factors of variation mentioned above.
(3) Further study can be done by introducing other location method and focus on the coupling of“3-2-1”location method and other location methods, which can enhance models’ accuracy on predicting and analyzing variation under different kind of working conditions.
ACKNOWLEDGEMENT
This work was financially supported by National Natural Science Foundation of China (51575335).
REFERENCES
[1]. Hu S J. Stream of Variation theory for automotive body assembly. Annals of the Cirp 1997; 46: l-6.
[3]. Mantrjpaagada R, Whiney D E. Modeling and controlling variation propagation in mechanical assemblies using state transition models. IEEE Transactions on Robotics and Automation 1999; 15(1): 124-140. [4]. Jin J, Shi J. State space modeling of sheet metal assembly for dimensional control. ASME Journal of
Manufacturing Science and Engineering 1999; 121: 756-762.
[5]. Ding Y, Ceglarek D, Shi J. Modeling and diagnosis of multistage manufacturing processes: Pan I-state space model. Japan/USA Symposium on Flexible Automation, Ann Arbor 2000; 7: 23-26.
[6]. Camelio J., Hu S. J. Modeling Variation Propagation of Multi-station Assembly Systems with Compliant Parts. Journal of Mechanical Design 2003; 12(12): 673-681.
[7]. Dahlstom. Variation Simulation of Sheet Metal Assemblies Using the Method of Influence Coefficients with Contact Modeling. Journal of Manufacturing Science and Engineering 2007; 129(3): 615-622. [8]. Ungemach G. Efficient Consideration of Contact in Compliant Assembly Variation Analysis. Journal of
Manufacturing Science and Engineering 2005; 131(1): 51-59.
[9]. Liao X. Y, Wang G. G. Wavelets-based Method for Variation Analysis of Non-rigid Assemblies. International Journal of Machine Tools & Manufacture 2005; 45(14): 1551-1559.
[10]. Hsieh C. C, OH K. P. Simulation and Optimization of Assembly Processes Involving Flexible Parts. Internal Journal of Vehicle Design 1997; 18(5): 455–465.
[11]. Xing, Zhao, Wu, W.W. Assembly variation analysis model based on fixture configurations for sheet metal parts. Computer Integrated Manufacturing Systems 2010; 16(2): 280-286. (in Chinese)