A MODERN APPROACH FOR MODELING THE COMBUSTION PROCESS IN
DIRECT INJECTION DIESEL ENGINES
СОВРЕМЕННЫЙ МЕТОД МОДЕЛИРОВАНИЯ ПРОЦЕССА ГОРЕНИЯ В ДИЗЕЛЬНЫХ ДВИГАТЕЛЯХ
С НЕПОСРЕДСТВЕННЫМ ВПРЫСКОМ ТОПЛИВА
Ass. Prof. PhD Punov P.1, Assoc. Prof. PhD Evtimov T.2
Faculty of Transport – Technical university of Sofia, Bulgaria, [email protected], [email protected]
Abstract
:
The article presents a modern approach for studying the combustion process in the DI Diesel engines developed for passenger car. The mixing controlled combustion model has been chosen for estimation the rate of heat released in the combustion chamber as well as the Arrhenius equation was used for ignition delay determination. The injection rate was calculated by means of constant injection pressure as well. Zero dimensional thermodynamic models have been used for estimation the in-cylinder parameters. All of the models were implemented as a computational code in Matlab. Finally, in-cylinder parameters variation such as pressure, temperature, rate of heat released etc., were studied at two engine operating points.KEYWORDS: DIESEL ENGINE, COMBUSTION MODELING, DIRECT INJECTION, IN-CYLINDER PROCESSES, SIMULATION
1.
Introduction
Modeling of the combustion process as part of the in-cylinder process into the modern diesel engines is an important point of the numerical engine development. A number of models have been presented over the years [1-3]. They could be divided into two groups: empirical and phenomenological. The simpler empirical models such as Double Wibe function [1, 2] can be used in calculating the combustion process without paying attention to the injection and evaporation of the fuel, geometrical parameters on the injection nozzle and combustion chambers etc. Usually, an accurate prediction on the heat release in the diesel combustion chamber by means of Wibe function is possible if the researcher has a lot of practical experience in real combustion analysis of the same engine or of an engine with similar mixing process. The more complicated phenomenological models are most commonly used in modern 0D programs for calculation of the combustion chamber heat release. The calculations are based on the real injection process including the injection pressure and the geometrical parameters of the nozzle and the combustion chamber as well as the fuel jet atomization and evaporation models are included in the model. Typical phenomenological diesel combustion models are mixing controlled model [2, 4, 5], stationary gas jet model, packet models, and time scale models [4].
2. Description of the mixing controlled model.
The mixing controlled combustion model was first presented by Chmela et al. [4] and further was developed by Lakshminarayanan [5]. In fact it is not fully phenomenological model because the model is based on empirical functions as well as no atomization and evaporation processes of the fuel jet. Also the variation of the pressure and temperature in combustion chamber are neglected. At the same time the injection process with all needed parameters and the mixing rate in combustion chamber are included. In an analogy with Double Wibe function the heat release rate is influenced by fuel availability and kinetic energy in combustion chamber which are presented in the model by two functions. The heat release rate in modern DI diesel engines with high pressure injection systems has a typical shape Figure 1 [5].
It is important to note that using the high pressure injection systems reduces the ignition delay period which in turn decreases the heat release rate during the first combustion period. During the first period of combustion the rate of heat release increase depends on the rate of kinetic energy input by fuel jet. The available kinetic energy steadily increases from zero at the start of injection up to the end of the first period. The first period is finished when the fuel jet
reaches the combustion chamber walls. It immediately reduces the jet kinetic energy and the rate of heat release has almost constant value during the second period. The second period finishes at the end of injection process. During the third period the rate of heat release decreases constantly to the end of combustion process because of decrease of fuel availability and kinetic energy in the chamber.
3. Mathematical background
3.1. Combustion model
On the basis of the assumptions above the rate of heat release can be presented in following form [5]:
(1)
C
.
f
1.
f
2d
dQ
m
=
ϕ
Fuel availability presented by
f
1 can be easily calculated by the following equation:(2)
u f
H
Q
g
f
1=
−
(3)
=
∫
ϕϕ
SOI f f
d
dg
g
(4)
=
∫
ϕϕ
SOId
dQ
Q
In order to calculate the function
f
1 it is necessary to know the fuel injection rate. When the geometrical parameters of the injector and fuel pressure are known the fuel injection rate can be calculated by the following equation:(5) f f n f d f
p
p
p
F
C
d
dg
(
)
.
2
.
.
.
−
=
ρ
ϕ
The effective area of the nozzle can be calculated using the equation:
(6)
4
.
.
d
2z
F
nπ
=
Function
f
2, which presents the mixing rate, depends on the density of turbulent kinetic energy.Three sources of kinetic energy there are in the diesel engine combustion chamber: the fuel jet, the swirl flow and the squish flow. Previous research has shown that main kinetic energy, which is approximately 96%, inputs into by fuel injection [5]. That is the reason why we neglect the kinetic energy which in result from swirl and squish flow.
A modified k−
ε
theory for zero dimensional combustion models has been proposed [5] to present the mixing rate in combustion chamber. In the combustion chamber the conditions are such that the mixing rate cannot be zero. For that reason the mixing rate is presented as an exponential function:(7) 3
. 2
V k Cr d
e
f
=
The density of the turbulent kinetic energy at any time can be calculated by the ratio of the total turbulent energy of the spray and the total mass of the air-fuel mixture in the spray:
(8)
)
.
1
.(
l
0g
E
k
f u dλ
+
=
The rate of the total turbulent energy of the fuel get is given by following equation: (9)
ϕ
ϕ
ϕ
d
dE
d
dE
d
dE
u=
i−
diss
The rate of input kinetic can be presented by following equation:
(10)
.
.
22
1
.
ν
ϕ
ϕ
d
dg
C
d
dE
f turb i=
The equation (10) can be rewritten as follows:
(11) 3 2
.
1
.
.
.
.
18
.
=
ϕ
ρ
ρ
ϕ
d
dg
F
C
n
C
d
dE
f f n d f turb iThe rate of dissipation energy is given by following equation:
(12) diss diss
E
un
C
d
E
.
.
6
=
ϕ
During combustion there are three regimes of heat release. At the first regime the turbulent energy depends on the kinetic energy on free jet. There is no contact of the injected fuel with the
combustion chamber walls. During this period equation (11) was used for calculating the rate of turbulent energy input with fuel jet.
The penetration of the fuel jet and speed of the free jet can be calculated by following equations:
(13)
8
.
.
.
.
.
4 0surr SOI e inj d
T
T
t
d
U
C
S
=
(14) 4 0
.
2
1
.
.
.
.
8
surr SOI e inj dT
T
t
d
U
C
V
=
(15) 0.
ρ
ρ
f ed
d
=
When the fuel jet reaches the combustion chamber walls it reduces the kinetic energy input with the fuel because of decreasing the jet speed. During the second period we can calculate the jet penetration and the speed of wall jet by following equations:
(16)
0
.
75
.
.
.
4 0surr imp e inj wall
T
T
t
d
U
S
=
(17) 4 0
.
2
1
.
.
.
75
.
0
surr imp e injT
T
t
d
U
V
=
3.2. Ignition delay modeling
A modeling of ignition delay period is necessary to determine the start of heat release in combustion chamber. The most commonly used model of ignition delay period is based on Arrhenius equation [1, 5]:
(18)
− −
=
R TE n k id u a
e
p
q
a
.
.
.
.τ
Different empirical constants have been proposed by different authors but the following equation was used for calculating the ignition delay period in this paper [5, 6, 7]:
(19) − = T
id p e
2100 02 , 1 . . 45 , 3
τ
Here,
p
andT
are the mean value of the pressure and the temperature during the ignition delay period.3.3. In-cylinder model
In order to determine the in-cylinder parameters a model based on the first law of thermodynamics was developed. The first law of thermodynamics equation was adopted as the engine cylinder was considered as an open thermodynamic system. In that case the equation has the form as follows:
(20)
∑
=
+
=
±
2 1.
)
.
(
.
j j jw
h
dM
d
M
e
p
dV
dQ
This basic relation (20) was transformed in compatible form for numerical estimation the cylinder pressure as a function of crankshaft rotation. The differential equation adopted different form as a function of in-cylinder process. The variations of this equation are presented below:
(21)
ϕ
ϕ
ϕ
d
dQ
T
c
M
p
d
V
dV
k
p
d
dp
wv
.
.
.
.
.
.
−
−
=
- combustion
(22)
ϕ
ϕ
ϕ
ϕ
d
dQ
T
c
M
p
d
V
dV
k
d
dQ
M
T
c
H
g
p
d
dp
wv v
u f
.
.
.
.
.
.
.
.
.
.
−
−
=
4. Computational algorithm
Our research is focused on the combustion modeling while the gas exchange processes are neglected. The calculation starts at the intake valve close point and finishes at the exhaust valve open point. The cylinder parameters are calculated by means of a zero dimensional model, based on first wall on the thermodynamic.
A heat exchange model with cylinder walls was implemented in the code by using Woschni’s equation for calculation of the heat exchange coefficient [8]. Figure 2 shows the block diagram of the algorithm. The code has been made in Matlab.
5. Results and discussion
The diesel engine under study is 2.0l direct injection developed for passenger cars. A study of combustion process was conducted at two operating points corresponding to engine speed of 2000rpm. The operating conditions were defined by different quantity of
injected fuel which provided different air-excess ratio. At each operating point the influence of injection timing was studied as well. Finally, comprehensive analysis of the estimated rate of heat released was done by means of functions variation (
f
1 andf
2). The geometric parameters of the engine are listed in the table below.Table 1
Cylinder bore D=84mm
Cylinder stroke S=86mm
Compression ratio ε=17
Length of combustion chamber Lbowl=35mm
Number of nozzle holes 6
Diameter of the holes d=0,12mm
Boost pressure pintake=0,2MPa
Intake temperature Tintake=340°K
Engine speed n=2000min-1
5.1. The results in air excess ratio
λ
=
2
Firstly, a study at engine operating point (n=2000rpmand
λ
=
2
) was conducted. The injection rate was estimated by means of an injector model in advanced simulation software AVL Hydsim. It was a model of a common rail injector controlled by solenoid valve. The injection pressure imposed in the model was 100Mpa as the injection duration was 22 deg by crank angle. The rate of fuel injection is shown in Figure 3. The study was conducted as the injection timing was varied within the range from -10deg to 0deg before TDC.Then the in-cylinder parameters were studied by means of computational code presented in the article. The parameters such as pressure, temperature, combustion chamber volume, mass, specific gas constants, gas composition, rate of heat release and etc. were estimated. The variation of some in-cylinder parameters are shown in the Figure 4, 5 and 6.
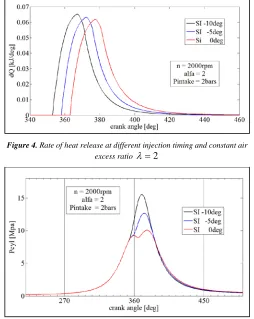
The results concerning the rate of heat release (Figure 4) revealed a small ignition delay period within the range of 4deg to 5deg by crank angle. The delay is short in the retarded injection, i.e. the 4deg delay period was observed in that case where the start of injection was at TDC. The results revealed a small influence of injection timing on the curve of rate of heat released. Mainly, earlier start of injection increases the maximum value of the rate of heat release which is in result the higher pressure and temperature in the combustion chamber.
Figure 2. Block diagram of the calculation algorithm
However, the pressure and temperature are highly influenced by injection timing. Early injection increased the maximum value both for pressure and temperature. It can be easy explained with the smaller volume of the combustion chamber where the combustion occurs. This phenomenon is well known and widely observed by many authors. In our study the highest pressure value meet 16MPa as the temperature at the same condition was 2100K.
This study conducted at partial load and medium speed revealed that mixing controlled combustion model in combination with 0D in-cylinder model was quite adequate to the phenomenological process in the combustion chamber of a modern diesel engine.
5.2. The results in air excess ratio
λ
=1,3Secondly, the similar study was conducted at full load operating point. At this regime direct injection automotive engines operates with typical value of air excess ratio
λ
=1,3to preventhigh level of soot emissions. To provide such air excess ratio the injection pressure was set up to 130MPa and injection duration was increased to 28 deg by crank angle. The same engine speed, intake pressure and injection timing values have been imposed in the model. Figure 7 shows the rate of fuel injection into the chamber.
The thermodynamic parameters in the cylinder and the rate of heat release can be seen in the figures below.
At full load the in-cylinder pressure increased due to the more quantity of injected fuel. The maximum value of pressure exceeds 17,5MPa which is typical for modern high boosted diesel engines. The temperature reached 2500K.
The results shows the appropriateness of the mixed controlled combustion models for estimating the combustion heat release taking into consideration the nozzle parameters, injection timing, injection pressure and the geometrical parameters of combustion chamber. At full load due to the higher injection pressure and more injected fuel the fuel jet reaches the combustion chamber walls. It Figure 5. Cylinder pressure at different injection timing and constant air
excess ratio
λ
=
2
Figure 4. Rate of heat release at different injection timing and constant air excess ratio
λ
=
2
Figure 6. Cylinder temperature at different injection timing and constant air
excess ratio
λ
=
2
Figure 7. Rate of fuel injection at difference injection timing and air excess ratio
λ
=
1
,
3
Figure 8. Calculated cylinder pressure in different injection timing and constant air excess ratio
λ
=1,3reduces the input kinetic energy with the fuel jet and reduces the rate of heat release which can be seen in Figure 10.
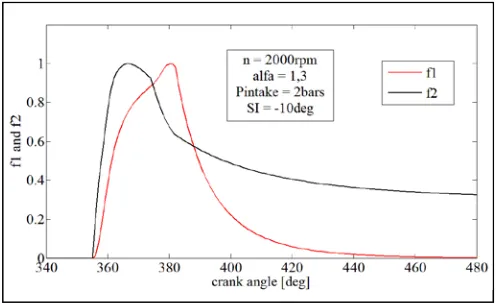
5.3. Analysis of the rate of heat release
According equation (1) the rate of heat release is defined by two functions. The functions in relative values are shown in Figure 11.
The results show that at the beginning of the injection the function
f
2 has bigger influence on the rate of heat release thanfunction
f
1. When the impingement occurs thef
2 starts to decrease rapidly to the end of the injection. After the end of injection the function slightly decreases. Thef
1 increases with lower speed at the beginning of the combustion and has maximum value at the end of injection. The function becomes zero at the end of the combustion process.6. Conclusion
The studies conducted at two engine operation points revealed that a mixed controlled combustion model can be successfully used for predicting the heat release in modern diesel engines with direct injection;
The influence of a great number of injection parameters (injection pressure, number and diameter of nozzle holes and injection timing) as well as geometrical parameters of the combustion chamber can be studied by means of simulating code which has been presented in the article;
In order to validate the model an experimental study has to be conducted. Then the measured values concerning in-cylinder pressure can be compared with those which have been obtained by the model.
References
[1] Heywood J.B., A text book on Internal Combustion engine fundamentals. McGraw-Hill International edition, 1988.
[2] Merker G.P. et all, Simulating combustion, Springer, 2006. [3] Ramos J.I., Internal combustion engine modeling, Hemisphere publishing corporation, 1989.
[4] Chmela F.G. and Orthaber G.C., Rate of heat release prediction for a direct injection diesel engine based on purely mixing controlled combustion. SAE 99010186, 1999.
[5] Lakshminarayanan P.A and Aghav Y.V., Modelling diesel combustion, Springer, 2010.
[6] Assanis D.N., Filipi Z.S., Fiveland S.B., Syrimis M., A predictive ignition delay correlation under steady-state and transient operation of a Direct injection Diesel engines. ASME-ICE Fall Technical Conference, 1999
[7] Watson N, Pilley A.D., Marzouk M., A combustion correlation for Diesel engine simulation, SAE Paper No. 80029, 1980
[8] Woschni, G.Die Berechnung der Wandwärmeverluste und der thermischen Belastung der Bauteile von Dieselmotoren, MTZ 31, 491-499, 1970.
Nomenclature
Q - Heat release;m
C
- Constant of the model;1
f
- function, depend on fuel availability;2
f
- function, depend on mixing rate.f
g - Cumulative mass of the fuel;
u
H
- Lower calorific value of the fuel.d
C
- Discharge coefficient of the nozzle holes;f
ρ
- Density of the injected fuel;n
F
- Effective area of the nozzle;f
p
- Pressure of the fuel in the nozzle;z
- Number of the holes on the nozzle; d - Diameter of the holes on the nozzle;p
- Cylinder pressure.T
- Cylinder temperature;u
E
- Total turbulent kinetic energy of fuel jet;λ
- Air excess ratio in diffusion burning;0
l
- Air fuel ratio for stoichiometric combustion of diesel;d
k
- Density of turbulent kinetic energy;V
- Instantaneous cylinder volume;r
C
- Constant for mixing rate;i
E
- Input kinetic energy;diss
E
- Dissipation energy.turb
C
- Efficiency of conversion of kinetic energy to turbulence energy in free jet;n - Engine speed.
diss
C
- Dissipation constant;inj
U
- Velocity of fuel jet at the exit of the nozzle;e
d
- Equivalent diameter of orifice;SOI
t
- Time after start of injection;0
T
- Reference temperature, 294Ksurr
T
- Surrounding temperature.imp
t
- Time at witch impingement occurs.q
- Equivalence ration;a
E
- Activation energy;u
R
- Gas constant; Figure 10. Rate heat release at different injection timing and constant airexcess ratio
![Figure 1. Typical rate of heat release in modern DI diesel engines [5]](https://thumb-us.123doks.com/thumbv2/123dok_us/8581146.1718947/1.595.309.552.286.461/figure-typical-rate-heat-release-modern-diesel-engines.webp)