Published online November 17, 2014 (http://www.sciencepublishinggroup.com/j/ajls) doi: 10.11648/j.ajls.20140206.11
ISSN: 2328-5702 (Print); ISSN: 2328-5737 (Online)
The effect of the rising abdominal perfusion pressure on
kidney Function assessed by the RIFLE criteria in critically
ill patients with multiorgan dysfunction
Hatem H. Elatroush
1, Nashwa Abed
1, Amna A. Metwaly
2, Mohamed I. Afify
1, Mayada M. Hussien
21
Critical Care Department Cairo University, Cairo, Egypt
2
Critical Care Department Theodor Bilhars research institute, Giza, Egypt
Email address:
[email protected] (Elatroush H.), [email protected] (Metwaly A.)
To cite this article:
Hatem H. Elatroush, Nashwa Abed, Amna A. Metwaly, Mohamed I. Afify, Mayada M. Hussien. The Effect of the Rising Abdominal Perfusion Pressure on Kidney Function Assessed by the RIFLE Criteria in Critically Ill Patients with Multiorgan Dysfunction. American Journal of Life Sciences. Vol. 2, No. 6, 2014, pp. 333-337. doi: 10.11648/j.ajls.20140206.11
Abstract:
Abdominal perfusion pressure (APP) is a novel, clinically measurable parameter to explain the circulatory compromise in the abdominal cavity, defined as the difference between the mean arterial pressure (MAP) and the intrabdominal pressure (IAP). Kidneys are especially vulnerable intrabdominal organ to the circulatory compromise and the third spacing in multiorgan dysfunction syndrome (MODS) patients. And this study was to evaluate the relationship of the APP to AKI assessed by RIFLE Patients and methods: 106 MODS patients were included in the study, routine laboratory investigations and vital signs were recorded and APP and RIFLE score were assessed daily for the first three days. Results: AKI patients had lower APP (86.3 ± 9.0 vs 78.4 ± 18.5 P 0.009). Patients with APP < 60mmHg showed worse RIFLE scores (0=0/18, R=1/6, I=2/27, F=13/39 p=0.03). APP was significantly correlated with urine output (r=0.239 P 0.013). Conclusion Low APP causes deterioration of kidney function and oliguria is the first and sensitive predictor.Keywords:
RIFLE, Abdominal Perfusion Pressure1. Introduction
APP, similar to the familiar concept of cerebral perfusion pressure, is defined as the difference between the mean arterial pressure (MAP) and the IAP, and implies that as the IAP rises, the perfusion of organs or vessels in or near the abdomen falls even in the absence of a drop in MAP. [1], for IAH has been identified as a continuum of pathophysiologic changes beginning with regional blood flow disturbances and culminating in frank end-organ failure and the development of ACS [2].
The effects of increased IAP are multiple, but the kidney is especially vulnerable to increased IAP because of its anatomic position [5], and it is the most consistently described organ dysfunctions with oliguria being one of the earliest clinical signs of IAH [6].
IAH should be considered as a potential cause of acute kidney injury in critically ill patients; [5] and can be present at relatively low levels of intra-abdominal pressure (IAP). [1]
Although the means by which kidney function is impaired
in patients with ACS is incompletely elucidated, available evidence suggests that the most important factor involves alterations in renal blood flow. [5]
Until recently, there was a lack of consensus as to the best definition, characterization, and evaluation of acute renal failure. [7]
RIFLE is the first widely accepted AKI definition, validated in over half a million patients worldwide [8]
Such an acronym conventionally described 3 stages of progressively higher creatinine levels or decreased urine output flows (risk, injury, and failure) and 2 outcomes (loss of function and end stage kidney disease) [9].
2. Aim of the Study
Our study is to evaluate the relationship of the APP to AKI in the critically ill patients.
3. Patients and Methods
SOFA subscore of > 2 in at least 2 organ systems.
Patients with age less than 18 years and chronic renal failure were excluded.
In all patients we recorded MAP, temperature, heart rate, urine output (UO), billirubin, creatinine, full blood count, arterial blood gases, sodium and potassium, lactate, Fluid gain, , IAP and APP.
IAP was measured via the bladder, using the closed loop system repeated measurements technique [10] twice a daily.
IAH is defined as an IAP that was persistently 12 mmHg or greater [11].
APP is calculated as the difference between MAP and mean IAP.
Renal function was assessed by the RIFLE criteria using the first three stages [9] , the estimated the serum creatinine (SCr) baseline was from the reversed Modification of Diet in Renal Disease equation [12].
Risk: SCr increased 1.5 times or UO of <0.5 ml/kg/hr for 6 hours
Injury: doubling of SCr or UO <0.5 mal/kg/hr for 12 hours
Failure: tripling of SCr or SCr >4 mg/dl with an acute rise > 0.5 mg/dl OR UO below 0.3 ml/kg/hr for 24 hours
4. Statistical Analysis
Data was transferred to the Statistical Package of Social Science Software program, version 21 (SPSS) to be statistically analyzed.
5. Results
Patients' mean age was 55.6±16.9; Based on the reason for ICU admission, there were 85 (80.2%) medical and 21 (19.8%) surgical, the mean APP was 79.7±17.5 and RIFLE 0 18(17%), R 7(6.6%), I 29(27.4%) and F 52(49.1%)
On admission, patients with low APP showed decline in renal function assessed by RIFLE criteria
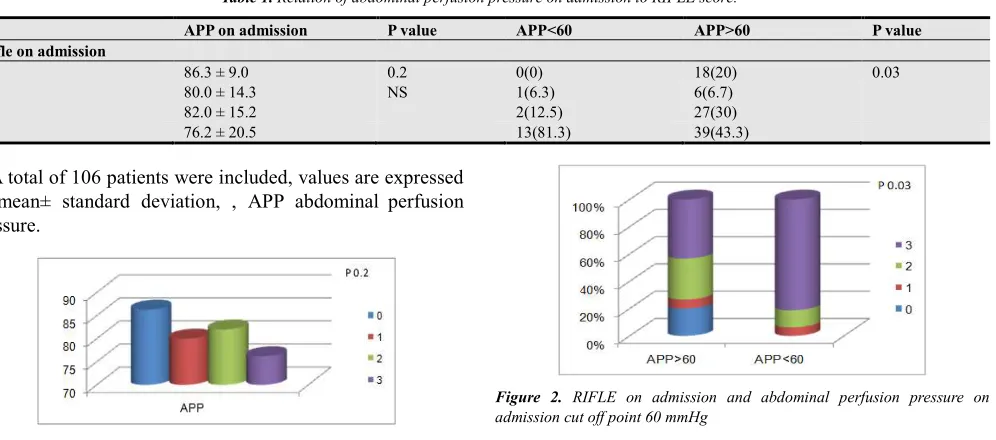
Table 1. Relation of abdominal perfusion pressure on admission to RIFLE score.
APP on admission P value APP<60 APP>60 P value
Rifle on admission
0 86.3 ± 9.0 0.2 0(0) 18(20) 0.03
1 80.0 ± 14.3 NS 1(6.3) 6(6.7)
2 82.0 ± 15.2 2(12.5) 27(30)
3 76.2 ± 20.5 13(81.3) 39(43.3)
A total of 106 patients were included, values are expressed as mean± standard deviation, , APP abdominal perfusion pressure.
Figure 1. Relation of APP on admission to RIFLE score
Figure 2. RIFLE on admission and abdominal perfusion pressure on admission cut off point 60 mmHg
APP was significantly lower in patients with [RIFLE >0]
Table 2. Relation of abdominal perfusion pressure on admission and with cut off point 60 mmHg to RIFLE >0 or =0 on admission
APP on admission P value APP<60 APP>60 P value
RIFLE>0
Yes 78.4 ± 18.5 0.009 16(100) 72(80) 0.07
No 86.3 ± 9.0 HS 0(0) 18(20)
Table 3. Mean APP of the first three days and the RIFLE > and = 0 on day 3
Mean APP mean±SD P value RIFLE>0 on
day 3
No Yes
87.4±9.7mmHg
81±15.8 mmHg 0.029
A total of 106 patients were included, values are expressed as mean± standard deviation number of cases, and figures in parentheses are percentages within APP > or< 60mmHg. APP abdominal perfusion pressure.
Table 4. Acute renal failure and APP on admission
RIFLE=F APP on admission P value APP<60 APP>60 P value
Yes 78.1± 18.2 0.009 13(81.3) 39(43.3) 0.006
No 84.9± 12.7 HS 3(18.8) 51(56.7) HS
The total population were included, values are expressed as mean± standard deviation (SD) , APP abdominal perfusion pressure.
A total of 106 patients were included, values are expressed as mean± standard deviation number of cases, and figures in parentheses are percentages within APP > or< 60mmHg. APP
abdominal perfusion pressure.
Figure 3. Acute renal failure and APP on admission cut off point at 60 mmHg
Table 5. Mean APP of the first three days and the RIFLE < and = 3 on day 3
Mean APP mean±SD P value RIFLE =3
on day3
Yes No
79 ± 17.3mmHg
85.6 ± 11.4mmHg 0.037
Figure 4. Mean APP of the first three days and the RIFLE < and = 3 on day 3
The total population were included, values are expressed as mean± standard deviation, APP abdominal perfusion pressure.
Urine output
On admission APP was significantly correlated with urine output.
Table 6. Urine output median and interquartile range between Patients with APP above and below 60mmHg
Urine OutPut
25thpercentile median 75th percentile Pvalue
APP >60mmHg 1287 2000 3100 <0.001
APP≤60mmHg 212.5 350 1200
A total of 106 patients were included, values are expressed as median and interquartile range.
Figure 5. Urine output median and interquartile range between Patients with APP above and below 60mmHg
Table 7. Presence of Oliguria and APP
UO <0.5ml/hr P UO <0.3ml/hr P
APP
Yes No Yes No
Day 1 72.8±24.2 82.1±14 0.07 67.6±26.3 82.2±14 0.03
Day 2 73.4±27.2 83.8±15.8 0.1 69±27.4 83.9±16.4 0.05
Day 3 66.9±29 85.1±13.5 0.014 64.9±30.8 84.8±13.6 0.02
The total population were included, values are expressed as mean± standard deviation, APP abdominal perfusion pressure, UO, urine output
Figure 6. ROC curve for APP on admission to presence of oliguria less than o.3ml/kg/hr
Predictors of ARF
Backward Stepwise logistic regression model was conducted to explore the significant predictors of ARF. Variables entered step 1 of the model was SIRS, APACHEII, Mean SOFA, MeanMAP and MeanAPP. Last step was significant(X2 = 48.964, df=1, P<0.001), R2 ranged from 0.370 – 0.494. Only SOFA was the significant predictors as shown in the following table.
Table 8. Backward Stepwise logistic regression model to predict ARF.
β P value OR 95% of OR Lower Upper
SOFA 0.485 <0.001 1.624 1.346 1.959
Constant -4.475 <0.001 0.011
6. Discussion
APP is a parameter combining both the pathogenesis incriminated in renal dysfunction in acute critical care settings[1]. The cause of renal dysfunction in ACS is multifactorial [2], available evidence suggests that the most important factor involves alterations in renal blood flow [3] and decreased arterial visceral perfusion [1], while The presence of IAH as a risk factor for acute kidney injury (AKI) has been shown in many clinical settings.[3]
Increased IAP is caused by tissue oedema from generalized capillary leak [1] causing multiple effects, but the kidney is especially vulnerable to increased IAP because of its anatomic position. [3]
IAH causes compression of the inferior vena cava [4].with subsequent increasing the hydrostatic pressure in the venous column, further impeding the venous return to the right heart chambers decreasing the cardiac preload.[5] and causing rise to renal venous congestion.[6]
The prognosis of AKI as a manifestation of IAH depends on the underlying pathology of IAH, early recognition, and timeliness of intervention. [7]
The systematic application of both IAH severity classes, as well as AKI stages (using RIFLE or AKIN [Acute Kidney Injury Network] criteria), may increase knowledge and awareness of the impact of earlier phases of IAH and less severe IAH on kidney function, as well as lead to more early and efficacious interventions.[3] as the impact of less severe IAH on AKI was virtually unrecognized.
In our study, Patients with AKI defined using the RIFLE classification RIFLE = 0 vs RIFLE >0, experienced significantly lower APP (78.4 ± 18.5 vs 86.3 ± 9.0 p =0.009), but the degree of injury assessed by RIFLE didn’t show that statistical significance (RIFLE 0 = 86.3 ± 9.0, 1 = 80.0± 14.3, 2 = 82.0 ± 15.2, 3 =76.2 ±20.5 p 0.2).
IAH should be considered as a potential cause of acute kidney injury in critically ill patient [3] In a cohort study of unselected ICU patients[9], IAH was an independent risk factor for the development of AKI ,and IAP of 12 mm Hg was the most optimal cutoff for AKI defined using the RIFLE classification (sensitivity, 91%; specificity, 67%; area under the receiver operating characteristic curve, 0.85).
Restoration of APP using norepinephrine improves renal blood flow in bacteremic animals with IAPs up to 30 mm Hg, and maintaining a therapeutic APP may preserve renal blood flow in patients with intra-abdominal hypertension[8]
While using the cut off point APP > or ≤ 60 mmHg in our study , as it is considered to be an indicator of abdominal hypoperfusion since it correlated well with survival from IAH and ACS [10],it showed that inevitably all patients having APP lower than 60 mmHg had AKI but with non significant P value 0.07 , while using renal SOFA subscore by Dorzi et al , the renal SOFA subscore was worse with APP cut off point 60mmHg but with non significant P value of 0.06 [10].
However in our study when we used the same cut off point but to discriminate the RIFLE=F, it was statistically significant (p 0.006)
Another study [9] investigated IAH and RIFLE F and it showed that the IAH can discriminate RIFLE F (p <0.0001). APP was an independent promoter of ARF [9] In our study, it showed strong relation between APP and presence of ARF, as APP was shown to be lower in RIFLE = F patients (78.1± 18.2 vs 84.9± 12.7 mmHg p 0.009)
In a study on liver transplant patients , IAH impaired renal function and was an independent risk factor for ARF after liver transplantation.[11]
Nice to mention that in our study, the mean APP of the first three days revealed highly significant relationship with AKI (RIFLE > 0) p 0.029 and the occurrence of acute renal failure too ( RIFLE = F) p 0.037.
Dalfino et al developed a logistic model including shock, IAH, APP, APACHE-II score, FG, surgical admission for ARF development. According to the level of significance, the stepwise analysis rated shock as most critical in the model for ARF development (RIFLE F), followed by IAH (P < 0.002) and low APP (P < 0.046). [9] but in our study APP didn’t show that significant for predicting AKI, when we applied Backward Stepwise logistic regression model, using SIRS, APACHE, SOFA day1, MAP D1 and APP D1. As Only SOFA was the significant predictor (p 0.001).
Oliguria and anuria are common problems facing ICU clinicians caring for patients with AKI [12] and It is also valuable marker of kidney function and a criterion for diagnosing and staging acute kidney injury (AKI) [13].
The presence of anuria and increased intra-abdominal hypertension score are predictors of increased mortality [7].
Oliguria progressing to anuria and pre renal azotemia unresponsive to volume expansion is characteristic of renal dysfunction of ACS [2].
In our study the urine output was lower with lower APP (p 0.013), and even the cut off point of 60mmHg for APP was having highly significant lower urine output (p <0.001).
In experimental studies carried out on euvolumic subjects, IAP of 20 mm Hg resulted in 75% reduction in glomrular filtration rate (GFR) and a pressure of 30 or above resulted in anuria.[2]
Interestingly here is, in an 137 patient study of critically ill ,Oliguric patients without a change in serum creatinine had an intensive care unit mortality rate (8.8%) significantly higher than patients without AKI (1.3%), and similar to oliguric patients with an increase in serum creatinine (10.4%). [13]
When investigating oliguric criterion of RIFLE (<0.5ml/kg/hr and <0.3ml/kg/hr) in our study , it showed significant relation with the APP (P 0.07 and 0.03 respectively) but not when relating APP to RIFLE (which comprises also creatinine criteria) as it is turned to be non significant (p 0.2 ). That is because urine flow rate is a sensitive and specific biomarker that provides an early warning signal for impending renal dysfunction [13]
Despite that in an 81 septic shock patients study admitted to a surgical-medical ICU, it showed that abdominal perfusion pressure was negatively correlated with maximal serum creatinine (P.001, r = 0.37) [14]
and is associated with adverse outcomes in intensive care unit patients [13] and in one study the incidence of AKI increased from 24%, based solely on serum creatinine, to 52% by adding the urine output as a diagnostic criterion [13] and oliguric patients without serum creatinine changes had a significantly higher mortality rate than non-AKI patients (P 0.007). [13]
References
[1] Mullens W, Abrahams Z, Francis GS, Taylor DO, Starling RC, Tang WHW. Prompt reduction in intra-abdominal pressure following large-volume mechanical fluid removal improves renal insufficiency in refractory decompensated heart failure. Journal of cardiac failure 2008; 14:508–14.
[2] Mohapatra B. Abdominal compartment syndrome. Indian Journal of Critical Care Medicine Volume 8 Issue (1) pg 26 2004.
[3] De Waele JJ, De Laet I, Kirkpatrick AW, Hoste E. Intra-abdominal Hypertension and Abdominal Compartment Syndrome. American journal of kidney diseases : the official journal of the National Kidney Foundation 2011; 57:159–69.
[4] Carrillo-Esper, Raúl, Jesús Ojino Sosa-García, Jorge Raúl Carrillo-Córdova, and Cinthia Leyva-Mondragón. “Abdominal compartment syndrome in trauma.” Cir Cir 80 (2012): 514-518.
[5] Raúl Carrillo-Esper, Jesús Ojino Sosa-García, Jorge Raúl Carrillo-Córdova and CL-M. Abdominal compartment syndrome in trauma. Cir Cir 2012; 80:514–8.
[6] Damman K, Navis G, Smilde TDJ, Voors AA, van der Bij W, van Veldhuisen DJ, et al. Decreased cardiac output, venous congestion and the association with renal impairment in
patients with cardiac dysfunction. European journal of heart failure 2007; 9:872–8.
[7] Lingegowda V, Ejaz AA, Sood P. Normotensive ischemic acute kidney injury as a manifestation of intra-abdominal hypertension. International urology and nephrology 2009; 41:1043–5.
[8] Peng ZY, Critchley LA, Joynt GM, Gruber PC, Jenkins CR, Ho AM-H. Effects of norepinephrine during intra-abdominal hypertension on renal blood flow in bacteremic dogs. Critical care medicine 2008; 36:834–41.
[9] Dalfino L, Tullo L, Donadio I, Malcangi V, Brienza N. Intra-abdominal hypertension and acute renal failure in critically ill patients. Intensive care medicine 2008; 34:707–13.
[10] Al-Dorzi HM, Tamim HM, Rishu AH, Aljumah A, Arabi YM. Intra-abdominal pressure and abdominal perfusion pressure in cirrhotic patients with septic shock. Annals of intensive care 2012;2 Suppl 1:S4.
[11] Shu M, Peng C, Chen H, Shen B, Zhou G, Shen C, et al. Intra-abdominal hypertension is an independent cause of acute renal failure after orthotopic liver transplantation. Frontiers of Medicine in China 2007; 1:167–72.
[12] Labib M, Khalid R, Khan A, Khan S. Volume management in the critically ill patient with acute kidney injury. Critical care research and practice 2013; 2013:792830.
[13] Macedo E, Malhotra R, Bouchard J, Wynn SK, Mehta RL. Oliguria is an early predictor of higher mortality in critically ill patients. Kidney international 2011; 80:760–7.