Published online March 10, 2014 (http://www.sciencepublishinggroup.com/j/ijepp) doi: 10.11648/j.ijepp.20140202.11
Flood assessment in the context of sustainable
development using the DPSIR framework
Marzieh Samareh Hashemi
1, Fateme Zare
1, Ali Bagheri
1, *, Ali Moridi
21
Dept. of Water Resources Engineering, Tarbiat Modares University, Tehran, Iran
2
Dept. of Water Resources Engineering, Abbaspour University of Technology, Tehran, Iran
Email address:
[email protected] (M. S. Hashemi), [email protected] (F. Zare), [email protected] (A. Bagheri), [email protected] (A. Moridi)
To cite this article:
Marzieh Samareh Hashemi, Fateme Zare, Ali Bagheri, Ali Moridi. Flood Assessment in the Context of Sustainable Development using the DPSIR Framework. International Journal of Environmental Protection and Policy. Vol. 2, No. 2, 2014, pp. 41-49.
doi: 10.11648/j.ijepp.20140202.11
Abstract:
The assessment in the context of sustainable development is a holistic approach for assessing the impacts and trade-offs related to various land and water management options. It is a procedure in which a knowledge-based approach should be derived to develop a basis for decision making. A Diver-Pressure-State-Impact-Response (DPSIR) framework has been adopted to carry out the assessment. It is illustrated in the case of Gorganrood Basin (located in the north east of Iran) for the issue of flood to describe the relationship between the origin and consequences of flooding and also to understand the dynamics underpinning the problem. The analysis of the state of flood by DPSIR shows that the responses in Gorganrood Basin have led to inadequate problem-solving results not even effective to reduce system sensitivity to flood in the long term. In the context of DPSIR some reasonable responses may be regarded as decreasing the rates of urbanization, deforestation, land consolidation, and immigration; watershed management programs; and river dredging. DPSIR helps in structuring data in a reasonable way and allows decision makers to trace step wise fundamental problem drivers and explores leverage points where appropriate responses can be exerted.Keywords: Assessment, Sustainable Development, DPSIR, Gorganrood Basin, Iran
1. Introduction
The concept of sustainable developmentwas first brought to public attention by the Brundtland report [1] and has since then has become the stated aspiration of societies all over the world [2]. The assessment in the context of sustainable development is a holistic approach for assessing the impacts and trade-offs related to various land and water management options, it set a basis for societal learning and decision-making processes [3]. Moreover, it gives a good entrance to a clear decision-making process especially at an operational level as it helps for discussion with various stakeholders [4]. Therefore, this process can be considered to provide a foundation for sustainability.
To do an assessment, for providing a strategic view of system, different kinds of frameworks are available. One of the most well-known examples of conceptual integrated
assessment frameworks is the Driving
forces-Pressures-States-Impacts-Responses (DPSIR) framework. That framework was first introduced by the
Organization for Economic Cooperation and Development (OECD) in 1993 as PSIR [5]. It considers a chain of causal links between various sectors of human activities and the environment [6].
It has been adopted in many reports on assessment. Some of the major ones are the assessment of quality and quantity of Europe’s water report by Europe Environmental Agency [7], the fourth Global Environment Outlook report (GEO4) by the United Nations Environment Program [8], the third World Water Development Report (WWDR) by United Nations [9] and many other different studies, see e.g. [10, 11, 12, 13].
framework is the flexibility in defining the contents of each capital. The System of Environmental-Economic Accounting for Water (SEEA-Water) is a framework for organizing hydrological and economic information in a coherent and congruous manner [16]. This system enables environmental statistics to be compared to economic statistics as the system boundaries are the same after some processing of the input statistics, so the main limit of this framework is using monetary evaluation of environmental benefits and it is based on an enlarged national account. The Millennium Ecosystem Assessment (MA) is another framework which provides an integrated assessment of the consequences of ecosystem change for human well-being and analyzes options available to enhance the conservation of ecosystems and their contributions to meeting human needs. Adopting this framework has limitation to substitution possibilities, especially with regulating, cultural, and supporting services [17]. Environmental Utilization Space (EUS) or Ecospace is another framework which uses a spatial equity principle in the usage of resources and their degradation. “It claims that all individuals have the same right to use an equal amount of natural resources and to pollute the global commons”. Unlike direct application of the carrying capacity concept, measures of EUS or Ecospace have to account for human demand and its evolution [15]. A weak point of this framework is that there is a different 'environmental utilization space' for each kind of resource, which have different units of measure, so they cannot be added to get an overall environmental utilization space for all the resources consumed by a system such as a country.
In this paper, the DPSIR framework has been chosen for the purpose of assessment practically for a flood issue. The framework is illustrated in the case of Gorganrood basin. The study area is located in the eastern part of the southern Caspian Sea coastline in Iran. The area receives high to moderate precipitation of 546 mm/year and flood is a serious issue there. In the recent years devastating floods have been occurred in Gorganrood especially in summer time [18]. Moreover, none of the studies on Gorganrood Basin has applied an integrated approach, relating driving forces and impacts of flood in such a way that it provides the ‘handles’ for policy makers and engineers to determine appropriate remedies. Thus, the present paper aims to describe the relationship between the origins and consequences of flooding in Gorganrood Basin, also to understand the dynamics underpinning the problem, focusing on the links among DPSIR elements, and explore leverage points where appropriate responses can be exerted.
2. Materials and Methods
2.1. The Assessment Process
Assessments which support the process of learning, reframing issues and adaptation should combine knowledge of different sustainable development domains (environmental, social, and economic) also bring in
elements that can lead to reframing the policy over time. The assessment process serves to the planning process as a whole. It can provide an insight to the relevance, effectiveness, and quality of proposed objectives of the system.
In the present paper, DPSIR has been adopted for the assessment and developing a basis for decision-making. In the next sections, the application of DPSIR will be illustrated in terms of an assessment in Gorganrood Basin, Iran.
2.2. DPSIR, Strengths and Weaknesses
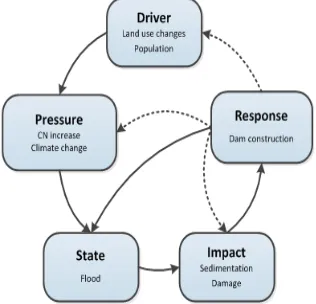
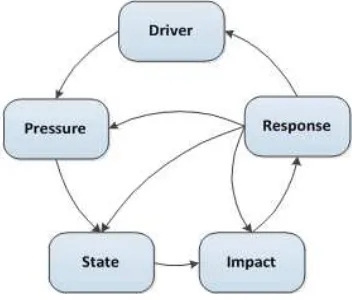
According to a systemic analysis of the relations between natural systems and human systems, driving forces such as social and economic needs will lead to activities which exert pressures on the environment and, as a result, the state of the environment will be subjected to change. For instance, flood intensification will impact on resources availability and biodiversity. Finally, those consequences will lead to Impacts on ecosystems and societies that may elicit a societal response that feeds back on the driving forces, pressures, states, or impacts directly, through adaptation or curative actions [19].The framework adopted to address those relations is the D-P-S-I-R (Drivers -Pressures - State - Impacts - Response) framework “Fig. 1”.
Figure 1. Schematic figure of DPSIR framework
The framework has some advantages while few disadvantages are also associated to DPSIR: The DPSIR framework is an effective means of organizing complex environmental information for policy formulation [11]. Another advantage of the DPSIR framework is that it shows, in a simple way, the important connections between people and the natural states. It also helps in communicating ideas among different researchers, policy makers and stakeholders [20]. Reference [21] showed that DPSIR, in terms of its traditional application, provides a framework for analysis and derives interventions that, in the opposite direction, by delimiting perspectives and scientific knowledge production, lead in a narrow and biased understanding of controversial issues.
difference between states and impacts.
A change in the state in the form of, for example, more flood, may have an entirely different impact on erosion rather than on human losses. This is a subtlety that is harder to deal with conceptually in the former Driver-State-Response (DSR) and Pressure-State-Response (PSR) frameworks.
Also with the causal chain, it is equally useful to make the distinction, as the DPSIR framework does, between driving forces and pressures. This recognizes that more macro level changes in the society, such as drought, may exert, as driving forces, different and changing pressures on the environment depending on the total constellation of driving forces and on the way a society deals with such changes.
It also states that changes in driving forces will lead, not necessarily, to changes in pressures [23]. Finally, there are some other characteristics in the DPSIR framework that have contributed to its wide use. It organizes the indicators with reference to political objectives related to the environmental management problem addressed; and it focuses on supposed causal relationships, in a clear way that appeals to policy actors [24]. At last, it identifies cause-and-effect relationships, allows for the separation of categories of issues, provides flexibility for usage and analysis, and provides a means by which monitoring can be systematically improved [25].
Some of the disadvantages associated to the DPSIR framework and to its precursors are that they were initially developed for environmental issues, without a global or systemic vision of sustainable development (SD). No consideration is made of the interactions between economic, social and environmental factors, as argued by [15]. It does not give guidance to select a balanced set of indicators, neither between different themes within one dimension of SD [26]. “The DPSIR framework is built for ex post assessment and it is not so plain for ex ante assessment as state and impact indicators are generally based on measured data” [27]. In addition, categorization in DPSIR, to give an indicator often raises discussion, among experts, particularly at lower levels, rather than a country level. However, for analytical purposes, the scheme is unsatisfactory. The simple causal relations assumed cannot capture the complexity of interdependencies in the real world [28, 29, 24]. Another limitation does exist with DPSIR’s ability to encompass, for example, multiple drivers or stresses in a single, efficient scheme meaning things can become cumbersome and messy [30].
The policy responses lead to changes in the DPSIR chain. Reference [31] stated that the weak point of this framework is that the same item can appear in different components depending upon the target we are focusing on. Reference [21] showed that there is an essential need for expanding the DPSIR framework and its application to associate the social and economic concerns. They argued that bringing adequate attention not only to the state of the environment, but also to the state of social matters, are essential and the understanding of socio-economic and cultural drivers should be broadened.
2.3. The Study Area
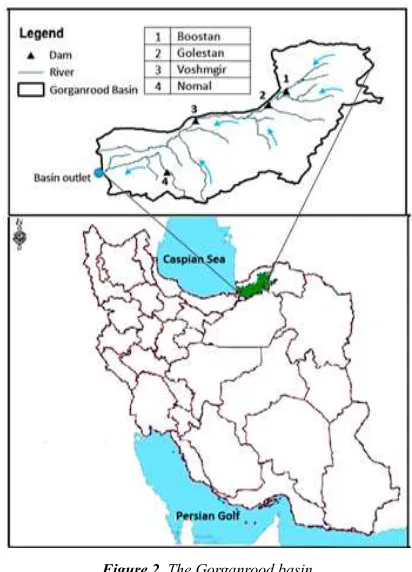
The Gorganrood basin, located in the eastern part of the southern Caspian Sea coastline, was considered as a study area to illustrate application of the integrated assessment of Flood. Although Iran is dominated by an arid and semi-arid climate, the northern part of the country along the southern Caspian Sea coastline receives high to moderate precipitation. Annual precipitation, however, decreases in the west to east direction [32]. The climate in the study area is characterized as mild and the annual precipitation drops from 450 to 250 mm in the west to east direction. The district covers an area of 13935 Km2, 60 percent of which is mountainous and the rest is plain. “Fig. 2” shows the location of the basin in the country.
Figure 2. The Gorganrood basin
Iran is the 8th country in the world that encounters most of natural disasters. 3262 flood events were reported in Iran from 1952 to 2000 and flood damages in the last decade of that period grew by a rate of 250% compared to that in the first decade. The flood damages were such a big amount that 70 percent of the average budget annually allocated for natural disasters impacts is dedicated to compensate the flood damages [18]. The Gorganrood basin is so prone to flooding. In the recent years devastating floods have been occurred in Gorganrood especially in summer time [18]. Thus, to seek effective responses to floods an integrated assessment of flood in this basin is so important.
over time (a measure of change in the state).
In the second phase the pressure responsible for the change in the state of flood has been identified, using participatory and field research methods. The third phase involved identification of the driving forces responsible for the pressure. During the fourth phase, the impact of change in the state of the flood has been determined. The indicators associated to DPSIR categories for the issue of flood in Gorganrood Basin are defined as follows:
State indicators, show changes in the state of system due to pressures. The changing state examined in the Gorganrood basin is the flood. According to reports on Gorganrood Basin [18] and interviews with the local experts, flood is one of the most important issues in the area. The peak flow has been selected as an indicator of flood in that area.
Pressure indicators, measure the pressures as a result of the driving forces. One of the most important pressures in Gorganrood Basin is the curve number (CN) increase as a result of change in land use. Degradation of land use can induce significant impacts on infiltration and surface roughness leading to higher flood discharges. CN can be used as an indicator of surface roughness. The change in land use between 1991 and 2003 has been analyzed in terms of such a change in infiltration resulting in surface roughness representing the CN. The Other pressure is climate change. Temperature and precipitation have been selected as indicators to represent pressures of climate change; reviewing those parameters revealed an increasing trend. Increasing temperature is likely to lead to increasing precipitation and the snow cover will contract resulting in the discharge of rivers to increase which is expected to lead to higher flood discharges.
Driving forces indicators reflect pressures exerted by natural phenomena and anthropogenic activities, so we can categorize Driving forces into two groups, the first group is the drivers which can be affected by anthropogenic activities. The most important driver in the Gorganrood basin is land use changes and the growing population. The second group is exogenous i.e. the drivers which cannot be effectively affected, the responses to those kinds of drivers is usually adaptation. An example of such driving forces is global climate change. Impact indicators assess the effect that a pressure has on the state of flood. The principal impacts of flooding on the basin are economic damages and excess sedimentation, thus "damage" and "sedimentation" are chosen as impact indicators. The changes in the state of flood lead to excessive erosion and consequently high sediment loads. On the other hand, Gorganrood River tends to have naturally high sediment fluxes due to its bed easily erodible rock formations. The other important impact is economic damages which have been quantified in the present paper. Quantifying flood
damage shows that the damage has increased in the study area (quantifying flood damage has been discussed in the next section). The preceding discussion has surveyed a range of different Drivers, Pressures, State and Impacts which are summarized in Table 1.
Table 1. The DPSIR scheme of Gorganrood Basin
DPSIR Indicators
Driver Land use changes, Population
Pressure Changes of CN, Temperature, Precipitation
State Flood
Impact Sedimentation Damage
3. Results
In the present paper, the selected indicators linked to the DPSIR chain are quantified. The process of quantification is described in this part starting with drivers.
3.1. Drivers
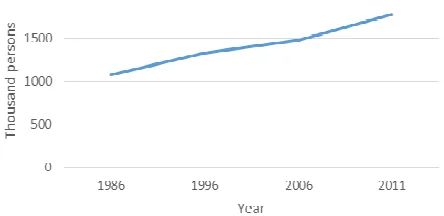
One of the drivers in Gorganrood basin is the population. The population in 2006 was 1480582 which were 2% of the total country population (Iran Statistics Centre, 2006). The area of the province is 0.8% of the total country area which means the population density in 2006 was 113 persons per square kilometer. This population density is about three times more than the average of population density (43 persons per square kilometer) in the country. In addition the average rate of population growth during the past 20 years is 1.6%. “Fig. 3” shows the population growth in the study area.
Figure 3. Population growth in Gorganrood basin (Ref. Iran Statistics Centre)
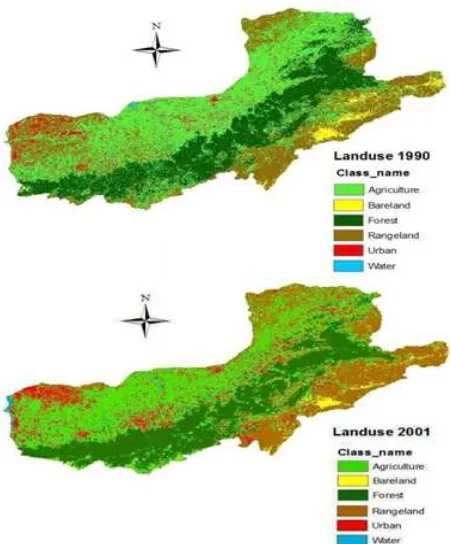
patterns of 1990 and 2001 are shown in “Fig. 4”. The land use in the Gorganrood basin is mainly agricultural lands.
Table 2 shows the area and percentage of each class of land use in the study region. Comparison between the land uses in 1990 and 2001 shows that forests have been converted into urban lands. The area of urban lands has risen by 4.44% and during the same period, the total forest area has fallen by 2.77%. Land uses were also altered because of infrastructures development such as roads, transportation and services, to enhance accessibility to production and distribution centers and promote mobility among the inhabitants. Lands were also needed in an increasing rate for housing facilities to accommodate the growing population (the average rate of population growth in the study area in the last 20 years has been %1.6 per year according to The Iran Statistic Centre. The growth of urbanized areas will cause more impervious land surface.
According to Table 2 the CN has risen during 1990-2001. This increase caused the decrease of maximum potential retention coefficient from 95.5 to 80. The runoff is affected by the maximum potential retention coefficient, thus low numbers show high run-off potential.
Figure 4. a) The Land use map of Gorganrood Basin in 1990 b) The Land use map of Gorganrood Basin in 2001
Table 2. The Land use, CN and Maximum potential retention coefficient changes in Gorganrood Basin from 1990 to 2001
Land use class Bare land Forest Rangeland Urban Agriculture Water
Area (Km2) 1990 286.5 3449.9 3269.34 610.54 5416.18 17.41
2001 240.5 3087.8 3282.26 1189.74 5230.51 18.64
Percentage 1990 2.19 26.43 25.053 4.678 41.505 0.133
2001 1.846 23.66 25.152 9.117 40.082 0.142
Changes (%) -0.36 -2.77 0.1 4.44 0.013 -1.42
CN 1990 86.7 70 68.45 86.4 74.4 -
2001 95.7 71.2 70 86.6 74.4 -
Average CN 1990 72.4
2001 74.5
Maximum Potential Retention Coefficient
1990 95.5
2001 80
Fig 5. Variations of maximum temperature in Gorganrood Basin (adapted from [33])
Figure 7. The trend in annual rain fall in Gorganrood Basin (adapted from [33])
Figure 8. Instantaneous maximum flood (Golestan Regional Water Organization)
The other pressures in the DPSIR chain of Gorganrood Basin are temperature and precipitation increases due to the effect of climate change. Relying on the trend, jump, and homogenous stochastic tests, adopted according to World Meteorological Organization [33] showed the climate change effect in Gorganrood Basin. The trends of temperature and rain fall variations associated with climate change are shown in “Fig. 5”, “Fig. 6” and “Fig. 7”.
3.2. State
The pressures have changed the state of flood peak flow in Gorganrood Basin. The trend of flood peak flow as an indicator of flood in the area shows an increase during the period of study. “Fig. 8” shows the trend of flood peak flows.
3.3. Impacts
The most important impact of flood is its economic damages. Floods occurred in the study area have caused damages of billions Rials1 (Iranian currency) in terms of lost lives and damages to the infrastructures such as buildings, roads, bridges, and buried pipelines.
Miller’s method [34] has been applied to calculate the value of lost lives. Miller estimated the values of statistical
1
25000 Rials= US $ 1
life from 68 reasonably credible studies spread across 13 countries; the values are typically 120 times of GDP per capita [34]. Using Miller’s method, we calculated the flood damage due to the value of lost lives. The damage was added to the damages associated to other factors such as forests, rangeland, agriculture, and livestock to determine the total flood damages “Fig. 9”. The other impact of flood is sedimentation especially in the reservoirs. For example, about 10% of Golestan Reservoir was filled with sediment only in two years after operation [35].
Figure 9. Total flood damage in Gorganrood Basin
In this section, using DPSIR framework, we showed how the information on flood issue has been structured. It also helped to give a clear explanation on the relations between population, land use change, climate change, CN, temperature and precipitation, flood, sedimentation, and damage are clear. The structured information helps the communication between researchers and policy makers, also seeking effective responses.
4. Discussion
The DPSIR scheme can be usefully applied to analyze the changing state of floods. It appeared to serve as a rather reasonable framework of structuring the information. Building up a DPSIR framework and developing a set of indicators for drivers, pressures, state and impacts, the paper documented an increasing rate of flood in the study area. The major drivers for that increasing rate of flooding were identified as land use and climate change. Those drivers caused an increase in CN, precipitation and temperature which led to higher flood discharge correspondingly, damage and sedimentation were identified as the most important impacts of flood in the study area. Responses to the changing state of flood are investigated also in the context of a DPSIR framework.
“the ability of a system to evolve in order to accommodate environmental hazards or policy change and to expand the range of variability with which it can cope” [36]. Most responses in Gorganrood Basin were devoted to construction of flood control and prevention infrastructures, such as dams and repairing of structures damaged by inundation of water. For example, after the great flood in 1992 with a peak flow magnitude of 182 m3/s, the Golestan reservoir was constructed. It is a homogeneous earth dam with a total storage capacity of 37 MCM. Also after the great floods in 2001 and 2002 with the peak flow magnitudes of 1650 m3/s and 450 m3/s the Boostan reservoir was constructed. The Boostan reservoir is also a homogeneous earth dam with a total storage capacity of 104 MCM. Analyzing the peak floods and damages showed that the rate of increase in damages is less than the increasing rate of peak flows which shows the response (building dams) has declined the damages of flood in the study area.
“Fig. 10” shows that the rate of increase in damages is less than that of peak flows. It should be mentioned that to be comparable, damages and peak flows are dimensionless in “Fig. 10”. Another evidence is that after having built Golestan and Boostan reservoirs, three notable floods occurred in 2001, 2002, and 2005 correspondingly, but their economic damages were less than that of the flood occurred in 1992, when Golestan and Boostan dams were not existing, though the area was more developed [18]. “Fig. 11” shows that although the magnitude of the peak flow (flood) in 2005 is more than triple of the one in 1992 the damages are about the same as each other.
Figure 10. The trends of dimensionless peak flows and damages as an impact of peak flow
Figure 61. The effect of Dam construction on Flood Damages
But those kinds of responses which are mostly directed to the state and impacts of system cause the system, in a short term, to get resistant aiming to reduce the sensitivity component of the basin vulnerability to flood. However, in the long term the system will get more vulnerable to flood due to the side effects leading other components of the system vulnerability to increase.
The responses in Gorganrood Basin have led to inadequate problem-solving results not even effective to reduce the sensitivity of system to flood in the long term. Construction of dams has brought side effects such as excess sedimentation, immigration and more land use changes which are still important issues in the basin. Sedimentation reduces the storage capacity of reservoirs, as well as affecting the ecological functioning of the system.
On the other hand, dam construction has resulted in increased water supply followed by a growing rate of employment, especially in the agricultural sector; that led in turn to a growing rate of immigration to this region which caused more land use changes and increase in the rate of devastating forests and expansion of the urban areas. Those kinds of responses should not be viewed as solution by themselves; they helped in solution, but do little to address the fundamental drivers of the problem [30]. In a DPSIR context the responses are directed to the problem state. The driving forces are left unchecked to grow leading to higher flood discharges “Fig. 12”.
Figure 72. Responses can be directed to drivers, pressure, states and Impacts, but in Gorganrood Basin has been directed to the state only
5. Conclusion
In the present paper we investigated the assessment of flood with an illustration of the application of the DPSIR framework as an assessment tool. The DPSIR framework provides a tool for communication between researchers and policy makers, though may be somewhat biased. The framework helps in structuring data in a reasonable way and allows decision-makers to trace step-wise fundamental problem drivers through actual impacts, and explore leverage points where appropriate responses can be exerted. For example, the importance of land use change is not easily seen at the macro-planning level. As a result, the importance of understanding land use issues has not been recognized. Those proposed responses can provide insights to the relevance, effectiveness and quality of proposed policies. The results of the case study suggested key points which can be applied in the process of policy definition for the system. Those key points for the issue of flood in Gorganrood Basin are decreasing the rates of urbanization, deforesting, and land consolidation; decreasing the immigration rate; watershed management programs; and dredging rivers.
References
[1] WCED, World Commission on Environment and Development, Our Common Future, (The Brundtland Report), Oxford University Press, Oxford, UK, 1987.
[2] Bagheri, A., Hjörth, P. (2007). Planning for Sustainable Development: a Paradigm Shift towards a Process-Based Approach, Sustainable Development, 15, 83–96.
[3] Letcher, R. A., Croke, B. F. W., Jakeman A. J. (2007). Integrated assessment modelling for water resource allocation and management: A generalized conceptual framework, Environmental Modelling & Software, 22, 733-742.
[4] Dijk, J. V., Vlist, M. V., Tatenhove, J. V. (2011). Water Assessment as controlled informality, Environmental Impact Assessment Review, 31, 112–119.
[5] OECD, Organization for Economic Co-operation and Development, (1993). OECD Core Set of Indicators for Environmental Performance Reviews: A Synthesis Report by the Group on the State of the Environment. Paris, France, OECD Environment Monographs No. 83. OCDE/GD (93) 179. 39pp.
[6] Vázquez, J. F., Mattei F. E. E. (2003). A methodology for policy analysis in water resources management, EAERE FEEM VIU European Summer School 2003.
[7] EEA, European Environment Agency, (2003). Europe's water: An indicator-based assessment, Topic report 1/2003, Copenhagen, Denmark.
[8] UNEP, United Nations Environment Programme, (2007).Global Environment Outlook 4, Environment for development, United Nations Environment Programme (UNEP) Nairobi, Kenya.
[9] UN, United Nations, (2009). World Water Development Report 3. Water in a Changing World, The United Nations Educational, Scientific and Cultural Organization (UNESCO).
[10] Scheren, P. A. G. M., Kroeze, C., Janssen, F. J. J. G., Hordijk, L., Ptasinski, K. J. (2004). Integrated water pollution assessment of the Ebrie´ Lagoon, Ivory Coast, West Africa, Journal of Marine Systems, 44, 1– 17.
[11] Agyemang, I., McDonald, A., Carver, S. (2007). Application of the DPSIR framework to environmental degradation assessment in northern Ghana, Natural Resources Forum, 31, 212–225.
[12] Binimelis, R., Monterroso, I., Rodríguez-Labajos, B. (2009). Catalan agriculture and genetically modified organisms (GMOs) —An application of DPSIR model, Ecological Economics, 69, 55–62.
[13] Benini, L., Bandini, V., Marazza, D., Contin, A. (2010). Assessment of land use changes through an indicator-based approach: A case study from the Lamone river basin in Northern Italy, Ecological Indicators, 10, 4–14.
[14] Bossel, H. (1999). Indicators for sustainable Development: Theory, Method, Applications, International Institute for Sustainable Development (IISD).
[15] Geniaux, G., Bellon, S., Deverre, C., Powell, B. (2005). PD 2.2.1 sustainable development indicator frameworks and initiatives, SEAMLESS integrated project, EU 6th
Framework Programme, contract no.
010036-2.www.SEAMLESS-IP.org.
[16] UN, United Nations, (2012). SEEA-Water System of Environmental-Economic Accounting for Water, Department of Economic and Social Affairs Statistics Division.
[17] MA, Millennium Ecosystem Assessment, (2003). Ecosystems and Human Well-being: A Framework for Assessment, Island Press.
[18] Ghalkhani, H., Saghafian, B., Koohian afzal, F. (2010). Developing model of Golestan dam flood warning system (Gorganrood river), Flood damage studies, (in Persian), Document code: RIV2-87057, Technical report Water research institute.
[19] Smeets, E., Weterings, R. (1999). Environmental indicators: typology and overview. Technical report No. 25.European Environment Agency, Copenhagen, 19 pp.
[20] Potschin, M. (2009). Land use and the state of the natural environment, Land Use Policy, 26, 170–177.
[21] Svarstad, H., Petersen, L. K., Rothman, D., Siepel, H., Watzold, F. (2008). Discursive biases of the environmental research framework DPSIR, Land Use Policy, 25, 116–125.
[22] Niemeijer, N., Groot, R. S. de. (2008a). A conceptual framework for selecting environmental indicator sets, Ecological Indicators, 8, 14–25.
[23] Niemeijer, N., Groot, R. S. de. (2008b). Framing environmental indicators: moving from causal chains to causal networks, Environ Dev Sustain, 10, 89–106.
[25] Walmsley, J. J., Consultants, M. (2002). Framework for Measuring Sustainable Development in Catchment Systems, Environmental Management, 29(2), 195–206.
[26] Alkan Olsson, J., Bockstaller, C., Stapleton, L. M., Ewert, F., Knapen, R., Therond, O., Geniaux, G., Bellon, S., Correira, T., Turpin, N., Bezlepkina, I. (2009). A goal oriented indicator framework to support integrated assessment of new policies for agri-environmental systems, environmental science & policy, 12, 562–572.
[27] Bockstaller, C., Guichard, L., Makowski, D., Aveline, A., Girardin, P., Plantureux, S. (2008). Agri-environmental indicators to assess cropping and farming systems, A review. Agron. Sustain. Dev, 28, 139–149.
[28] Kelly, K. L. (1998). A Systems Approach to Identifying Decisive Information for Sustainable Information, European Journal of Operational Research, 109, 452-464.
[29] Caeiro, S., Mourão, I., Costa, M. H., Painho, M., Ramos, T. B., Sousa, S. (2004). Application of the DPSIR model to the Sado Estuary in a GIS context – Social and Economical Pressures, Eco-Imagine opening conference GI and GIS for integrated coastal management, Seville, Spain.
[30] Ness, B., Anderberg, S., Olsson L. (2010). Structuring
problems in sustainability science: The multi-level DPSIR framework, Geoforum, 41, 479–488.
[31] Greeuw, S., Kok, K., Rothman, D. (2001). Factors Actors Sectors and Indicators. International Center for Integrative Studies (ICIS), working paper I01-E004, Maastricht University, Maastricht, the Netherlands.
[32] Saghafian, B., Farazjoo, H., Bozorgi, B., Yazdandoost, F. (2008). Flood Intensification due to Changes in Land Use, Water Resour Manage, 22, 1051–1067.
[33] Modaresi, F. (2009). Assessment of Climate Change Effect on the Flood Peak Discharge Case Study: Gorganroud Basin, (in Persian) MSc thesis, University of Tehran, Tehran, Iran.
[34] Miller, T. R. (2000). Variations between Countries in Values of Statistical Life, Journal of Transport Economics and policy, 34(2), 169-188.
[35] Sharifi, F., Saghafian, B., Telvari, A. (2002). The Great 2001 Flood in Golestan Province, Iran: causes and 369 consequences. International Conference on Flood Estimation, Switzerland.
![Figure 7. The trend in annual rain fall in Gorganrood Basin (adapted from [33])](https://thumb-us.123doks.com/thumbv2/123dok_us/8485309.1715049/6.595.324.542.207.324/figure-trend-annual-rain-fall-gorganrood-basin-adapted.webp)