Marabathuni et al. World Journal of Pharmaceutical and Medical Research
FORMULATION DEVELOPMENT AND
IN VITRO
EVALUATION OF FLOATING
TABLETS OF LAFUTIDINE BY DIRECT COMPRESSION METHOD
B. Venkatesh, Yamparala Krishnakumari, Kelavathu Anjaiahnaik, Muravani Satyaraj and V. Jhansi Priya Marabathuni*
Department of Pharmaceutics, Bellamkonda Institute of Technology & Science, podili. A.P-523240.
Article Received on 17/02/2018 Article Revised on 10/03/2018 Article Accepted on 31/03/2018
INTRODUCTION
Oral delivery of drugs is the most preferable route of drug delivery. Oral route is considered most natural, uncomplicated, convenient and safe due to its ease of administration, patient compliance and flexibility in formulation and cost-effective manufacturing process.[1]
Many of the drug delivery systems, available in the market are oral drug delivery type systems Pharmaceutical products designed for oral delivery are mainly immediate release type or conventional drug delivery systems, which are designed for immediate release of drug for rapid absorption. These immediate release dosage forms have some limitations such as:
1. 1 Controlled Drug Delivery Systems
Controlled drug delivery systems have been developed which are capable of controlling the rate of drug delivery, sustaining the duration of therapeutic activity and/or targeting the delivery of drug to a tissue.
METHODOLOGY
Analytical method development
a)Determination of absorption maxima
A solution containing the concentration 10 µg/ mL drug was prepared in 0. 1N HCL UV spectrum was taken
using Double beam UV/VIS spectrophotometer. The solution was scanned in the range of 200 – 400 nm.
b)Preparation calibration curve
10mg Lafutidine pure drug was dissolved in 10ml of methanol (stock solution1) from stock solution1 1ml of solution was taken and made up with10ml of 0. 1N HCL (100μg/ml). From this 1ml was taken and made up with 10 ml of 0. 1N HCL (10μg/ml). The above solution was subsequently diluted with 0. 1N HCL to obtain series of dilutions Containing 2, 4, 6, 8, 10 µg /ml of per ml of solution. The absorbance of the above dilutions was measured at 236 nm by using UV-Spectrophotometer taking 0. 1N HCL as blank. Then a graph was plotted by taking Concentration on X-Axis and Absorbance on Y-Axis which gives a straight-line Linearity of standard curve was assessed from the square of correlation coefficient (R2) which determined by least-square linear regression analysis.
Drug – Excipient compatibility studies
Fourier Transform Infrared (FTIR) spectroscopy[11-15] The compatibility between the pure drug and excipients was detected by FTIR spectra obtained on Bruker FTIR Germany (Alpha T). The solid powder sample directly place on yellow crystal which was made up of ZnSe. The
ISSN 2455-3301
WJPMR
AND MEDICAL RESEARCH
www.wjpmr.com
*Corresponding Author: V. Jhansi Priya Marabathuni
Department of Pharmaceutics, Bellamkonda Institute of Technology & Science, podili. A.P-523240.
ABSTRACT
In the present research work gastro retentive floating matrix formulation of Lafutidine by using various polymers were developed. Initially analytical method development was done for the drug molecule. Absorption maxima was determined based on that calibration curve was developed by using different concentrations. Gas generating agent sodium bicarbonate concentration was optimized. Then the formulation was developed by using different concentrations of polymers Xanthan gum, guar gum and Sodium Alginate as polymeric substances. The formulation blend was subjected to various preformualation studies, flow properties and all the formulations were found to be good indicating that the powder blend has good flow properties. Among all the formulations Only Xanthan gum, Sodium Alginate highest concentrations (60 mg) retards the drug release upto 12 hours and the drug release 96. 25%, 95. 81% respectively. In this Xanthan gum releases the more drug release when compared to Sodium alginate. So F3 Formulation considered as optimized formulation. Optimised formulation F3 was kept for release kinetic studies. From the above graphs, it was evident that the formulation F3 was followed the Peppas release mechanism.
spectra were recorded over the wave number of 4000 cm
-1
to 550 cm-1.
Pre formulation parameters
The quality of tablet, once formulated by rule, is generally dictated by the quality of physicochemical properties of blends. There are many formulations and process variables involved in mixing and all these can affect the characteristics of blends produced. The various characteristics of blends tested as per Pharmacopoeia.
Angle of repose[16-20]
The frictional force in a loose powder can be measured by the angle of repose. It is defined as, the maximum angle possible between the surface of the pile of the powder and the horizontal plane. If more powder is added to the pile, it slides down the sides of the pile until the mutual friction of the particles producing a surface angle, is in equilibrium with the gravitational force. The fixed funnel method was employed to measure the angle of repose.
Table 1: Angle of Repose values (as per USP). Angle of Repose Nature of Flow
<25 Excellent
25-30 Good
30-40 Passable
>40 Very poor
Bulk density[21-26]
Density is defined as weight per unit volume. Bulk density, is defined as the mass of the powder divided by the bulk volume and is expressed as gm/cm3. The bulk density of a powder primarily depends on particle size distribution, particle shape and the tendency of particles to adhere together. Bulk density is very important in the size of containers needed for handling, shipping, and storage of raw material and blend. It is also important in size blending equipment. 10 gm powder blend was sieved and introduced into a dry 20 ml cylinder, without compacting. The powder was carefully leveled without compacting and the unsettled apparent volume, Vo, was read.
Tapped density
After carrying out the procedure as given in the measurement of bulk density the cylinder containing the sample was tapped using a suitable mechanical tapped density tester that provides 100 drops per minute and this was repeated until difference between succeeding measurement is less than 2 % and then tapped volume, V measured, to the nearest graduated unit. The tapped density was calculated, in gm per L, using the formula:
Measures of powder compressibility
The Compressibility Index (Carr’s Index) is a measure of the propensity of a powder to be compressed. It is determined from the bulk and tapped densities. In theory, the less compressible a material the more flowable it is.
As such, it is measures of the relative importance of interparticulate interactions. In a free- flowing powder, such interactions are generally less significant, and the bulk and tapped densities will be closer in value.
For poorer flowing materials, there are frequently greater interparticle interactions, and a greater difference between the bulk and tapped densities will be observed. These differences are reflected in the Compressibility Index which is calculated using the following formulas:
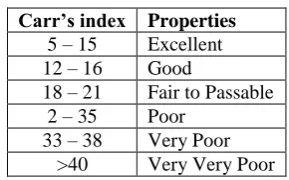
Table 2: Carr’s index value (as per USP). Carr’s index Properties
5 – 15 Excellent
12 – 16 Good
18 – 21 Fair to Passable
2 – 35 Poor
33 – 38 Very Poor
>40 Very Very Poor
Formulation development of floating Tablets
For optimization of sodium bicarbonate concentration, granules were prepared by direct compression method.
Procedure for direct compression method
1) Drug and all other ingredients were individually passed through sieve no¹ 60.
2) All the ingredients were mixed thoroughly by triturating up to 15 min.
3) The powder mixture was lubricated with talc. 4) The tablets were prepared by using direct
compression method by using 7mm punch.
Optimization of Sodium bicarbonate
Sodium bicarbonate was employed as effervescent gas generating agent. It helps the formulation to float. Various concentrations of sodium bicarbonate were employed; floating lag time and floating duration were observed. Based on the concentration of sodium bicarbonate was finalised and preceded for further formulations.
Table 3: Optimization sodium bicarbonate concentration.
Ingredients DO1 DO2 DO3
Lafutidine 20 20 20
Xanthan Gum 60 60 60
NaHCO3 5 7. 5 10
Citric Acid 7. 5 7. 5 7. 5
Mg. Stearate 3 3 3
Aerosil 3 3 3
MCC pH 102 Q. S Q. S Q. S
Total weight 250 250 250
All the quantities were in mg.
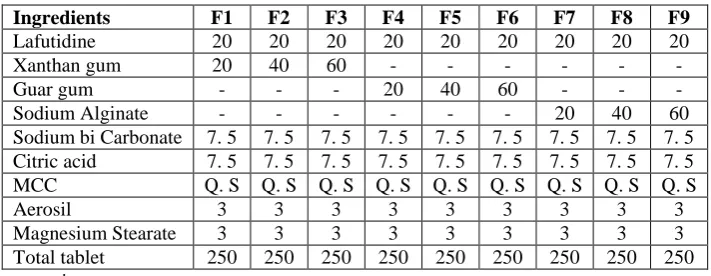
Table 4: Formulation composition for Floating tablets.
Ingredients F1 F2 F3 F4 F5 F6 F7 F8 F9
Lafutidine 20 20 20 20 20 20 20 20 20
Xanthan gum 20 40 60 - - - -
Guar gum - - - 20 40 60 - - -
Sodium Alginate - - - 20 40 60
Sodium bi Carbonate 7. 5 7. 5 7. 5 7. 5 7. 5 7. 5 7. 5 7. 5 7. 5
Citric acid 7. 5 7. 5 7. 5 7. 5 7. 5 7. 5 7. 5 7. 5 7. 5
MCC Q. S Q. S Q. S Q. S Q. S Q. S Q. S Q. S Q. S
Aerosil 3 3 3 3 3 3 3 3 3
Magnesium Stearate 3 3 3 3 3 3 3 3 3
Total tablet 250 250 250 250 250 250 250 250 250
All the quantities were in mg.
Evaluation of post compression parameters for prepared Tablets
The designed compression tablets were studied for their physicochemical properties like weight variation, hardness, thickness, friability and drug content.
Weight variation test
To study the weight variation, twenty tablets were taken and their weight was determined individually and collectively on a digital weighing balance. The average
weight of one tablet was determined from the collective weight. The weight variation test would be a satisfactory method of deter mining the drug content uniformity. Not more than two of the individual weights deviate from the average weight by more than the percentage shown in the following table and none deviate by more than twice the percentage.[27-30] The mean and deviation were determined. The percent deviation was calculated using the following formula.
Table 5: Pharmacopoeial specifications for tablet weight variation. Average weight of
tablet (mg) (I. P)
Average weight of tablet (mg) (U. S. P)
Maximum percentage difference allowed
Less than 80 Less than 130 10
80-250 130-324 7. 5
More than More than 324 5
Hardness
Hardness of tablet is defined as the force applied across the diameter of the tablet in order to break the tablet. The resistance of the tablet to chipping, abrasion or breakage under condition of storage transformation and handling before usage depends on its hardness. For each formulation, the hardness of three tablets was determined using Monsanto hardness tester and the average is calculated and presented with deviation.
Thickness
Tablet thickness is an important characteristic in reproducing appearance. Tablet thickness is an important characteristic in reproducing appearance. Average thickness for core and coated tablets is calculated and presented with deviation.
Friability
It is measured of mechanical strength of tablets. Roche friabilator was used to determine the friability by following procedure. Pre-weighed tablets were placed in the friabilator. The tablets were rotated at 25 rpm for 4 minutes (100 rotations). At the end of test, the tablets were re- weighed, and loss in the weight of tablet is the measure of friability and is expressed in percentage as.
Determination of drug content
Both compression-coated tablets of were tested for their drug content. Ten tablets were finely powdered quantities of the powder equivalent to one tablet weight of Lafutidine were accurately weighed, transferred to a 100ml volumetric flask containing 50 ml water and were allowed to stand to ensure complete solubility of the drug. The mixture was made up to volume with water. The solution was suitably diluted and the absorption was determined by UV –Visible spectrophotometer. The drug concentration was calculated from the calibration curve.
In vitro Buoyancy studies
The in vitro buoyancy was determined by floating lag time, and total floating time. (As per the method described by Rosa et al) The tablets were placed in a 100ml beaker containing 0. 1N HCl. The time required for the tablet to rise to the surface and float was determined as floating lag time (FLT) and duration of time the tablet constantly floats on the dissolution medium was noted as Total Floating Time respectively (TFT).
In vitro drug release studies Dissolution parameters:
Apparatus -- USP-II, Paddle Method
Dissolution Medium -- 0. 1 N HCL
RPM -- 50
Sampling intervals (hrs) --0. 5, 1, 2, 3, 4, 5, 6, 7, 8, 10, 11, 12
Temperature -- 37°C + 0. 5°C
As the preparation was for floating drug release given through oral route of administration, different receptors fluids are used for evaluation the dissolution profile.
Procedure
900ml of 0. 1 HCL was placed in vessel and the USP apparatus –II (Paddle Method) was assembled. The medium was allowed to equilibrate to temp of 37°C + 0. 5°c. Tablet was placed in the vessel and the vessel was covered the apparatus was operated for 12 hours and then the medium 0. 1 N HCL was taken and process was continued from 0 to 12 hrs at 50 rpm. At definite time intervals of 5 ml of the receptors fluid was withdrawn, filtered and again 5ml receptor fluid was replaced. Suitable dilutions were done with media and analyzed by spectrophotometrically at 236 nm using UV-spectrophotometer.
Application of Release Rate Kinetics to Dissolution Data
Various models were tested for explaining the kinetics of drug release. To analyze the mechanism of the drug release rate kinetics of the dosage form, the obtained data
were fitted into zero-order, first order, Higuchi, and Korsmeyer-Peppas release model.
Zero order release rate kinetics
To study the zero–order release kinetics the release rate data are fitted to the following equation.
RESULTS AND DISCUSSION[34-35] Analytical Method
a. Determination of absorption maxima
The standard curve is based on the spectrophotometry. The maximum absorption was observed at 236 nm.
b. calibration curve
Graphs of Lafutidine was taken in 0. 1N HCl (pH 1. 2).
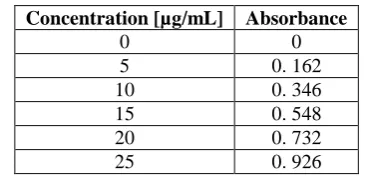
Table 6: Observations for graph of Lafutidine in 0. 1N HCL.
Concentration [µg/mL] Absorbance
0 0
5 0. 162
10 0. 346
15 0. 548
20 0. 732
25 0. 926
Standard graph of Lafutidine was plotted as per the procedure in experimental method and its linearity is shown in Table and Fig. The standard graph of Lafutidine showed good linearity with R2 of 0. 999, which indicates that it obeys “Beer- Lamberts” law.
Fig. 1: Standard graph of Lafutidine in 0. 1N HCL. 8. 2. Drug – Excipient compatibility studies
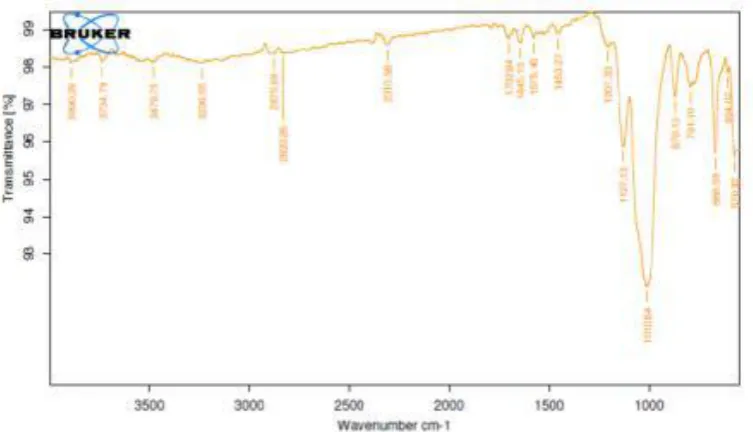
Fourier Transform-Infrared Spectroscopy
Fig. 3: FTIR Spectrum of optimized formulation. Table 7: Pre-formulation parameters of blend.
Formulation code
Angle of repose (θ) ±SD
Bulk density (gm/cm) ±SD
Tapped density (gm/cm) ±SD
Hausner ratio (HR)±SD
Carr index (Ic) ±SD
F1 22.21±0.825 0.224±0.010 0.262±0.011 1.129±0.006 11.423±0.511
F2 21.84±0.645 0.210±0.010 0.260±0.010 1.180±0.010 15.398±0.594
F3 22.96±0.471 0.227±0.010 0.266±0.005 1.173±0.005 15.002±0328.
F4 22.85±0.520 0.230±0.010 0.270±0.010 1.173±0.010 14.827±0.550
F5 22.46±0.471 0.225±0.020 0.260±0.010 1.150±0.060 15.792±0.357
F6 22.64±0.746 0.234±0.015 0.270±0.026 1.190±0.010 16.016±0.640
F7 23.64±0.312 0.220±0.005 0.282±0.011 1.207±0.004 17.676±0.732
F8 22.85±0.665 0.230±0.011 0.260±0.010 1.124±0.005 15.399±0.592
F9 21.54±0.346 0.220±0.010 0.266±0.015 1.190±0.010 15.397±0.594
F10 22.87±0.934 0.250±0.010 0.250±0.010 1.163±0.030 11.706±0.512
F11 22.43±0.726 0.230±0.011 0.260±0.010 1.180±0.010 16.676±0.560
F12 24.06±0.556 0.230±0.011 0.300±0.010 1.199±0.009 16.015±0.640
# All the values are expressed as mean ± SD. (n=3)
There was no disappearance of any characteristics peak in the FTIR spectrum of drug and the polymers used. This shows that there is no chemical interaction between the drug and the polymers used. The presence of peaks at the expected range confirms that the materials taken for the study are genuine and there were no possible interactions.
Lafutidine are also present in the physical mixture, which indicates that there is no interaction between drug and the polymers, which confirms the stability of the drug.
Tablet powder blend was subjected to various pre-formulation parameters. The angle of repose values indicates that the powder blend has good flow properties. The bulk density of all the formulations was found to be in the range of 0.421 to 0.561 (gm/ml) showing that the powder has good flow properties. The tapped density of all the formulations was found to be in the range of 0.581 to 0.642 showing the powder has good flow properties.
The compressibility index of all the formulations was found to be below 18 which shows that the powder has good flow properties. All the formulations has shown the hausners ratio ranging between 0 to 0.146 indicating the powder has good flow properties.
Optimization of sodium bicarbonate concentration Three formulations were prepared with varying concentrations of sodium bicarbonate by direct compression method to compare the floating buoyancy in between direct compression method. The formulation containing sodium bicarbonate in 7.5 mg concentration showed less floating lag time in wet granulation method and the tablet was in floating condition for more than 12 hours.
Quality Control Parameters For tablets
Fig. 4: Dissolution data of Lafutidine Floating tablets containing Xanthan Gum. Table 8: In vitro quality control parameters.
Formulation code
Weight variation Average wt
(mg)±SD
Hardness (Kg/cm2) in±SD
Diameter (mm) ±SD
in Thickness (mm) ±SD
in Friability (%)±SD
Drug content uniformity
(%)±SD
F1 200.2± 0.952 4.932± 0.115 8.67± 0.577 2.129± 0.010 0.766± 0.090 96.362±0.305
F2 199.97± 0.877 4.863± 0.115 9.00± 0.000 2.239± 0.049 0.745± 0.060 98.738±0.228
F3 200.1± 0.857 4.946± 0.115 8.65± 0.577 2.253± 0.000 0.779± 0.017 98.432±0.355
F4 200.14± 0.815 4.644± 0.115 9.00± 0.000 2.204± 0.100 0.663± 0.010 94.513±0.130
F5 200.5± 0.885 4.943± 0.115 .32± 0.577 2.144± 0.066 0.592± 0.055 97.564±0.407
F6 195.6± 0.824 4.856± 0.115 9.65± 0.577 2.126± 0.055 0.759± 0.015 99.044±0.817
F7 200.15± 0.815 4.737± 0.115 8.65± 0.577 2.942± 0.057 0.663± 0.010 98.424±0.116
F8 200.04± 0.889 4.802± 0.200 8.67± 0.577 2.355± 0.100 0.782± 0.010 96.172±0.677
F9 200.12± 0.748 4.355± 0.208 9.34± 0.577 2.245± 0.057 0.756± 0.057 99.672±0.612
F10 200.2± 0.834 4.465± 0.115 8.67± 0.577 2.881± 0.052 0.769± 0.011 98.148±0.502
F11 199.58± 0.934 5.062± 0.155 9.00± 0.000 2.250± 0.000 0.671± 0.010 99.486±0.147
F12 200.3±0.833 4.801± 0.200 8.65± 0.577 2.279± 0.057 0.764± 0.011 98.592±0.391
All the parameters for tablets such as weight variation, friability, hardness, thickness, drug content was found to be within limits.
In Vitro Drug Release Studies Table- 9.
Formulation codes
Average Weight (mg)
Hardness (kg/cm2)
Friability (%loss)
Thickness (mm)
Drug content (%)
Floating lag time (Seconds)
Total Floating Time (Hrs)
F1 249. 3 5. 5 0. 43 3. 0 99. 12 25 s >12 hrs
F2 249. 6 6. 0 0. 45 2. 9 98. 34 35 s >10 hrs
F3 249. 7 5. 5 0. 67 3. 1 100. 12 56 s >18 hrs
F4 248. 3 5. 5 0. 45 3. 2 101. 34 75 s >20 hrs
F5 247. 5 6. 0 0. 78 3. 0 98. 12 60 s >20 hrs
F6 249. 2 5. 5 0. 87 2. 9 99. 45 80 s >24 hrs
F7 251. 6 5. 5 0. 65 3. 0 100. 43 35 s >12 hrs
F8 250. 7 6. 0 0. 32 2. 9 101. 91 30 s >12 hrs
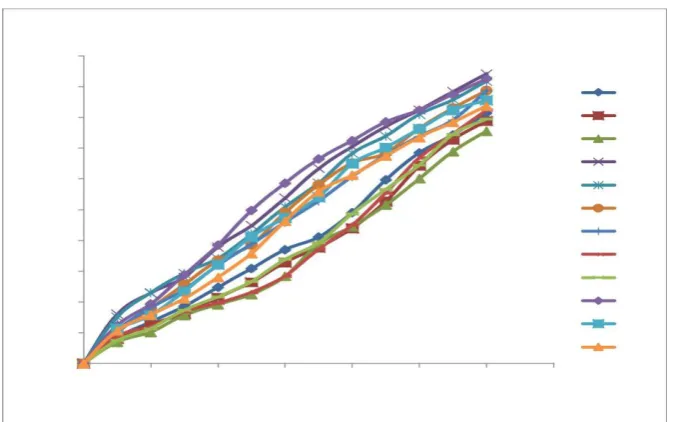
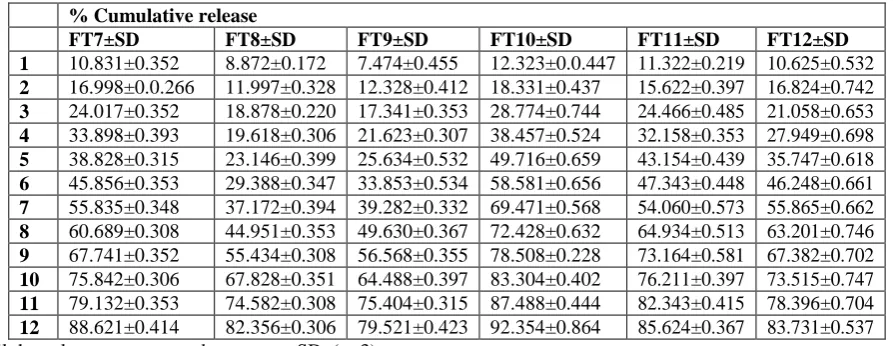
Table 10: In-vitro drug release data of Lafutidine floating tablets of Batch F7 to F12. % Cumulative release
FT7±SD FT8±SD FT9±SD FT10±SD FT11±SD FT12±SD
1 10.831±0.352 8.872±0.172 7.474±0.455 12.323±0.0.447 11.322±0.219 10.625±0.532
2 16.998±0.0.266 11.997±0.328 12.328±0.412 18.331±0.437 15.622±0.397 16.824±0.742
3 24.017±0.352 18.878±0.220 17.341±0.353 28.774±0.744 24.466±0.485 21.058±0.653
4 33.898±0.393 19.618±0.306 21.623±0.307 38.457±0.524 32.158±0.353 27.949±0.698
5 38.828±0.315 23.146±0.399 25.634±0.532 49.716±0.659 43.154±0.439 35.747±0.618
6 45.856±0.353 29.388±0.347 33.853±0.534 58.581±0.656 47.343±0.448 46.248±0.661
7 55.835±0.348 37.172±0.394 39.282±0.332 69.471±0.568 54.060±0.573 55.865±0.662
8 60.689±0.308 44.951±0.353 49.630±0.367 72.428±0.632 64.934±0.513 63.201±0.746
9 67.741±0.352 55.434±0.308 56.568±0.355 78.508±0.228 73.164±0.581 67.382±0.702
10 75.842±0.306 67.828±0.351 64.488±0.397 83.304±0.402 76.211±0.397 73.515±0.747 11 79.132±0.353 74.582±0.308 75.404±0.315 87.488±0.444 82.343±0.415 78.396±0.704 12 88.621±0.414 82.356±0.306 79.521±0.423 92.354±0.864 85.624±0.367 83.731±0.537 # All the values are expressed as mean ± SD. (n=3).
From the dissolution data it was evident that the formulations prepared with Guar Gum as polymer were retarded the drug release Less than 12 hours.
Whereas the formulations prepared with higher concentration of Xanthan gum retarded the drug release up to 12 hours in the concentration 60 mg. In lower concentrations, the polymer was unable to retard the drug release upto 12 hours.
Fig. 8: Zero order release kinetics.
The formulations prepared with Sodium alginate gum showed good retardation capacity of drug release (95. 81%) up to 12 hours in concentration 60 mg whereas Less concentrations (20 mg, 40 mg) not retard the drug release up to 12 hours. Hence, they were not considered.
5.8.5 Different Drug Release Kinetics Model For Lafutidine Floating Tablets
Table 11: Regression coefficients fit to different drug release kinetics models for Lafutidine floating tablets. Formulation Zero order First order Higuchi Peppas
code r2 r2 r2 r2 n
F1 0.917 0.942 0.910 0.974 0.904
F2 0.985 0.902 0.865 0.970 0.969
F3 0.977 0.990 0.848 0.963 0.993
F4 0.994 0.916 0.952 0.990 0.780
F5 0.992 0.930 0.951 0.989 0.767
F6 0.995 0.943 0.940 0.995 0.878
F7 0.997 0.916 0.930 0.994 0.867
F8 0.960 0.857 0.818 0.928 0.956
F9 0.992 0.922 0.885 0.986 0.979
F10 0.983 0.955 0.956 0.990 0.863
F11 0.996 0.958 0.942 0.994 0.865
F12 0.995 0.959 0.922 0.978 0.910
CONCLUSION
Development of Gastro retentive floating drug delivery of Lafutidine tablets is to provide the drug action up to 12 hours. From the compatibility studies, it is concluded that, HPMC K4M, Xanthangum, HPMCK100,were compatible with drug Lafutidine and thus suitable for the formulation of Lafutidine floating tablets. Lafutidine tablets were fabricated by direct compression method. In-vitro buoyancy studies were performed for all the formulations, F1 to F12 by using 0.1 N HCL solution at 370C. Tablet containing HPMC (F4) showed good buoyancy with very short lag time and long floatation time of more than 12 hrs in 0.1 N HCL. In-Vitro release
ACKNOWLEDGEMENT
The author and Co-author thankful to Management of BITS College of Pharmacy, Podili for provide all the facilities and supports for accomplishment and completion of this research work.
CONFLICTS OF INTEREST
The authors declare that there are no conflicts of interest.
REFERENCES
1. Leon Lachman, Herbert a. Liberman, The Theory and Practice of Industrial Pharmacy, 293-302. 2. Robinson JR, Lee V. H. L, Controlled Drug
Delivery: Fundamentals and Applications, 2nd edn. Marcel Dekker, New York, 1978; 24-36.
3. Brahmankar D. M, Jaiswal S. B, Biopharmaceutics and Pharmacokinetics a Treatise, 1st ed. Vallabh Prakashan; New Delhi, 1995; 64-70.
4. Chein Y. W, Novel Drug Delivery Systems, 2nd ed.: Marcel Dekker; New York, 1992; 4-56.
5. Ansel, Pharmaceutical Dosage Form and Drug Delivery System, Lipincott, 7th edition, 553. 6. Gennaro R. A. Remington, the Science and Practice
of Pharmacy, 20th ed. New York: Lippincott Williams, 2000; 1045.
7. Banker G. S, Rhodes C. T, Modern Pharmaceutics. 3rd ed. Marcel Dekker, New York, 1996; 678-721. 8. Vyas S. P, Khar R. K, Controlled Drug Delivery:
Concepts and Advances, 1st ed. Vallabh Prakashan, New Delhi, 2002; 345-376.
9. Shweta Arora, Floating Drug Delivery: A Review, AAPS Pharm Scitech., 2005; 47(11): 268-272. 10. Libo Yang, A New Intragastric Delivery System for
the Treatment of H. Pylori associated with gastric ulcers, Elsevier J. Of Controlled Release., Apr 1999; 34(5): 215-222.
11. Ross and Wilson, Anatomy Physiology and Health Education. 9th ed. Churchil Livingston, 295-311. 12. Wilson K. R. W, Waugh A. Anatomy and
Physiology in Health and Illness, 9th ed. Churchill Livingstone: London, 1996; 342-345.
13. Garima Chawla- A Means to address regional variability in intestinal drug absorption: Pharmtech, 2003; 234-238.
14. Chawla G, Gupta P, Koradia V, Bansal A, Gastroretention: a means to address regional variability in intestinal drug absorption, Pharm. Tech., 2003; 50-68.
15. Desai S, Bolton S. A floating controlled release system: in-vitro and in-vivo evaluation, J. Pharm. Res., 1993; 10; 1321-1325.
16. Garg S, Sharma S. Gastroretentive drug delivery systems, Pharmatech, 2003; 160-164.
17. Dr. Jose, Khalid Shah, Gastroretentive drug delivery system, business brief, Pharmtech., 2003; 165-173. 18. Deshpande A. A, Shah N. H, Rhodes C. T,
development of a novel controlled release system for gastric retention, J. Pharm. Res., 1997; 14(6);
19. Garima Chawla- A means to address regional variability in intestinal drug absorption: Pharmtech, 2003; 234-238.
20. David S. S. The effect of density on the gastric emptying on single and multiple unit dosage forms. J. Pharm Res., 1986; 3; 208-213.
21. H. g. Sivakumar, floating drug delivery system for prolonged gastric residence time: a review, Ind. J. Pharm. Edu., Oct-Dec-2004; 311-316.
22. B. N. Singh, H. Kim, Floating drug delivery system an approach to control drug delivery via gastric retention, J. Controlled Release., 2000; 63(7): 235-259.
23. B. Y. Choi, H. J. Park, Preparation of alginate beads for floating drug delivery system: effect of co2 gas forming agent. J. Controlled Release, 2000; 25(6): 488-491.
24. Ingani H. M, Timmermans J, Moes A. J, concept and in-vivo investigation of peroral sustained release floating dosage forms with enhanced gastrointestinal transit, Int. J. Pharm., 1987; 35: 157-164.
25. Bhavana V, Khopade A. J, Jain W. D, Shelly and Jain N. K, targeted oral drug delivery, Indian Drugs., 1996; 33: 365-373.
26. Roop K. Khar, controlled drug delivery, Gastroretentive system, 4th Edn., 202-203.
27. Hradman J. G, Limbrid, Goodman Gilman’s, the Pharmacological Basis of Therapeutics, 10th Edn, New York, 2001; 1765.
28. Ichikawa M, Watanabe S, Miyake Y, A new multiple-unit oral floating dosage system: preparation and in-vitro evaluation of floating and sustained-release characteristics, J. Pharm. Sci., 1991; 80: 1062-1066.
29. Abubakr O. Nur and Jun S. Zhang, captopril floating and/or bioadhesive tablets: Design and Release kinetics, Taylor and Francis, 2000; 26(9): 965 – 969. 30. Menon A, Wolfgang A. R, Saks A. Development and evaluation of a monolithic floating dosage form for furosemide, J. Pharm. Sci., 1994; 83: 239-245. 31. Ozdemir N, Ordu S, Ozkan Y. Studies of floating
dosage forms of furosemide: in-vitro and in vivo evaluations of bilayer tablet formulations, drug. Dev. Ind. Pharm., 2000; 857-866.
32. Xu X, Sun M, floating matrix dosage form for phenaporlaminehcl based on gas forming agent, int. J. Pharm, 2006; 25(4): 324-332.
33. Srivastava A. K, Wadwa S. Oral sustain delivery of atenolol from floating matrix tablets and invitro evaluation, drug. Dev. Ind. Pharm., 2005; 31(45): 367-374.
34. Wie J. P, Huang, preparation of the 5-fluoro uracil floating sustain release tablets for gastric retention, beijing, da Xue Xue Bao., 2004; 36(4): 493-442. 35. Streubel A, Siepmann J, Bodmeier R, floating