INTRODUCTION
Global climate is changing dramatically. Every sphere of our life is influenced by these changes, including the agricultural sector. Con-tinual and dramatic air temperature increase and changed temporal variability of rainfall are most relevant outcomes of climate changes. The chang-es in soil moisture caused by thchang-ese procchang-esschang-es are significant from the agricultural point of view because soil water is the only water resource for plants. The water and food security also concerns the economic risk and financial challenges caused by drought [Aghakouchak et al., 2015]. The exact knowledge about the processes in vadose zone of soil is very important for precise agriculture and irrigation management. The movement of water and solutes in the unsaturated zone is an incred -ibly complex process due to the heterogeneous nature of soil and variable atmospheric boundary conditions at the soil surface over short time pe-riods [Saifadeen and Gladnyeva, 2012]. Knowing the amount and the dynamics of the soil water
content, we may predict and react in time to the current, especially the climatic conditions of the environment [Jurík and Kaletová, 2014].
Nowadays, several methods of soil water content determination exist. Many of them have one essential disadvantage, namely, they do not take the spatial scale and spatial variability of soil moisture into account. Traditional surface moni-toring or point model simulations are very often used for soil moisture determination but these methods have deficiency just in this case. New methodologies with using modern technologies need to be found to reach quality spatial informa-tion about SWC.
Nowadays, the best way to process the spa -tial data in landscape is to use a geographical in-formation system (GIS). GIS is helping in many fields of research. The main benefit of GIS is an option to conduct the spatial analysis with incor -poration many factors. [Fuska et al., 2014] stated that the GIS is a functional complex created by integrating the technical and software instru -ments, geodata, work processes of the operating
Accepted: 2019.11.30 Available online: 2019.12.20
Volume 21, Issue 1, January 2020, pages 112–119 https://doi.org/10.12911/22998993/113076
Spatial Scale Analysis of Soil Water Content in Agricultural Soils
of the Nitra River Catchment (Slovakia)
Andrej Tárník
1*, Dušan Igaz
11 Department of Biometeorology and Hydrology, Horticulture and Landscape Engineering Faculty, Slovak University of Agriculture, Hospodárska 7, 949 76 Nitra, Slovakia
* Corresponding author’s e-mail: [email protected]
ABSTRACT
Determining the soil water content (SWC) in a soil profile is very important task for agriculture and also for a wider ecological context. The spatial and temporal variability of SWC is a elementary issue for agricultural practice, irrigation management, or landscape management globally. Various methods are used for obtaining the SWC data. Every method has some advantages and also disadvantages. Many of them are focused only on one dimension but modern precise agriculture needs the information about SWC in spatial scale. This study is focused on the spatial scale analysis of SWC in the Nitra river catchment for years 2013 and 2014. The HYDRUS 1D hydrological model and GIS tools were used for the creation maps of SWC. Combination of the measured and simulated data was used for the creation of the unique spatial maps of soil moisture in 0–30 and 30–60 cm soil horizons. Validation of our method shows trustworthy results. Soil water storage and fulfillment of maximum soil water storage were analysed with using the created maps.
personnel, users, and the organisation context. [Orfánus, 2005] also confirms that it is necessary to have spatial structured data for correct hydro-logical zonation of a landscape.
There are three main directions in the spatial soil moisture modelling. Topographic data, re-mote sensing data or terrestrial monitoring data can be used. [Kostka, 1994] or [Svetlitchnyi et al., 2003] published the research about search-ing the relation between soil moisture and topo -graphic properties of catchments. They tried to find a relevant correlation between SWC, eleva -tion, slopes, aspect, distance from rivers and soil properties. Both studies showed that this way of SWC determination has a potential. However, the conclusions of these studies were not clear. There is some relation between SWC and slope said [Kostka, 1994]. [Svetlitchnyi et al., 2003] said that every catchment has own characteris -tic and it is not possible to determine a universal dependence.
Another option to obtain spatial the SWC data is using the remote sensing technologies. Remote sensing is a well-known technology and is widely used for many reasons [Tischler et al., 2007]. In few recent years, a large step in the de -velopment of remote sensing technologies was made [NASA, 2010; Wardlow et al., 2012]. Re -mote sensing observations opened new possibili -ties in the soil water content in spatial scale. The increasing volume of satellite observations and data products has led the science community into the era of large data [Sellars et al., 2013] and pro-vided unique opportunities to develop advanced drought monitoring capabilities using multiple data sources [Aghakouchak et al., 2015].
It enables monitoring large areas in short time, but it has still some shortages for SWC determination. [Western et al., 2003] said that interpretation of the data from remote sensing is relatively difficult. There are also some prob -lems with vegetation and taking images of real soil surface. Essential question for SWC deter-mination by remote sensing is the depth which is able to be caught.
[Wilson et al., 2003] focused on remote sens-ing in this point of view. Remote senssens-ing is capa -ble of determine SWC only in surface zone of soil profile. For agricultural practice, the information about soil moisture in depth of 30 cm minimally, 60 cm ideally, is required. They tried to find some correlation between the SWC in depth of 0–6 cm and depth of 0–30 cm. Their results showed that
there is correlation indeed. This method can be used for successfully obtaining the SWC data from upper soil horizon.
Although remote sensing technologies made a significant progress, the best way to obtain the information about soil moisture content involves measurements and monitoring. The data from terrestrial measurements can be combined with well-known and tested models. This methodol -ogy with combination of measurements and mod -elling can be also used for spatial scale analysis of soil water content. It is important to develop this kind of methodologies due to possibility of verifying data from remote sensing.
MATERIAL AND METHODS
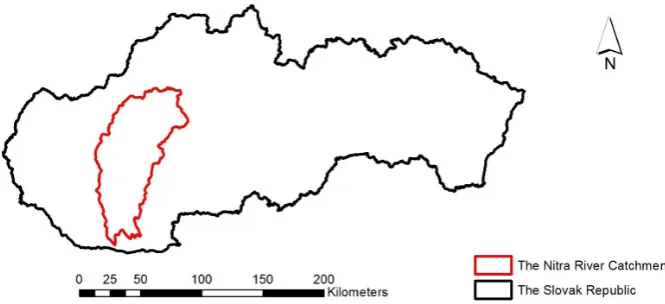
In this paper, the authors focused on the spatial scale analysis of SWC in agricultural soils of the Nitra River Catchment (Figure 1). The analysis was performed for years 2013 and 2014. The data from terrestrial monitoring was used. The spatial intensity of the measured data was not enough for spatial interpolation, so more modelled data was added. The GIS tools were used for the interpola -tion of measured and modelled point data to reach spatial information.
The Nitra river catchment is sub-catchment of the Váh river catchment. Its area is 5 080 sq km and the whole catchment area belongs to the Slovak Republic. It borders from north and west with the Váh river catchment. The Hron river catchment is at the east side. The Nitra river is more than 170 km long. The source of the river is located in southern slopes of Malá Fatra. It flows through Hornonitrianska hollow basin, be -tween Strážovské hills as well as Vtáčnik and Tribeč mountain chain. The stream continues to Podunajská highland where it forms Nitrian -ska bottom land all the way to join Váh river in Podunajská flat land.
Our catchment is mainly agricultural land (61% of the area) and forest land (30% of the area). There are Rendzic Leptosols in the north -ern part as well as Ch-ernozems, Mollic Fluvisols and Brown soils in the southern part of our catch -ment [Landscape Atlas of SR, 2019; Šimanský et al.; 2008; Horák et al., 2019].
of 6 meteorological and 25 hydrological obser-vation stations there. These stations are able to continuously measure the main meteorological and hydrological parameters and also transfer data on-line. The meteorological stations were set up to measure air temperature, air humid-ity, wind speed, wind direction, global radia -tion, precipita-tion, evapotranspiration and depth of soil freezing.
The hydrological stations measure soil mois-ture in 10 various depth of soil profile (10, 20, 30, 40, 50, 75, 100, 150, 200 and 250 cm). The 10HS sensors developed by Decagon Devices were used. These sensors are based on Frequency Domain Reflectometry method. The accuracy of 10HS sensors in mineral soils is ± 0.03 m3/m3 if
standard calibration equation is used [Decagon Devices, 2014].
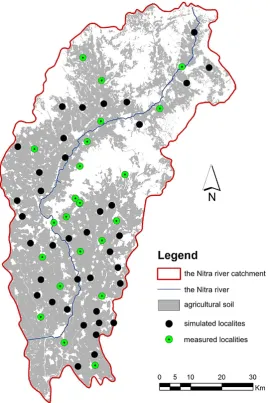
The soil samples were taken from 112 lo -calities in the catchment for determination of soil properties. The samples were analysed to obtain the retention curves of soil. Porousness, field capacity and wilting point was calculated from curves. The value for field capacity was estimated as 2.3 (200 cm w.c.) and for the wilting point was estimated as 4.18 (15 000 cm w.c.). The samples from the depth of 20 cm were taken for 0–30 cm horizon properties and from 40 cm depth for 30–60 cm soil horizon. The soil properties maps were prepared by means of GIS.
New 38 modelled localities were added to the measured localities to obtain more compact net of point data (Figure 2). The HYDRUS 1D model was used to simulate the soil moisture data for added localities. The HYDRUS 1D numerical model is widely used for simulating water flow and solute transport in variably satu -rated soils and groundwater. The HYDRUS 1D
software can be used to simulate such processes as precipitation, irrigation, infiltration, evapora -tion, transpira-tion, soil water storage, capillary rise, deep drainage and groundwater recharge [Šimunek et al., 2012]. This model is widely used for similar tasks as the ones considered in this paper by many authors all around the world [Burger-Látečka, 2005; Kaletová et al., 2012; Zeng et al., 2009].
Correlation coefficient and divergence with variance of 15% for three localities were computed for evaluation of the HYDRUS 1D model validity.
The authors used the GIS tools to interpolate the measured and modelled point data to reach spatial information. A kriging tool was used to spatial interpolation. This tool is often used by many authors, for example [15] or [16]. Saifa-deen and Gladnyeva [2012] stated that the krig-ing method has better precision for spatial inter-polation in the areas with distant point data. The resolution of output raster data is 200 m. The hydrolimit point values were estimated same as the soil moisture point values with the kriging method for its spatial interpretation for agricul-tural land of the Nitra river catchment.
One hydrological station (station Jelenec) was not included to interpolation in GIS. The data from this station was used to evaluate the ob -tained spatial data.
RESULTS AND DISCUSSION
The main outputs of this paper are the maps of soil water content in the agricultural soils of the Nitra river catchment. The method of terres-trial monitoring and model simulations combina-tion was used to create these maps.
The HYDRUS 1D model and also spatial interpolation in GIS were employed to assure validity of our outputs maps and steps of our methodology.
The correlation coefficients of the measured and simulated data from the HYDRUS 1D mod-el were between 0.67 and 0.95 [Tárník and Igaz, 2017]. Coefficient r = 0.60 to 0.79 is considered as a strong and r = 0.80 to 1.0 as a very strong relationship [Clay, 2008]. Divergence with vari -ance of 15% between measured and simulated data from the HYDRUS 1D model was between 79 to 100% [Tárník and Igaz, 2017].
It can be declared that the simulations car-ried out by HYDRUS 1D are valid due to the obtained correlation coefficient values. Many authors have research outputs about the HY-DRUS 1D model validity like the ones obtained. For example, [Haishen et al., 2009] reported that
the soil water content predicted with HYDRUS was found to be in good agreement with the ex -perimental measured data.
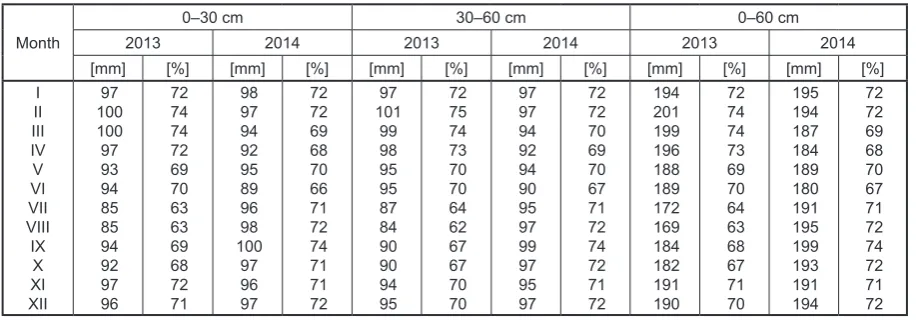
The correlation coefficient and divergence with variance of 15% were also computed to evaluate spatial interpolation validity for the Jelenec station. The measured data from Jele-nec station and output data from kriging were compared. The average monthly values were compared for years 2013 and 2014 (Table 1). The difference between the measured and sim -ulated data was less than 15% in 87.50% of comparison, 95.83% in deeper horizon, re -spectively. Correlation coefficient is also very significant, so the conducted spatial simula-tion can be declared valid and usable for the SWC analysis. Figure 3 shows running of soil moisture values obtained by measurements and simulations.
These maps (Figure 4) show the amount of soil water storage in two soil horizons for each month of year 2013 and 2014. The main advan-tage of the SWC maps is that every farmer or land owner can see the amount of SWC for his land estate. The localities with good or worse storage of soil water can be identified. Thus, the best crop for each locality can be choseb and take into account.
Using the knowledge of SWC, also other in -terpreted maps can be created, for example, the map of soil water availability for plants or map of soil water fulfillment. The necessary values of hydrolimits can be computed from soil map, which was created from the soil samples data. Table 2 shows storage of soil water in soil ho -rizons and fulfillment of maximum soil water storage.
Another benefit of our results is our verified methodology of SWC spatial analysis. Only the outputs from the HYDRUS model can be used for spatial interpolation. If the data from the same cli-mate scenario as HYDRUS model input it used, the SWC data for future can be obtained. A map of SWC for next decades can be created and the analysis of changes in SWC can be carried out.
CONCLUSION
The main aim of this paper was to obtain the information about SWC in a spatial scale. Soil water is crucial factor for the agricultural prac -tice. Scientists all over the world should pay at -tention to this task. The current situation needs to be analyzed and the measures for sustainable
a) b)
Figure 3. Comparison of measured and simulated values of soil moisture in the Jelenec station (a –0–30 cm soil horizon, b –30–60 cm soil horizon)
Table 1. Correlation of measured and simulated values of soil moisture in Jelenec station
Time period comparisonsCount of Count of comparisons with variance of 15% Count of comparisons with variance of 15% Correlation coefficient I. 2013
–
XII. 2014 24
20 cm 40 cm 20 cm 40 cm 20 cm 40 cm
21 23 87.50 95.83 0.71 0.79
Table 2. Soil water storage and fulfillment of maximum soil water storage
Month
0–30 cm 30–60 cm 0–60 cm
2013 2014 2013 2014 2013 2014
[mm] [%] [mm] [%] [mm] [%] [mm] [%] [mm] [%] [mm] [%]
Figure 4. Maps of soil water content in the Nitra river catchment [mm] (a – year 2013, 0–30 cm soil horizon; b – year 2013, 30–60 cm soil horizon; c – year 2014, 0–30 cm soil horizon; d – year 2014,
development agriculture under the climate change need to be sought. The knowledge about soil wa -ter content is essential for the research in the field of agriculture, horticulture, forestry, ecology, wa -ter management, hydrology, construction, waste management and other environmental sciences [Toková, 2019]. Soil drought has many negative effects on agricultural crops, ranging from the morphological to molecular levels [Kišš et al., 2019; Vitková et al., 2017].
The outputs of soil moisture simulation under various conditions obtained by modelling could be a good basis for landscape planning or as an interesting extension for the information systems about landscape [Muchová et al., 2016].
The created outputs maps should be a good supplement for various information systems re-lated to landscape, for example the OKTOPUS system [Leitmanová et al., 2013] under the condi -tions of Slovak Republic.
Many methods exist for soil moisture mea-suring or simulating, but they usually have the resolution of only one dimension. New technolo -gies are developing quickly (remote sensing, 3-D models) to obtain the spatial data about the water content in soils. This paper shows one of the pos -sible methodologies to obtain information about SWC in a spatial scale. The terrestrial measure-ments and model simulations were combined to create maps of SWC for agricultural soils in the Nitra river catchment. This method yielded trust-worthy outputs and possibilities for further devel -opment and conducting other analyses.
Acknowledgements
This study was supported by projects GA SPU 03-GASPU-2018 “Analysis of land use potential with respect to humidity regime in climate change conditions”; KEGA 019SPU-4/2017 “Upgrade of education process in the field of hydropedology with implementation of centre of excellence in the learning process” and KEGA 026SPU-4/2017 Inovative application of optic method in soil sci-ence: laser diffraction by soil texture analysis.
REFERENCES
1. Aghakouchak, A. et al., 2015. Remote sens-ing of drought: progress, challenges and op-portunitie. Rev. Geophys., 53, 452–480, doi: 10.1002/2014RG000456.
2. Burger, F., Látečka, M., 2005. Modelling and nu -merical simulationf of infiltration of irrigation water to porous medium. Acta Horticulturae et Regiotecturae.
3. Clay, H. 2008. Calculating and evaluating validity. Scottsdale: Holcomb Hathaway, Publishers. 4. Decagon devices. <http://www.decagon.com/prod
- ucts/soils/volumetric-water-content-sensors/10hs-soil-moisture-large-area-of-influence/ [Access: 2019–06–30].
5. Fuska, J. et al., 2014. Bottom topography mapping of water reservoirs and its practical application. Publishing House of the University of Agriculture in Krakow.
6. Haishen, L. et al., 2009. Comparison of measured and simulated water storage in dryland terraces of the loess plateau, China. Agricultural Water Man-agement, 96, 299–306.
7. Horák, J., Šimanský, V., Igaz, D. 2019. Biochar and biochar with N fertilizer impact on soil physi -cal properties in a silty loam haplic luvisol. Jour-nal of Ecological Engineering, 20(7), 31–38. doi. org/10.12911/22998993/109857.
8. Jurík, Ľ., Kaletová, T. 2014. The evaluation of soil water storage in a small catchment in 2009 and 2010. Acta Horticulturae et Regiotecturae, vol. 1, 1–4. 9. Kaletová, T. et al., 2012. Diagnostics of the soil
water regime based on complex soil survey. Acta Hydrologica Slovaca, 13(1), 28–37.
10. Kišš V., et al., 2019. Monitoring of the dendromet-ric changes influenced by soil water content. Jour -nal of Ecological Engineering, 20(1), 34–38, doi. org/10.12911/22998993/93939.
11. Kostka, Z. 1994. Study of soil moisture spatial dis-tribution in mountain catchment using GIS. http:// libraries.maine.edu/Spatial/gisweb/spatdb/egis/ eg94118.html
12. Landscape Atlas of the Slovak Republic. 2019. http:// geo.enviroportal.sk/atlassr/ [Access: 2019–05–25]. 13. Leitmanova, M., et al., 2013. Concept of informa -tion system for land consolida-tion projects. Acta Horticulturae et Regiotecturae, 16(2), 40–43, doi. org/10.2478/ahr-2013–0010.
14. Muchová, Z. et al., 2016. Possibilities of optimal land use as a consequence of lessons learned from land consolidation projects (Slovakia). Ecological Engineering, 90, 294–306.
15. NASA, 2010. Science plan for NASA’s science mis-sion directorate. Tech. Rep., National Aeronautics and Space Administration, Washington, D.C. 16. Orfánus, T. 2005. Spatial assessment of soil drought
17. Saifadeen, A., Gladnyeva, R. 2012. Modeling of solute transport in the unsaturated zone using HYDRUS-1D.
18. Sellars, S., et al., 2013. Computational Earth Sci-ence: Big Data Transformed into Insight, EOS Trans. AGU, 94(32), 277–278.
19. Svetlitchnyi, A.A. et al., 2003. Spatial distribution of soil moisture content within catchments and its modelling on the basis of topographic data. Journal of Hydrology, 277, 50–60.
20. Šimanský, V. et al., 2008. Soil tillage and fertiliza -tion of orthic luvisol and their influence on chemi -cal properties, soil structure stability and carbon distribution in water-stable macro-aggregates. Soil & Tillage Research, 100, 125–132. doi: 10.1016/j. still.2008.05.008.
21. Šimunek, J. et al., 2012. The HYDRUS-1D soft -ware package for simulating the one-dimensional movement of water. Heat and Multiple Solutes in Variably-Saturated Media. Riverside: University of California Riverside.
22. Tárník, A., Igaz, D., 2017. Validation of HYDRUS 1D model in selected catchment of Slovakia. Acta Horticulturae et Regiotecturae, 20(1), 24–27, doi. org/10.1515/ahr-2017–0006.
23. Toková, L., 2019. Using gravimetric method for soil
moisture determination. Veda mladých 2019 – Sci -ence of Youth, 14,(1), 122–130.
24. Tischler, M. et al., 2007. A GIS framework for sur -face-layer soil moisture estimation combining satel-lite radar measurements and land surface modeling with soil physical property estimation. Environmen -tal Modelling & Software, 22, 891–898.
25. Vitková, J. et al., 2017. Analysis of soil water con -tent and crop yield after biochar application in field conditions. Plant, Soil and Environment, 63, 569–573.
26. Wardlow, B., et al., 2012. Remote sensing of drought: Innovative monitoring approaches. CRC Press, pp. 484.
27. Western, A.W. et al., 2003. Spatial correlation of soil moisture in small catchments and its relationship to dominant spatial hydrological processes. Journal of Hydrology, 286, 113–134.
28. Wilson, D. J., et al., 2003. Spatial distribution of soil moisture over 6 and 30 cm depth, Mahurangi River Catchment, New Zealand. Journal of Hydrol -ogy, 276, 254–274.
![Figure 4. Maps of soil water content in the Nitra river catchment [mm] (a – year 2013, 0–30 cm soil horizon; b – year 2013, 30–60 cm soil horizon; c – year 2014, 0–30 cm soil horizon; d – year 2014, 30–60 cm soil horizon)](https://thumb-us.123doks.com/thumbv2/123dok_us/8369779.1674821/6.595.72.527.66.717/figure-content-nitra-catchment-horizon-horizon-horizon-horizon.webp)
