Dynamic Pool Segmentation Model and
Algorithm in the Car Rental Industry
Yazao Yang
School of Business Administration, South China University of Technology, Guangzhou 510640, China Email: [email protected]
Wenzhou Jin and Xiaoni Hao
Institute of ITS & Logistics, South China University of Technology, Guangzhou 510640, China Email: [email protected] [email protected]
Abstract— Pool segmentation is an essential step in the
logistics management process for large-scale car rental business. Its main function involves dynamic decisions about pools clustering and regional logistics management centers selecting, whose goal is to optimize fleet utilization and improve the logistics management efficiency. According to developing mode of car rental enterprises and layout of leasing sites, a three-tier structure is presented to describe the logistics management relations among each leasing sites. Based on the logistics operation characteristics and practical administration demand, a dynamic model and its algorithm are proposed for pool segmentation in the car rental industry. A case study shows that the proposed methodology is feasible and effective.
Index Terms— heuristic algorithm, pool segmentation, car
rental industry
I. INTRODUCTION
After the development of nearly one century, the revenue of car rental business per year has been up to one hundred billion US dollars, and it has become a significant role for the world economic development. By adopting two common patterns, car rental companies achieve their operation expansion. One is M&A (i.e., Merger and Acquisition) that need to input material and human resource; the other is concession that only needs to enhance management and cooperation.
At present, a number of international car rental giant have formed, such as Eurocar, Herz, Avis and so on, at the same time, the automobile rental industry also cultivate a great many local enterprises [1]. Along with the rapid development of the whole industry, leasing operation from remote places is increasing, and the car rental industry gradually unfolds a large-scale and networking trend. Information exchange between customers and leasing sites or site-to-site accomplished mainly by means of e-commerce.
In order to fit the operation mode and the practical requirements of consumption patterns, car rental companies usually maintain advantages in their price, site distributions, vehicle differentiation, management feature
and network efficiency, then they can possess stronger environmental adaptability and anti-risk ability, and enhance their market competitiveness and customer satisfaction. An example will help to explain this. Herz has about eight thousand leasing sites in more than one hundred fifty countries around the world, and its feature is short-term car rental for business travel and leisure.
Most of the important field operations are organized on a pool basis. In a pool, a group of leasing sites, each run by its own management, shares a fleet of cars [2]. It is particularly important to discuss the pool segmentation method, because operators usually need to adopt regional management to respond to changes in market demand and to ensure the efficiency of logistics management. In the actual operating process, the whole car rental network is divided into some relatively independent sub-districts, and cars to be leased are distributed to the corresponding rental sites in accordance with changes in market demand throughout the characteristics.
This paper aims at proposing a dynamic model for pool segmentation in the car rental industry, and a heuristic algorithm is given to solve practical problems. The main sections of this paper are organized as follows: the general structure of leasing network will be described in the next section. In Section III, the pool segmentation problem is introduced, followed by the method choice. In Section IV, mathematic model and its algorithm are proposed, and an example application is presented in Section V. Finally, the directions for future research and conclusions are provided in Section VI.
II. STRUCTURE OF LEASING NETWORK
Cars in service and rental revenue have come into being an approximately stable scale in US (see Fig. 1) due to the increasing competition and never-ending rate wars according to the Auto Rental News [3], so does other countries. The coverage of a car rental business may be a city, region or nation even over the world. Customers can rent or return cars at freewill site even crossing regional range, but leasing site management and actual logistics operation management should take a combination of central, regional and local control, in that case fleet can be dispatched optimally [4].
Manuscript received March 20, 2009; revised May 6, 2009, accepted June 15, 2009.
To fit the situation of local and improve the executive power, car rental companies often run their sites in the scope of a region or nation, which is based on the considerations of politics, culture difference among regions and staff management. Whereas the set up of pools sometimes needs to contain flexible provisions, which can break the limitations of administrative divisions and improve the efficiency of logistics management. Typically, a national rental network exhibits some hierarchical structure- e.g., by means of grouping stations in districts (pools), and districts in regions [5], then car rental companies can take the regional logistics mode based on pools.
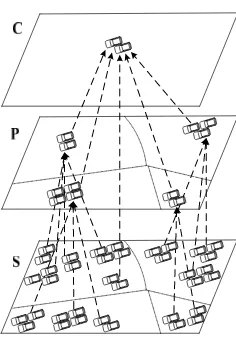
There is a central management site in the region or nation, which takes charge of dispatching cars among all leasing sites. Downward extending from the central site, other leasing sites are divided into several pools, and the lowest layer is leasing stations which directly face customers. Then, in this way, there will come into being a Center-Pool-Site Management Structure (CPSMS).
The Central management layer is on the top of this structure, which mainly presides over the scale and management scope of each pool. The middle layer is a pool management one, where will set a regional logistics center. The pool manager can decide the dispatching scheme of leasing cars by clients’ demand at each leasing site in a short cycle, which can improve utilization of the fleet and seek maximum revenue for company. In addition, regional logistics centers are also responsible for the dispersal of new cars (in-fleet) and the recall of old cars (out-fleet). The locations lie on the bottom of the structure, and site managers are responsible for the management of specific site, applying to offer high- quality service to customers, and provide the demand change for pool manager (see Fig. 2).
III. POOL SEGMENTATION A. Problem Description
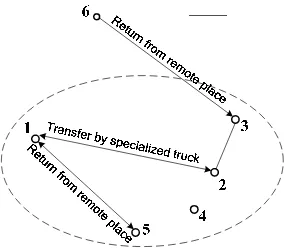
For a large-scale car rental company, fleet resource sharing problem can be solved by pool segmentation. Leasing sites in the same pool can share a fleet of cars in a certain period (a quarter or half a year), dispatching of vehicles among leasing sites are mainly realized through the specialized truck or return from remote places by clients naturally.
Pool segmentation can not only divide the particular operation region into smaller districts, as an appropriate number, but also can make a certain number of cars shared by all leasing sites in a pool for a planning period. To enhance the efficiency of dispatching cars among leasing sites, as a rule, a pool is the boundary. Fig. 3 indicates the logistics relations among leasing sites, where sites 1-5 belong to a pool, site 6 belongs to another pool. For the active dispatching mode (transfer cars by specialized truck, site 1 to 2), a certain pool will not communicate with other pools, and the fleet will be owned by itself, that is the exclusive management. However, companies can not prevent clients pick up or return cars from or to the sites in other pools, which will affect their service quality. That is the positive dispatching mode (return cars to leasing site by clients from remote places, site 6 to 3).
B. Objective and Effect
The objective of the pool segmentation problem is to group car rental locations into the minimum number of pools in such a manner that all locations (car leasing sites) clustered in a pool can share the same fleet of vehicles on a daily basis with low costs and short lead times required to transship vehicles between locations within the same pool [6]. Pool segmentation can improve resource allocation efficiency and reduce the logistics cost in the process of car transportation between leasing sites. On the one hand, it can escape excessive idle cars or shortage in some pools, on the other hand, it is helpful avoid adding management cost as a result of frequent changes of sites’ subjection relation.
Once there are shortages at some leasing sites, other sites in the same pool can make up timely. It is beneficial to business accounting for leasing corporations, by which corporations can achieve their aim on time. Consequently, pool operation is favorable to share the fleet resource.
The number of pools should been smaller, and in case the pool segmentation is accomplished, pools should not adjust in a short time. When there were great oscillations of market demand, adjacent pools need to be recombined, and replace some leasing sites to relieve contradiction, then region product supply can accomplish by pick load shifting.
1000 1200 1400 1600 1800 2000
2000 2002 2004 2006 2008 (Year) (Thousands)
15 17 19 21 23 25 (Billions) Cars in Service Rental Revenue
Figure 1. Statistics of car rental industry in US
Since fleet, a stock production to be rented, is a kind of perishable asset (One date on which the product or service becomes available or it ages) [7], there will be imbalance supply of resource in case no countermeasures for demand changes. The results of pool segmentation can determine the direction and number of a whole fleet from time and space.
C. Principle and Method Choice
Pool segmentation is a point set partition problem. By reason of an open market faced by the companies, which is independent of administrative divisions, pool segmentation mustn’t follow the apanage constraint condition, but should start from logistics management demand, and according to more practical principles, namely, convenient management for sites, low operation cost, high transportation efficiency, divide all leasing sites into various sub-blocks.
Scholars have discussed the pool segment problem by graph theory and column generation algorithm [6, 8], but these methods can not confirm how to find out the regional logistics centers, which is the middle layer in CPSMS.
The pool segmentation in the car rental industry is not very strict with time effectiveness, so time constraints can be ignored. P-median model is a kind of network location model, mainly for choosing logistics facilities from multiple nodes. The model is simple and practical, and it can cluster the sites into pools and find out the regional logistics management centers simultaneously.
IV. MATHEMATICS MODEL AND ALGORITHM A. P-median Model
Hakimi proposed the P-median model in 1964, and gave out a well-known vertex optimal property: there is at least one optimal solution formed by the network vertex in this problem. P-median model is mainly applied to solve how to choose n nodes from p service centers so as to get the minimum cost [9]. Here, cost is a generalized concept, which can be expense cost and time cost. In short, it can be measured by node distance matrix. We first introduce the appropriate nomenclature and then the formulation of the problem.
Basic hypothesis:
(1) The candidate service centers are known,
(2) Positions and demands can be estimated in advance,
(3) Transportation cost is proportional to the distance, (4) There are no restrictive conditions for time.
Parameters:
N: set of service objects, N = 1, 2,…, n hi: demand of service object i, i∈N
M: set of candidate service centers, M =1, 2,…, m dij: distance from i to j
v: conversion coefficient
p: total number of service centers Decision variables:
xj: if service object j is selected to be service center, xj =
1, else xj = 0
yij: if service object i is served by service center j, yij = 1,
else yij = 0
P-median model:
∑ ∑
∈ ∈=
N i j M
ij ij ivd y h
Z min (1)
Subject to
p x M j
j=
∑
∈
(2)
∑
∈
∈ =
M j
1 i N
yij (3)
M j N i x
yij− j≤0 ∈ , ∈ (4)
M j
xj∈{0,1} ∈ (5)
M j N i
yij∈{0,1} ∈ , ∈ (6)
The objective function (1) minimizes the total cost of transportation. Equation (2) insures that the number of selected service centers accord with predetermined requirement. Constraint (3) indicates that each service object has and only has one service center. Inequality (4) represents that there will be no corresponding service targets if no service centre in place. Constraints (5) and (6) limit the value range of decision variables.
B. Limiting Conditions
For a car rental network, all leasing sites are abstracted as nodes and compose the sets N, M and p. The candidate regional management centers set and number of regional management centers are determined in accordance with the node distribution and realistic environment.
Pool segmentation need to consider three important restrictions: (1) the maximum number of leasing sites within a pool, escaping nodes excess and difficult management; (2) distance limitation among leasing sites in the same pool, making sure that cars can get at any leasing site in a prescriptive dispatching cycle; (3) limitation of demand fluctuation range, avoiding a pool with an aggregate demand load exhibiting high spikes and low valleys [6].
C. Algorithm
find a service center for each service object (to confirm
yij).
At present, there are three kinds of algorithms: (1) precise algorithm, polynomial-time algorithm, is not simple for a practical problem; (2) heuristic algorithm, solve problems by the use of specific characteristics; (3) modern intelligence optimization algorithm, the interest of algorithm researchers. The first two algorithms mainly applied to small scale problems, and the third one applied to large-scale network optimization problems. Here, we adopt heuristic algorithm to solve pool segmentation problem, and provide the specific algorithm for dynamic problems as follows:
Step 1. Parameters setting and calculate:
(1) Calculate the distance among leasing sites, and get a matrix of order n;
(2) Determine the candidate regional management centers set M, and the number of regional management centers p;
(3) Set Smax, dmax, and Hmax, they are the maximum of leasing sites, the maximal distance among sites, and the maximal amplitude of demand in a pool.
Step 2. Let the number of current candidate regional management centers K=m, that is to select all candidate regional management centers.
Step 3. Assign each leasing site to the K candidate proximate regional management centers, let v=0.1, and then obtain the total transportation cost Z.
Step 4. If K=p, export the selected regional manage- ment center and assignment results of each leasing site, namely the initial pool segment result, go to Step 7, else go to Step 5.
Step 5. Take away a node from K candidate regional management centers, and assign it to other regional management centers, make sure the minimum increase of overall transportation cost.
Step 6. Delete the node from M, and let K=K-1, go to Step 4.
Step 7. Review each pool and site gradually:
(1) If the distance between leasing site and regional management center is more than dmax, take away the site
from pool;
(2) If the number of locations in a pool is more than
Smax, go to Step 1;
(3) If the demand amplitude per day is more than Hmax,
adjust locations among adjacent pools;
(4) The sites taken away will compose new pools, and the new pools must accord with three limiting conditions (1-3);
(5) Export the final results, stop.
From the algorithm above-mentioned, some locations will be taken away as three restrictions. There will no regional management centers for new pool because the size of new pool is too small, which can be solved by add regional management centers along with the operation scale enlarge. The algorithm will ensure that locations can be clustered fast, and the result is proper for car rental managers. See the following example.
V. EXAMPLE AND ANALYSIS
A. An Example in Florida
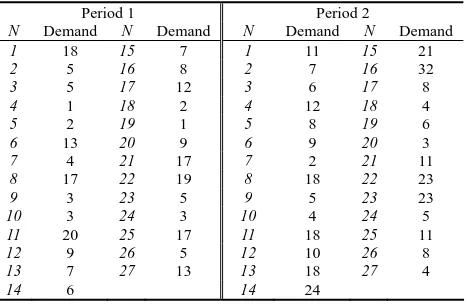
To explain the practicability of the proposed pool segment method, we select an example in Ref. [6, 8]. There are twenty seven leasing sites in the state of Florida (see Table I), namely N = 1, 2,…, 27. Let dmax = 55mile, Smax = 9, Hmax = 100veh/d (in units of demand per day).
According to the spatial distribution and agglomeration degree of locations, let the set of candidate regional management centers M = {2, 3, 8, 10, 11, 15, 16, 17, 21, 25, 26}, and Dij can be obtained from D (see Appendix
A).
Suppose the number of regional management centers p
= 6, and average demand of each leasing sites in two planning periods (the demand of sites changed in the second period because of market cultivation) are listed in Table II. Pools and regional management centers can generate by pool segmentation algorithm introduced in section IV. The pool segmentation results are as follows: Period 1:
Initial result: Z=820.95, P1={8}, P2={3, 4, 5, 13, 14, 15, 16, 27}, P3={2, 7, 9, 10, 11, 12, 17, 18, 19, 20, 23}, P4={21, 22}, P5={25}, P6={1, 6, 24, 26}.
Final result: P1={8}, P2={4, 5, 13, 14, 15, 16}, P3={9, 10, 11, 17, 18, 19, 20, 23}, P4={21}, P5={25}, P6={1, 24, 26}, P7={3, 27}, P8={2}, P9={7}, P10={12}, P11={22}, P12={6}.
Regional management centers: 15, 17, 26. Period 2:
TABLE I. FLORIDA CAR LEASING SITES
N Site name N Site name
1 Clearwater 15 Miami Beach
2 Daytona Beach 16 North Miami
3 Delray Beach 17 Orlando(1)
4 Ft Lauderdale 18 Orlando Int’l
5 Ft Lauderdale Int’l 19 Orlando(3)
6 Ft Myers 20 Orlando(4)
7 Jacksonville 21 Panama City
8 Key West 22 Pensacola
9 Kissimmee(1) 23 Sanford
10 Kissimmee(2) 24 Sarasota
11 Lake Buena Vista 25 Tallahassee
12 Melbourne 26 Tampa
13 Miami Seaport 27 West Palm Beach
14 Miami Int’l
TABLE II.
DEMAND OF LEASING SITES IN TWO PERIODS (UNITS: VED/D)
Period 1 Period 2
N Demand N Demand N Demand N Demand
1 18 15 7 1 11 15 21
2 5 16 8 2 7 16 32
3 5 17 12 3 6 17 8
4 1 18 2 4 12 18 4
5 2 19 1 5 8 19 6
6 13 20 9 6 9 20 3
7 4 21 17 7 2 21 11
8 17 22 19 8 18 22 23
9 3 23 5 9 5 23 23
10 3 24 3 10 4 24 5
11 20 25 17 11 18 25 11
12 9 26 5 12 10 26 8
13 7 27 13 13 18 27 4
Initial result: Z=918.68, P1={8}, P2={3, 4, 5, 13, 14, 15, 16, 27}, P3={2, 7, 9, 10, 11, 12, 17, 18, 19, 20, 23}, P4={21, 22}, P5={25}, P6={1, 6, 24, 26}.
Final result: P1={8}, P2={13, 14, 15, 16}, P3={9, 10, 11, 17, 18, 19, 20, 23}, P4={21}, P5={25}, P6={1, 24, 26}, P7={3, 4, 5, 27}, P8={2}, P9={7}, P10={12}, P11={22}, P12= {6}.
Regional management centers: 3, 16, 17, 26.
There are differences between two pool segmentation results. The result of the first period is the same to Ref. [6, 8], whereas locations 3, 4 and 5 are allocated to another pool and a new regional management center 3 is selected in the second period. Because the total average demand per day in pool 2 is 121, which is larger than Hmax. B. Analysis
In order to prove the effectiveness of the dynamic pool segmentation model and algorithm proposed, we carry out the sensitivity analysis from four aspects. Assumed that the other conditions keep invariable basically, when one condition changes.
(1) Demand fluctuation
Assumed that the demand of leasing sites fluctuate as a result of seasonal variation. The new demand is in Table III. Let the parameter Hmax = 100ved/d in scenario 1 and
150ved/d in scenario 2, then the pool segmentation results are as follows:
Scenario 1:
Initial result: Z=1133, P1={8}, P2={3, 4, 5, 13, 14, 15, 16, 27}, P3={2, 7, 9, 10, 11, 12, 17, 18, 19, 20, 23}, P4={21, 22}, P5={25}, P6={1, 6, 24, 26}.
Final result: P1={8}, P2={3, 4, 5, 13, 14, 15, 16}, P3={9, 10, 11, 17, 18, 19, 20}, P4={21}, P5={25}, P6={1, 24, 26}, P7={2, 23}, P8={6}, P9={7}, P10={12}, P11={22}, P12={27}.
Regional management centers: 16, 17, 26. Scenario 2:
Initial result: Z=1396, P1={3, 4, 5, 27}, P2={8}, P3={13, 14, 15, 16}, P4={2, 7, 9, 10, 11, 12, 17, 18, 19, 20, 23}, P5={21, 22, 25}, P6={1, 6, 24, 26}.
Final result: P1={3, 4, 5, 27}, P2={8}, P3={13, 14, 15, 16}, P4={9, 10, 17, 18, 19, 20}, P5={21}, P6={1, 24, 26}, P7={2, 23}, P8={6}, P9={7}, P10={11}, P11={12}, P12={22}, P13={25}.
Regional management centers: 3, 15, 17, 26.
Differences between the two results are mainly due to over-demand in some pools, then the total number of pools may add and some sites need to be arranged in adjacent pools. This phenomenon is similar to the two periods in part A of this section.
(2) Change of p
Suppose the number of regional management centers p
= 6 and 8, then there will be some differences between these two cases. Some sites are adjusted to other pools, which have discussed in Ref. [10].
(3) New sites adding
With the emergence of new demand and expansion of operation scale, market cultivation will obtain harvest, and the brand effect will also play its role at this time. Car rental company can set up some new leasing sites to
widen its service area and allocate some news cars in the fleet, which can not merely satisfy existing demand, but also induce potential demand.
At this point, the layout of leasing sites changed, and pool segmentation should be properly adjusted to make better use of existing fleet resources and management system.
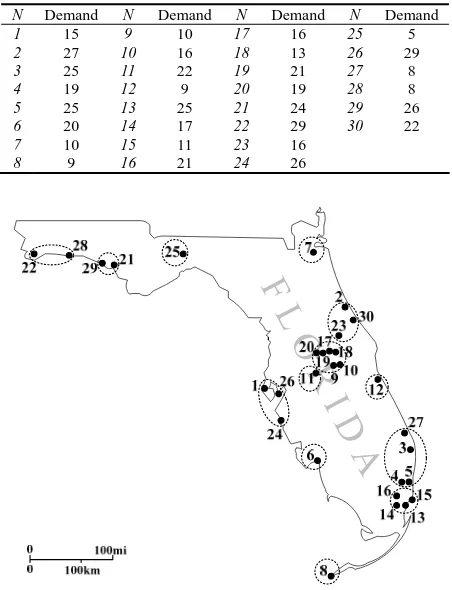
For example, 28 (Fort Walton Beach), 29 (Panama City Beach), 30 (Port Orange) are three new leasing sites in the state of Florida. Note that the demand of sites list in Table IV, and other conditions keep invariable. New result can be obtained by adopting the dynamic pool segmentation model and algorithm while remaining three limiting conditions, see Fig. 4.
TABLE III.
NEW DEMAND OF LEASING SITES (UNITS: VED/D)
Scenario 1 Scenario 2
N Demand N Demand N Demand N Demand
1 3 15 7 1 28 15 40
2 14 16 11 2 15 16 41
3 8 17 15 3 43 17 34
4 17 18 6 4 17 18 10
5 17 19 17 5 34 19 14
6 12 20 11 6 3 20 31
7 10 21 7 7 18 21 27
8 18 22 14 8 25 22 3
9 16 23 11 9 22 23 4
10 13 24 9 10 28 24 14
11 16 25 14 11 31 25 20
12 13 26 12 12 6 26 24
13 7 27 16 13 45 27 45
14 6 14 38
Figure 4. Pool segmentation result in Florida TABLE IV.
DEMAND OF SITES INCLUDING THREE NEW ONE (UNITS: VED/D)
N Demand N Demand N Demand N Demand
1 15 9 10 17 16 25 5
2 27 10 16 18 13 26 29
3 25 11 22 19 21 27 8
4 19 12 9 20 19 28 8
5 25 13 25 21 24 29 26
6 20 14 17 22 29 30 22
7 10 15 11 23 16
(4) Limiting conditions change
There are three restrictions for pool segmentation, namely, the maximum of leasing sites Smax, the maximal
distance among sites dmax, and the maximal amplitude of
demand in a pool Hmax. They are important references to
pool segmentation, and decided by actual circumstance and management capability. Pool partition results maybe change when the restrictions change. However, the changing cannot affect partition configuration, in other words, leasing sites having agglomeration characters will be arranged in the same pool or adjacent pools all the same. This point has been confirmed above.
VI. CONCLUSIONS
Pool segmentation in the car rental industry is in itself a crucial topic for leasing company in their logistics management process. Proper discussion on the structure
of leasing network is helpful to find out a simple way in solving the pool segmentation problem.
Here the following conclusions could be drawn:
(1) The dynamic pool segmentation model and algorithm is more effective than graph theory and column generation algorithm, because it can cluster sites and select regional management centers simultaneously.
(2) Owing to the circumstance changing and other factors, pool segmentation results maybe not the same. However, the partition configuration of the whole rental network will not be affected.
(3) The methodology proposed is effective when the operation scale of car rental company enlarged.
(4) Restrictions of pool segmentation are not accordant with actual exactly, which should be considered in the future research.
APPENDIX A DISTANCES AMONG SITES AND CANDIDATE REGIONAL MANAGEMENT CENTERS (UNITS: MILE)
Dij 2 3 8 10 11 15 16 17 21 25 26
1 154.2 282.2 418 87.5 86.1 277.7 268.8 91.2 407 297.5 13.6
2 0 215.8 423.7 77.7 74.2 269.2 260.6 65.7 373.7 264.1 141.9
3 215.8 0 209.9 179.9 203.8 55.4 46.8 199.3 579.6 470 271.6
4 244 30.2 185.3 208.4 232.4 30.9 22.3 227.8 595.8 498.6 266.3
5 241.5 27.9 187.6 205.9 229.8 33.2 24.5 225.3 605.6 496 268.8
6 271.9 173.2 300.8 205.1 203.7 160.5 151.6 208.9 530.3 420.8 150.3
7 104.6 310.5 518.8 172.8 169.2 364.3 355.7 160.8 289.2 179.6 237
8 423.7 209.9 0 388.2 412.1 164.5 174.9 407.5 787.8 678.3 427.4
9 77.7 207.4 415.6 11.2 9.8 260.7 252.1 15 387.2 277.6 69.4
10 77.7 179.9 388.2 0 10.9 234.3 225.7 14.8 387 277.4 75.7
11 74.2 203.8 412.1 10.9 0 260.2 251.5 14.4 386.6 277.1 71.7
12 95.6 129.4 337.7 86.9 86.5 184.2 175.5 75.6 455.9 346.3 147.9
13 266.3 52.5 157.4 231.4 257.3 5.5 17.8 250.6 630.9 521.4 283.6
14 264.4 50.6 159.7 229.4 255.3 9.1 15.9 248.8 629 519.5 277.5
15 269.2 55.4 164.5 234.3 260.2 0 20.1 252.9 633.2 523.7 285.9
16 260.6 46.8 174.9 225.7 251.5 20.1 0 246.9 627.2 517.6 278.2
17 65.7 199.3 407.5 14.8 14.4 252.9 246.9 0 377.1 267.6 77.3
18 65 186.9 395.2 26.6 26.3 240.5 234.5 18.9 385.1 275.8 89.7
19 65.7 199.3 407.5 14.8 14.4 252.9 246.9 3.8 375.1 265.6 78.9
20 65.7 199.3 407.5 14.8 14.4 252.9 246.9 3.3 372.5 263 79.4
21 373.7 579.6 787.8 387 386.6 633.2 627.2 377.1 0 123.3 394.4
22 446.1 652 860.3 459.4 459.1 705.6 699.6 449.5 107.7 193.8 464.9
23 49.5 205.7 414 44 43.7 259.3 253.3 34.2 395.8 286.8 108.7
24 183.2 239 377.5 116.9 112.9 236.9 228.3 118.5 440.8 331.8 51.5
25 264.1 470 678.3 277.4 277.1 523.7 517.6 267.6 123.3 0 284.5
26 141.9 271.6 427.4 75.7 71.7 285.9 278.2 77.3 394.4 284.5 0
27 202 16.3 224.6 167 192.9 70 63.9 181.9 565.9 456 257.5
28 418.3 598.2 805.8 430.2 428.9 649.1 638.9 422.1 62.4 170.1 440.3
29 381.8 562.3 767.2 396.1 389.8 610.5 600.9 387.2 10.4 107.4 400.3
30 5.6 209.2 409.2 70.5 66.6 253.3 244.4 49.6 373.2 256.4 136.2
ACKNOWLEDGMENT
It is a pleasure for the author to acknowledge the discussions that he had with Dr. Yu who also read the manuscript and suggested improvements. This work was supported in part by a research grant from Chinese National Programs for High Technology Research and Development (Project No: 2007AA11Z201).
REFERENCES
[1] Yazao Y, Wenzhou J, Xiaoni H. Car rental logistics problem: A review of literature. IEEE International
Conference on Service Operations and Logistics, and Informatics, 2008, pp. 2815-2819.
[2] Edelstein M, Melnyk M. The pool control system. Interfaces, 1977, 8(1): pp. 21-36.
[3] http://www.fleet-central.com/arn/t_inside.cfm?action=stati stics.
[4] Carroll WJ, Grimes RC. Evolutionary Change in Product Management: Experiences in the Car Rental Industry. Interfaces, 1995, 25(5): pp. 84-104.
[5] Fink A, Reiners T. Modeling and solving the short-term car rental logistics problem. Transportation Research Part E: Logistics and Transportation Review, 2006, 42(4): pp. 272-292.
[7] Weatherford LR, Bodily SE. A Taxonomy and Research Overview of Perishable-Asset Revenue Management: Yield Management, Overbooking, and Pricing. Operations Research, 1992, 40(5): pp. 831-844.
[8] Julian EP. Strategic and tactical fleet planning for the car rental industry, University of Miami, 2000.
[9] Hakimi SL. Optimum locations of switching centers and the absolute centers and medians of a graph. Operations Research, 1964, 12(3): pp. 450-459.
[10]Yazao Y, Wenzhou J, Xiaoni H. A Pool Segmentation Method for Car Rental Industry. Modelling, Simulation and Optimization, International Workshop on WMSO, 2008, pp. 464-467.
Yazao Yang Datong, China, February 2nd, 1981
B.S. in traffic engineering, College of Traffic, HoHai University, Nanjing, China, 2005
A postgraduate in Transportation planning and management, School of civil engineering and traffic, South China University of Technology, Guangzhou, China, 2005-2006
At present, he is a Ph.D. candidate at the school of business administration in South China University of Technology, and his specialty is Logistics engineering and management. He has taken part in some international academic conferences, and published in their proceedings (1. An urban motor vehicle inventory forecasting method. Proceedings of the 2007 Conference on Systems Science, Management Science and System Dynamics: Sustainable Development and Complex Systems, 2007, pp. 2633-2639. 2. Car rental logistics problem: A review of literature. IEEE International Conference on Service Operations and Logistics, and Informatics, 2008, pp. 2815-2819.). His current research interests include logistics management, stochastic and dynamic optimization, traffic planning and design.
Wenzhou Jin Siping, China, August 22nd, 1960
Ph.D. in transportation management engineering, School of Transportation, Jilin University of Technology, Jilin, China, 1994
M.S. in probability and statistical analysis, School of science, Jilin University, Jilin, China, 1985
B.S. in applied mathematics, School of science, Jilin University, Jilin, China, 1982
He is the chief engineer in Institute of ITS & Logistics at the South China University of Technology. He has extensive experience in the transportation and logistics management, and has published about fifty articles in academic and industry journals. His teaching, research and consulting interests include urban traffic, logistics management, transportation policy and management.
Prof. Jin is an expert of Guangzhou Smooth Traffic Project, and editor of some academic journals. As a major member in the project network of highway and water transportation, he won the third honor of “Science and Technology Advancement Prize” awarded by the Ministry of Science and Technology of the P.R.C. in 1996.
Xiaoni Hao Baoji, China, September 24th, 1977
M.S. in traffic planning, School of Highway, Chang’an University, Xi’an, China, 1996 B.S. in transportation planning and management, School of Highway, Chang’an University, Xi’an, China, 1999