Mathematical and Computational
Forestry & Natural-Resource Sciences Last Correction: Aug. 28, 2009
MODELING CARIBBEAN TREE STEM DIAMETERS FROM
TREE HEIGHT AND CROWN WIDTH MEASUREMENTS
Thomas J. Brandeis
1, KaDonna C. Randolph
2, Mike R. Strub
31Res. Forester,22Math. Statistician, FIA SRS USDA FS, Knoxville, TN 37919 USA, Ph./FAX: (865)862-2030/0262
3Forest Biometrician, Weyerhaeuser Company, Hot Springs, AR 71902, Ph./FAX: (501)6248504/8505
Abstract. Regression models to predict diameter at breast height (DBH) as a function of tree height
and maximum crown radius were developed for Caribbean forests based on data collected by the U.S. Forest Service in the Commonwealth of Puerto Rico and Territory of the U.S. Virgin Islands. The model predicting DBH from tree height fit reasonably well (R2 = 0.7110), with strongest in subtropical moist and wet forest. The model predicting DBH from crown radius fit the data poorly (R2 = 0.2876), but improvements were made when the model was fit by forest life zone and crown radius measurement protocol. Models fit with both maximum crown radius and tree height had R-square values that ranged from 0.1803 for the subtropical dry forest to 0.8018 for the subtropical moist forest life zone where crown radius was measured with urban forest inventory protocols. Tree heights had stronger correlations with DBH than did crown radius, perhaps due to difficulties in measuring tree crown width or natural variability in this hurricane-disturbed environment. Models that use tree height have some potential for predicting DBH for use in Caribbean forest biomass and carbon estimation models, but the potential for error propagation by using DBH predicted from crown radius is too great to earn our recommendation for such applications.
Keywords:Allometric models; secondary forest; Puerto Rico; U.S. Virgin Islands
1
Introduction
Understanding regional and global forest biogeochem-ical cycles so that informed decisions can be made re-garding their management requires accurate estimates of forest structure, biomass and carbon over landscape or larger scales. Direct measurements of forest structure are taken on intensively sampled, relatively small field plots, and these data are used to create allometric mod-els that predict forest parameters like volume, biomass and carbon from easily measured tree attributes. This allows for the expansion of these estimates over greater expanses of forest. Diameter at breast height (DBH) is commonly used as a predictor of other tree metrics in a wide variety of allometric equations. Numerous tree biomass equations use DBH as a predictor variable, with notable examples developed for subtropical and tropical forests [1, 2].
Installation of enough field sampling plots to obtain adequate numbers of DBH measurements is sometimes too costly or difficult in rough terrain or areas that are difficult to access on the ground (e.g. periodic flooding, dense vegetation, etc.), conditions often found in the
hu-mid tropics. Estimating DBH from tree metrics that can be measured remotely facilitates landscape and regional scale biomass and carbon estimation. In an early ex-ample of this approach, Perez [3] modeled DBH from crown widths measured on aerial photographs in Puerto Rico, Dominica and Thailand. More recent efforts have focused on measuring individual tree heights using lidar data [4-6] or crown widths from high resolution aerial [7] and satellite imagery [8, 9], then using the modeled DBH to estimate total-tree biomass and carbon.
The objective of this study was to develop models to predict tree DBH from tree height and crown radius measurements for Caribbean forest Holdridge life zones [sensu 10] (subtropical dry, subtropical moist, subtropi-cal wet/rain and lower montane) and mangrove forests. The goal was to find models that use variables derived from remotely-sensed data and that would be suitable for estimating tree metrics needed to calculate forest biomass and carbon.
2
Methods
2.1 Study area and forest inventoriesThe tree measurements came from two sources: U.S. Forest Ser-vice Forest Inventory and Analysis (FIA) forest inven-tory plots measured in 1980, 1990, and from 2001 to 2004 on the islands of Puerto Rico, Vieques and Culebra in the Commonwealth of Puerto Rico, and on the islands of St. Croix, St. John, and St. Thomas in the Territory of the U.S. Virgin Islands; and U.S. Forest Service Ur-ban Forest Effects (UFORE) inventory plots measured in 2002 in the San Juan Bay Estuary watershed in San Juan, Puerto Rico. The trees measured in FIA plots were in closed canopy stands while those measured on UFORE plots ranged from closed-canopy forest patches to open-grown street and yard trees.
Tree DBH was measured at 1.4 m for all trees with DBH ≥2.5 cm on both FIA and UFORE plots. On all plots, total tree height (HT) measurements were taken to the top of the live crown on all live trees with DBH≥2.5 cm using a combination of clinometers, Hagloff Vertex III hypsometers, and measurement tapes. Two different protocols, however, were used to measure crown width. On the FIA plots, crown width was recorded to the near-est one-tenth meter by two measurements: longnear-est ra-dius (RLONG) from the bole to drip line and shortest radius (RSHORT) from the bole to drip line, for each live tree with DBH≥12.5 cm [for additional tree measure-ment details see 11]. Crown width on UFORE plots was recorded to the nearest one-tenth meter on trees with DBH ≥ 12.5 cm by two measurements: North-South (D1) and East-West (D2) widths, drip line to drip line, along the bole [for additional tree measurement details see 12]. In order to make the two datasets as compati-ble as possicompati-ble for combined modeling, maximum crown radius (RMAX) was calculated for each set of trees. For the trees measured on the FIA plots, RMAX = RLONG. For the trees measured on the UFORE plots,
RMAX = max(D1/2, D2/2) (1)
Calculation of RMAX for the UFORE trees assumes that the midpoints of the crown diameters intersect the tree bole. A test of hypothesis H0: D1= D2was not rejected (p-value = 0.4014) indicating no directional bias, that is, the North-South crown widths were not longer or shorter on average than the East-West widths.
2.2 Model fitting A linear model form was selected for modeling DBH from the predictor variables HT and RMAX:
DBH = b0 + b1 X1+ b2 X2 + . . . + bn Xn (2) We fit models with HT and RMAX separately, as well as models with both predictor variables together. Ad-ditionally, we fit these models by Holdridge life zone to
further refine the models with ancillary information that would be commonly available. We used plot center co-ordinates to extract the Holdridge life zone of each plot from a digitized version of the map that appears in Ewel and Whitmore [10].
Tree DBH and height data were taken from forest in-ventories conducted in 1980, 1990, and from 2001 to 2004. Only the first measurement of trees that had been measured repeatedly was kept in the dataset. Trees in the Caribbean frequently experience crown and stem damage from hurricanes, and hurricanes Georges (1989) and Hugo (1998) severely damaged forests in Puerto Rico and the U.S. Virgin Islands during the data col-lection period. We chose to remove trees with damaged stems, tops, or branches noted by the field crew, as op-posed to retaining these trees as done in Kenefic and Ny-land [13]. Additionally, mean height to diameter ratios were calculated for each tree species. Trees with height to diameter ratios exceeding the mean plus 2 standard deviations were flagged as potential outliers. After fur-ther examination of potential outliers in scatter plots, a total of 965 trees were excluded from the data set used to model DBH from HT.
After the initial model fitting, scatter plots of the residuals were generated. Distribution of the residuals indicated the possible need for a natural log transforma-tion of both HT and DBH [pages 541-544 in 14]. Since it is well known that the logarithmic transformation re-sults in biased estimates, both transformed and untrans-formed models were fit to the data. The SAS procedure REG was used to fit the final model of form:
ln (DBH) =b0+b1ln (HT) (2)
or equivalently,
DBH =eb0∗Hb1
T (3)
To fit models that predict DBH from crown widths, trees from both the FIA and UFORE plots were included, but the data set was limited to trees most visible in overhead images, that is, trees in the open-grown, dominant, and co-dominant crown classes. After the initial model fit-ting, scatter plots of the residuals were generated. From these plots, thirteen observations were identified as out-liers and subsequently removed from the dataset before the final models were fitted. Note that crown width mea-surements were made on only a subset of forest inventory plots measured in 2001 to 2004, so this data set is much smaller than the data set used to model DBH from HT. As previously described, the scatter plots of the residuals resulting from initial model fitting indicated the need for a natural log transformation of both RMAX and DBH. The SAS procedure REG was used to fit the final model of form:
or equivalently,
DBH=eb0∗Rb1
MAX (5)
We then fit models with both HT and RMAX as pre-dictor variables. This data set was slightly reduced due to missing tree heights for some trees with crown width measurements.
ln (DBH) =b0+b1ln (HT) +b2ln(RMAX) (6)
or equivalently,
DBH=eb0∗Hb1
T ∗RbMAX2 (7)
3
Results
A total of 13,764 tree measurements taken on FIA plots in all forested life zones found on the islands were used for modeling DBH with HT (table 1) and 2,739 tree measurements (2,552 forest trees across all life zones and 363 urban inventory trees from the subtropical moist forest life zone only) were used for modeling DBH with RMAX (table 2).
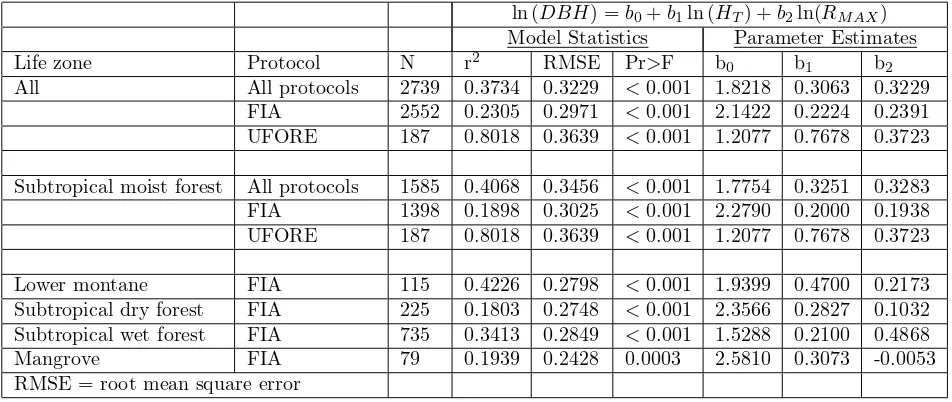
3.1 Models to predict DBH from tree height and crown radius All models predicting DBH from HT (table 3), RMAX (table 4), and HT with RMAX (ta-ble 5) overall and by Holdridge forest life zone were sig-nificant at the 0.05 alpha level. Variation explained by the model with HT as the sole predictor variable ex-ceeded 71% (R2= 0.7110), and was highest for subtropi-cal wet forest (R2= 0.7263) and lowest for lower montane forests (R2= 0.3643) (table 3).
Models with RMAX as the sole predictor variable plained less variation in DBH (table 4). Variation ex-plained by the model was highest for the lower mon-tane life zone (R2= 0.4398 for models with R
MAX alone
and 0.4226 for models with RMAX and HT) and lowest for the subtropical dry forest (R2= 0.1575 and 0.1803). Results indicated that improvements to the subtropical moist forest model, the only life zone with both FIA and UFORE plots, might be possible if fit by crown width measurement protocol. Indeed this was the case as R2 for the subtropical moist forest UFORE trees improved to 0.7741 from 0.1466 (table 4). The addition of HT to the RMAX models, however, had little effect on their predictive ability (table 5).
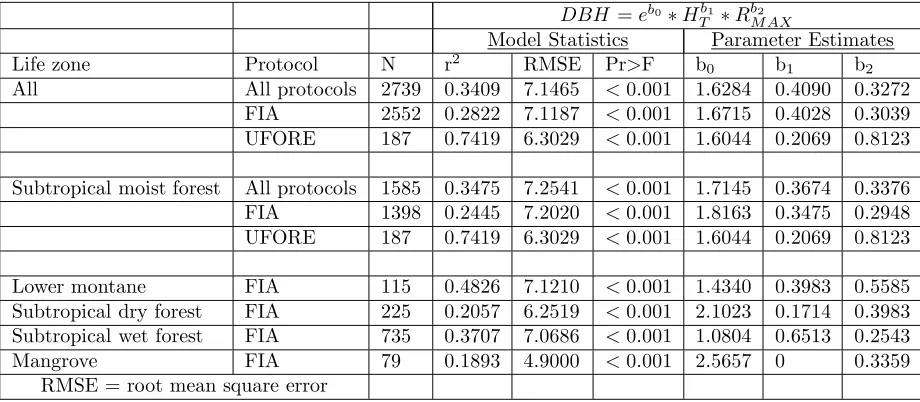
The untransformed model 5b was fit to the data used for model 5a fits. Results (table 6) indicated that all pa-rameter estimates were significantly different from zero with the exception of the height exponent (b1) for the Mangrove life zone and the FIA protocol. That equation was refit with the height exponent set to zero. Max-imum crown radius (RMAX) was replaced with crown
area in an attempt to improve model fits, but the re-sulting fit statistics did not indicate consistent improve-ment over using RMAX. Total tree height (HT) was re-placed with height above DBH (HT-1.37) in an attempt to improve estimates of trees just above DBH but again improvement in fit statistics did not warrant modifying the model.
4
Discussion
Many studies have explored the relationship between HT and DBH [thoroughly reviewed in 15, 16, 17] with the objective of predicting the harder to measure HT met-ric from the more easily obtained DBH measurement. Although much of this work has focused on coniferous species, temperate and tropical broadleaf trees also have shown strong HT and DBH correlations [13, 18, 19] de-spite their more variable branching patterns and growth forms.
Results of these previous studies show that our mod-els predicting DBH from HT for Caribbean trees growing in the subtropical moist and subtropical wet forest life zones are of slightly poorer fit than the norm in temper-ate and tropical hardwood forests, but they still could be used with an understanding of their limitations. Our models for subtropical dry, subtropical lower montane, and mangrove forests, however, are of marginal utility. Variation in DBH explained by HT was lowest in the subtropical lower montane forest life zone and mangrove forest type. Tree sample size was substantially reduced in these areas. The systematic forest inventory placed few plots in the small, high elevation montane forests and narrow, coastal bands of mangrove forest. Also, the variety of forest types and growth forms within the mon-tane forests, ranging from palms forests to elfin wood-lands, complicated fitting of a single model for that life zone.
(Mar-Table 1: Ranges of the data used to fit Equation 3 by Holdridge life zone.
DBH Height, total
Life zone N Mean Max. Min. Mean Max. Min.
- - - cm - - - - m
-All 13764 12.5 108.6 2.5 8.3 40.0 1.5
Subtropical dry forest 1133 7.4 66.8 2.5 5.5 19.0 1.7 Subtropical moist forest 8829 11.9 105.0 2.5 8.1 37.0 1.5 Subtropical wet forest 3428 15.2 37.0 2.5 9.7 40.0 1.5
Lower montane 286 15.7 69.4 2.5 8.1 22.2 2.0
Mangrove 88 14.9 33.0 2.5 9.8 17.0 2.4
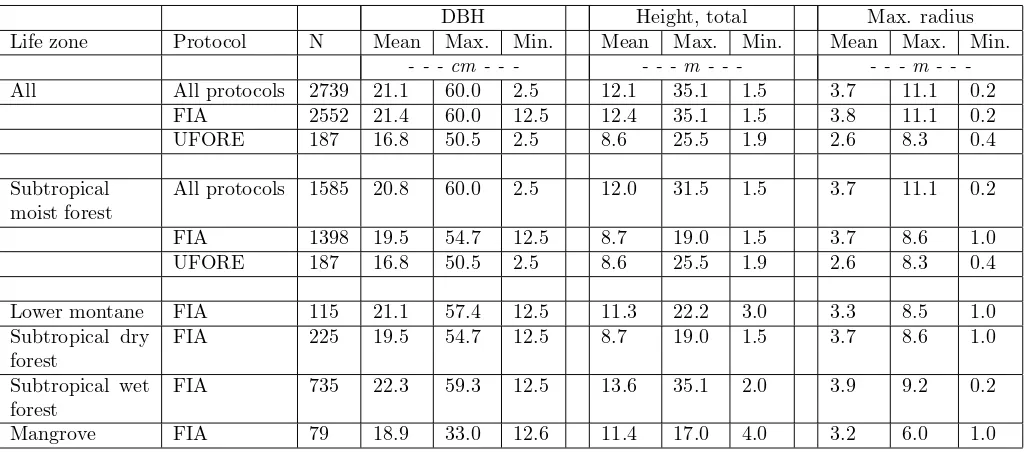
Table 2: Ranges of the data used to fit Equations 4 and 5 by Holdridge life zone and measurement protocol.
DBH Height, total Max. radius
Life zone Protocol N Mean Max. Min. Mean Max. Min. Mean Max. Min.
- - - cm - - - - - - m - - - m
-All All protocols 2739 21.1 60.0 2.5 12.1 35.1 1.5 3.7 11.1 0.2 FIA 2552 21.4 60.0 12.5 12.4 35.1 1.5 3.8 11.1 0.2
UFORE 187 16.8 50.5 2.5 8.6 25.5 1.9 2.6 8.3 0.4
Subtropical moist forest
All protocols 1585 20.8 60.0 2.5 12.0 31.5 1.5 3.7 11.1 0.2
FIA 1398 19.5 54.7 12.5 8.7 19.0 1.5 3.7 8.6 1.0
UFORE 187 16.8 50.5 2.5 8.6 25.5 1.9 2.6 8.3 0.4
Lower montane FIA 115 21.1 57.4 12.5 11.3 22.2 3.0 3.3 8.5 1.0 Subtropical dry
forest
FIA 225 19.5 54.7 12.5 8.7 19.0 1.5 3.7 8.6 1.0
Subtropical wet forest
FIA 735 22.3 59.3 12.5 13.6 35.1 2.0 3.9 9.2 0.2
Mangrove FIA 79 18.9 33.0 12.6 11.4 17.0 4.0 3.2 6.0 1.0
Table 3: Model statistics and parameter estimates from DBH prediction Equation 3a by Holdridge life zone. ln (DBH) =b0+b1ln (HT)
Model Statistics Parameter Estimates
Life zone N r2 RMSE Pr>F b
0 b1
Table 4: Model statistics and parameter estimates from DBH prediction Equation 4a by Holdridge life zone and tree measurement protocol.
ln (DBH) =b0+b1ln (RMAX)
Model Statistics Parameter Estimates
Life zone Protocol N r2 RMSE Pr>F b0 b1
All All protocols 2791 0.2876 0.3699 <0.001 2.4071 0.4720 FIA 2600 0.1796 0.3392 <0.001 2.5853 0.3410 UFORE 191 0.7741 0.4023 <0.001 1.7215 1.0655
Subtropical moist forest All protocols 1609 0.3183 0.3879 <0.001 2.3706 0.4945 FIA 1418 0.1466 0.3337 <0.001 2.6582 0.2846 UFORE 191 0.7741 0.4023 <0.001 1.7215 1.0655
Subtropical dry forest FIA 225 0.1575 0.2780 <0.001 2.5452 0.3045 Subtropical wet forest FIA 746 0.1882 0.3427 <0.001 2.5906 0.3677 Lower montane FIA 118 0.4398 0.3071 <0.001 2.2753 0.6447 Mangrove FIA 93 0.3458 0.3983 <0.001 2.0523 0.6723 RMSE = root mean square error
Table 5: Model statistics and parameter estimates from DBH prediction Equation 5a by Holdridge life zone and tree measurement protocol.
ln (DBH) =b0+b1ln (HT) +b2ln(RMAX) Model Statistics Parameter Estimates
Life zone Protocol N r2 RMSE Pr>F b0 b1 b2
All All protocols 2739 0.3734 0.3229 <0.001 1.8218 0.3063 0.3229 FIA 2552 0.2305 0.2971 <0.001 2.1422 0.2224 0.2391 UFORE 187 0.8018 0.3639 <0.001 1.2077 0.7678 0.3723
Subtropical moist forest All protocols 1585 0.4068 0.3456 <0.001 1.7754 0.3251 0.3283 FIA 1398 0.1898 0.3025 <0.001 2.2790 0.2000 0.1938 UFORE 187 0.8018 0.3639 <0.001 1.2077 0.7678 0.3723
Table 6: Model statistics and parameter estimates from DBH prediction Equation 5b by Holdridge life zone and tree measurement protocol.
DBH =eb0∗Hb1
T ∗RbMAX2
Model Statistics Parameter Estimates
Life zone Protocol N r2 RMSE Pr>F b0 b1 b2
All All protocols 2739 0.3409 7.1465 <0.001 1.6284 0.4090 0.3272 FIA 2552 0.2822 7.1187 <0.001 1.6715 0.4028 0.3039 UFORE 187 0.7419 6.3029 <0.001 1.6044 0.2069 0.8123
Subtropical moist forest All protocols 1585 0.3475 7.2541 <0.001 1.7145 0.3674 0.3376 FIA 1398 0.2445 7.2020 <0.001 1.8163 0.3475 0.2948 UFORE 187 0.7419 6.3029 <0.001 1.6044 0.2069 0.8123
Lower montane FIA 115 0.4826 7.1210 <0.001 1.4340 0.3983 0.5585 Subtropical dry forest FIA 225 0.2057 6.2519 <0.001 2.1023 0.1714 0.3983 Subtropical wet forest FIA 735 0.3707 7.0686 <0.001 1.0804 0.6513 0.2543 Mangrove FIA 79 0.1893 4.9000 <0.001 2.5657 0 0.3359
RMSE = root mean square error
icao) forest life zones with an overall R2 value of 0.795. Perez (1970) also modeled crown diameter by DBH for trees in Puerto Rico and Dominica but did so based on the means of 10-cm diameter classes rather than on the DBH of the individually measured trees. By doing so, tree allometric variation was reduced resulting in un-commonly high R2 values of 0.8510 to 0.9898 that are not analogous to the results of this or other studies cited herein. Bechtold [20] presented species-specific models predicting crown width based on DBH for 66 broadleaf species in temperate forests in the eastern U.S. R-square values ranged between 0.13 and 0.88 across all 66 species, with 36 species having R2values greater than or equal to 0.5.
There were substantial differences in our model fits by measurement protocol, with models fit to the UFORE data generally being much better than those fit to the FIA data. This could be for two reasons, the first bio-logical and the second procedural. First, the urban for-est trees in the UFORE data could possibly have more symmetrical, less variable crowns than their closed for-est counterparts measured on the FIA plots. Basal areas on the UFORE plots ranged from 1.2 to 5.3 m2/ha with an average of 3.1 m2/ha (unpublished data), whereas basal areas on the FIA plots ranged from 8 to 26 m2/ha with an average of 19 m2/ha in Puerto Rico [24], and from 10 to 19 m2/ha with an average of 13 m2/ha for the U.S. Virgin Islands ..25]. Less competition on the UFORE plots allows the trees to grow fuller, more sym-metrical crowns that are more amenable to modeling. Secondly, the FIA protocol called for the specific mea-sure of the longest crown radius whereas the UFORE
protocol measured along the cardinal directions with no regard for which part of the crown was widest or nar-rowest. Only by random chance would the longest axis of the crown be measured by the UFORE protocol and therefore, the variation in RMAX for any given DBH was inherently smaller among the UFORE trees than among the FIA trees. On the FIA plots, variation in RLONG may be exaggerated by the inclusion of atypically long, stray branches growing toward canopy gaps.
It should also be remembered that models to esti-mate DBH from remotely-sensed crown and tree height measurements could potentially differ from models built using ground-based measurements and introduce addi-tional sources of error. Asner et al. .8] describe the difficulties of estimating crown width from IKONOS im-agery. Their satellite image-based crown area estimates were an average of 65% greater than field measurements.
5
Conclusions
Models that use a field or remotely-sensed measure-ment of HT as a predictor variable can be expected to produce a reasonably accurate estimate of DBH in Caribbean subtropical moist and subtropical wet forest, but these estimates should only be used with an under-standing of their limitations. Models that use a crown width measurement such as RMAX are sensitive to field data collection methods and suffer from the variability inherent in tree crowns. With most R2 values falling below a reasonably moderate level of correlation, the potential for error propagation from using a DBH pre-dicted from RMAX measurements in Caribbean forest biomass and carbon estimation models, as has been at-tempted for some Amazonian forests ..8, 9], is too great to earn our recommendation. While we would like to see the predictive capabilities of these models improved, we do not think that more data should necessarily be collected with the crown width measurement protocols employed here. We expect the use of other measurement protocols, such as measuring multiple radii from the bole to the drip line or measuring the longest diameter drip line to drip line and a perpendicular width, might pro-vide data more amenable for modeling purposes. There-fore, we recommend further study of crown width mea-surement protocols to determine if indeed the irregular crowns of Caribbean forest species can be predicted with acceptable levels of accuracy. Also, we recommend that models that predict DBH from remotely-sensed crown and height measurements be developed for comparison to models derived from ground-based measurements.
Acknowledgements
We would like to thank Dr. Ariel Lugo and Dr. Eileen Helmer of the USDA Forest Service’s International Insti-tute of Tropical Forestry; Esther Rojas of the Puerto Ri-can Conservation Foundation; Robin Morgan and Terry Hoffman, and Terry Hueth of the USDA Forest Service’s State and Private Forestry program; David Nowak and Robert Hoehn of the USDA Forest Service Northern Re-search Station; Jeffrey Glogiewicz of Consultores Ambi-ental; and Jonathan Buford, Johanna D’Arcy, Orlando D´ıaz, Christopher Furr, Jeremy Grayson, Dr. Humfredo Marcano, Omar Monsegur, Luis Ort´ız, Humberto
Ro-driguez, Jim Schiller, and Iv´an Vic´ens for field data collection. We would also like to thank Dr. Chris Cieszewski, Dr. James Flewelling and 2 anonymous re-viewers for their insightful comments and suggestions on the draft manuscript.
References
Asner,G.P., M. Palace, M. Keller, R. Pereira, and J.N.M. Silva. 2002.Estimating canopy structure in an Amazon forest from laser range finder and IKONOS satellite observations. Biotropica 34(4), pp. 483-492.
Bechtold, W.A. 2003. Crown-diameter prediction mod-els for 87 species of stand-grown trees in the East-ern United States. Northern Journal of Applied Forestry 24(4):269-278.
Bechtold, W.A. 2004. Largest-crown-width prediction models for 53 species in the western United States. Western Journal of Applied Forestry 9(4):245-251.
Brandeis, T.J., E.H. Helmer, and S.N. Oswalt. 2007. The status of Puerto Rico’s forests, 2003. USDA Forest Service Southern Research Station, p. 75.
T.J. Brandeis and S.N. Oswalt. 2007. The Status of U.S. Virgin Islands’ Forests, 2004. USDA Forest Service Southern Research Station 61 p.
Brown, S. 1997. Estimating biomass and biomass change in tropical forests: A primer. FAO Forestry Paper 134, Food and Agriculture Organization of the United Nations 55 p.
Brown, S., T. Pearson, D. Slaymaker, S. Ambagis, N. Moore, D. Novelo, and W. Sabido. 2005. Creat-ing a virtual tropical forest from three-dimensional aerial imagery to estimate carbon stocks. Ecologi-cal Applications 15(3): 1083-1095.
Chave,J., C. Andalo, S.L. Brown, M.A. Cairns, J.Q. Chambers, D. Eamus, H. F¨olster, F. Fromard, N. Higuchi, T. Kira, J.P. Lescure, B.W. Nelson, H. Ogawa, H. Puig, B. Ri´era, and T. Yamakura. 2005. Tree allometry and improved estimation of carbon stocks and balance in tropical forests. Oecologia 145:87-99.
Cole, T.G. and J.J. Ewel. 2006. Allometric equations for four valuable tropical tree species. Forest Ecol-ogy and Management 229:351-360.
Curtis, R.O. . 1967. Height-diameter and height-diameter-age equations for second-growth Douglas-fir. Forest Science 13(4):65-375.
Ewel, J.J. and J.L. Whitmore. 1973. The ecological life zones of Puerto Rico and the US Virgin Islands. USDA Forest Service Institute of Tropical Forestry, 72 p.
Falkowski, M.J., A.M.S. Smith, A.T. Hudak, P.E. Gessler, L.A. Vierling, and N.L. Crookston. 2006. Automated estimation of individual conifer tree height and crown diameter via two-dimensional spa-tial wavelet analysis of lidar data. Canadian Jour-nal of Remote Sensing 32(2):153-161.
Francis, J.K. 1988. The relationship of bole diameters and crown widths of seven bottomland hardwood species. Southern Forest Experiment Station. Re-search Note SO-328 3 p.
Huang S., and S.J. Titus. 1994.An age-independent individual tree height prediction model for boreal spruce-aspen stands in Alberta. Canadian Journal of Forest Research 24:1295-1301.
Kenefic, L.S., and R.D. Nyland. 1999. Sugar maple height-diameter and age-diameter relationships in an uneven-aged northern hardwood stand. North-ern Journal of Applied Forestry 16(1): 43-47.
Larocque, G.R., and P.L. Marshall. 1994. Crown de-velopment in red pine stands. I. Absolute and rela-tive growth measures. Canadian Journal of Forest Research, Vol. 24, pp. 762-774.
Martin, F.C., and J.W. Flewelling. 1998. Evaluation of tree height prediction models for stand inventory. Western Journal of Applied Forestry 13(4):109-119.
Nowak, D.J., D.E. Crane, J.C. Stevens, and R.E. Hoehn. 2005. The urban forest effects (UFORE) model: Field data collection manual. USDA Forest Service, Northern Research Station 34 p.
Palace, M., M. Keller, G.P. Asner, S. Hagen, and B. Braswell. 2008. Amazon forest structure from
IKONOS satellite data and the automated char-acterization of forest canopy properties, Biotropica 40(2):141-150.
Perez,J.W.. 1970. Relation of crown diameter to stem diameter in forests of Puerto Rico, Dominica, and Thailand. In: A tropical rain forest: A study of irradiation and ecology at El Verde, Puerto Rico, R.F. Pigeon, Editor, Division of Technical Informa-tion, U.S. Atomic Energy Commission, pp. 105-122.
Popescu, S.C. 2007. Estimating biomass of individual pine trees using airborne lidar. Biomass and Bioen-ergy, 31: 646-655.
Popescu, S.C., R.H. Wynne, and R.F. Nelson. 2003. Measuring individual tree crown diameter with li-dar and assessing its influence on estimating forest volume and biomass. Canadian Journal of Remote Sensing, Vol. 29(5):564-577.
Smith, W.R., R.M. Farrar Jr., P.A. Murphy, and J.L. Yeiser. 1992. Crown and basal area relationships of open-grown southern pines for modeling compe-tition and growth. Canadian Journal of Forest Re-search 22:341-347.
Sokal, R.R., and F.J. Rohlf. 1981. Biometry. The principles and practice of statistics in biological re-search. Second ed, W.H. Freeman and Company 859 p.
USDA Forest Service. 2006. Forest Inventory and Analysis National Field Manual. Vol-ume 1. Field Data Collection Procedures for Phase 2 Plots. Caribbean Version 3.0., http://www.srs.fs.usda.gov/fia/data acquisition/-field guide/Final/SRS Caribbean Ver 3 2006.pdf.
Weaver, P.L., and D.J. Pool. 1979. Correlation of crown features to growth rates in natural forests of Puerto Rico. Turrialba 29(1), pp. 53-58.