http://www.jedem.org
Transparency and Open Government: Reporting on
the Disclosure of Information
Victoria L. Lemieux
*, Stephanie E. Trapnell
**, Jessie
Worker
***, Carole Excell
*****World Bank, Washington, DC and University of British Columbia, Vancouver, Canada, vlemieux@mail.ubc.ca
**George Mason University, strapnel@masonlive.gmu.edu ***World Resources Institute, Washington, DC, jworker@wri.org ****World Resources Institute, Washington, DC, cexcel@wri.org
Abstract: This paper provides a summary of data about requests, complaints and appeals published by central reporting bodies in eight countries. It examines available data from the most recent year of aggregated data—ranging between 2011 and 2013. It assessed these statistics for Brazil, India, Jordan, Mexico, South Africa, Thailand, The United Kingdom, and the United States. Through this assessment it provides trends in how countries are collecting and publishing these data and finds that practices are far from standardized and data are often unavailable or incomplete.
Keywords: right to information, freedom of information, access to information, transparency
Acknowledgements: The authors would like to gratefully acknowledge the financial assistance of the Nordic Trust Fund, which has enabled this study to be undertaken.
1.
Introduction
and other transparency mechanisms. Political dynamics within countries also have played an important role, along with international pressure and strong civil society campaigns (Mendel, 2014).
In part, this popularity reflects the demand for information about how governments work, what governments do, and what those governments know about their citizens. The right to information can challenge government secrecy and abuse of power by addressing information asymmetries between government and citizens. Information requesting procedures and proactive disclosure mechanisms make information available to the public about government operations that are (or at least should be) relevant to the interests of citizens. This information access is often facilitated by technology. On the demand side, requests are submitted through online forms and email. On the supply side, governments increasingly proactively release data sets on government websites. While proactive disclosure and open data are high profile examples of government commitment to openness, responsive disclosure (i.e., disclosure that is requested under RTI laws) remains of paramount importance for democratic accountability purposes. This is true not only to support access to information that governments may not disclose proactively, but also because the administrative mechanisms established to enable responsive disclosure are also critical to support effective proactive disclosure (e.g., establishment of oversight bodies to check compliance, provision of guidance on what can be disclosed, etc. ) (Cambridge Economic Policy Associates & PDG, 2014).
In order to better understand the performance of RTI laws, shortcomings of the legal framework, and to determine areas for improvement, it is important to look at the data on requests, complaints and appeals on responsive disclosure. This paper provides a summary of data about requests, complaints and appeals published by central reporting bodies in eight countries. Forming part of a larger study for the World Bank on the effective implementation of right to information (RTI) laws, it examines available RTI data for Brazil, India, Jordan, Mexico, South Africa, Thailand, the United Kingdom, and the United States relating to requests, complaints and appeals at the national level from the most recent year of aggregated data—ranging between 2011 and 2013. Through this assessment it provides trends in how countries are collecting and publishing these data.
A similar study of proactive disclosure is also needed, but outside the scope of this paper. We note, however, that the Transparency in Governance section of the OECD Government at a Glance survey of member governments is one of the few attempts to collect data on the extent of proactive disclosure (OECD 2011). Much of its data is concerned with the location of access, rather than the regularity of updates or relevance to demand. Open data assessment and evaluation of government web portals are two separate lines of inquiry that capture partial data on proactive disclosure, but the results are not geared towards establishing links to RTI implementation process (Open Data Barometer 2013, Open Data Index 2013, Luna et al 2013, Holzer and Manoharan 2007).
2.
Relevant Literature and Studies
assessments with scoring criteria, which may involve interviews and desk research of policy reports, media articles, and other sources of information. There has also been compliance or field testing by civil society organizations and donors to determine the costs, timing, and quality of responses from different ministries and government agencies. However, the costs of large-scale cross-country compliance testing are considerable.
An additional source of information about the degree of government responsiveness to demand for information is the tracking and reporting data that agencies collect on their own RTI implementation processes. This data can be understood as an indicator of the performance or compliance of agencies in meeting their mandate for disclosure. In an outcome framework that focuses on accountability and development, three types of outcomes can be envisioned, with responsiveness as a first-degree outcome. Categories of first, second, and third-degree are not necessarily about timing or sequencing, but rather, are intended to reflect the degree of contribution from an RTI implementation process to development outcomes.
Figure 1: Degrees of RTI Outcomes (Trapnell and Lemieux 2014)
3.
Methodology
3.1.
Sampling
This study entailed collecting statistics from a sample of eight countries. The countries included in the sample were chosen on the basis of obtaining a distribution of regional representation, age of the RTI law in the country, and GDP.
3.2.
Data Collection
The statistics were gathered and compiled by project investigators,1 who also authored country case studies in some instances. Data were obtained from the designated central body that collects RTI information, in most cases the national oversight body (e.g., Auditor General) and in some countries the national agency for oversight of RTI (e.g., Office of the Information Commissioner) but did not include subnational request data. Data collection methods included using web portals to directly download data and extracting data from the most recent annual reports.
Categories of data gathered for this study included:
Basic overview data, including date of most recent annual report or data collection;
1 The investigators were based in the countries for which they gathered data and, as such, were fluent in the local language and familiar with the context of the data.
First-degree outcomes
Information disclosure: Responsiveness to demand for information (rate, quality, and timeliness of responses; amount, relevance, and regularity of proactively disclosed information)
Second-degree outcomes
Information usage for acccountability: Strategic use of RTI to establish accountability measures and improve operational efficiency (e.g., anti-corruption preventative and investigative
mechanisms, improved service delivery, etc.)
Third-degree outcomes
Institutionalization of information access, even if regularly contested:
Shift in bureaucratic culture to one of openness
Improved development outcomes:
Request and response data, including total annual requests at national level, and responses by type;2
Timeliness of response;
Requester profile information, including type of requestor (individual, NGO, media, etc.)
Most requested information types;
Exemption data, including total refusals and exemptions most often invoked to deny disclosure of data;
Data on appeals, including total numbers, reasons for appeal, and responses;
Sanctions data, including the number of personnel or agencies receiving sanctions for failure to release information, for destroying information, or for inappropriate release of information; and
The number of complaints registered.3
3.3.
Limitations and Constraints of the Data
For the purposes of cross-country comparison, this study relies on data from the most recent collection period, which is not the same for each country but ranges from 2011 to 2013. Following data gathering, descriptive statistical methods were used to analyze the data in order to form a cross-comparative picture of RTI requests, complaints, and appeals in the sample countries.
Although individual public authorities in the sample countries must submit annual reports that detail what efforts they have made to implement the law and how they have responded to information requests received, the types of statistics that are available depend upon a variety of factors. These include the specificity of the national legal requirements, the performance monitoring system of each agency (and possibly the records management capacity), and the ability of the oversight agency to compel agencies to collect real-time data. In addition, the number and type of agencies that are required to report data is not the same across countries. Some countries may require hundreds of agencies to report, while other countries require less than fifty. Thus, cross-country comparison of data about requests and appeals across countries has limitations.
2 While “requests per capita” is sometimes used as a metric to evaluate overall use, its value as an indicator is questionable. First, countries have different standards for what constitutes a request. The U.S., for instance, counts requests for one’s own personal data as an information request, while other countries do not. Additionally, these numbers do not include subnational requests in federal states, which can (in the case of India for instance) far outnumber national requests. The types of agencies that must report also varies across countries, making the pool of reporting bodies not comparable.
4.
Findings
4.1.
Overview
In this section, we present an overview of key findings.
Brazil’s 2011 law began collecting data in May of 2012. Nearly eighteen percent (18%) of requests were refused or unresolved for non-exemption related reasons, including because the information did not exist, the request was incomprehensible, or duplicative requests, among other reasons.4
Since the passage of RTI legislation in 2005, India’s volume of requests has increased from 24,436 in 2005-2006 to 655,572 in 2011-2012.5
Jordan’s 2007 law only began reporting data about requests and appeals in 2011-2012. There were no data on why the requests were refused.
Mexico has consistently collected request data since the law was passed in 2002. Since 2008, the number of requests has increased 35% overall (from 105,250). In 2013, 15.5% of requests were refused for non-exemption reasons6 and 3.7% were refused on exemption.
South Africa’s request numbers stand out because of the high degree of variability in reporting from year to year. In 2012, 185 agencies reported requests, while in 2013, only 108 reported, likely contributing to a 38% drop in reported requests. However, in 2009, with only 104 agencies reporting, the number of requests (24,786) was still marginally higher than 2013 (23,380). In 2013, 85.5% were granted in full, and of those, 3.4% were granted “in the public interest”. Only 1.7% were listed as fully refused, however the rest (12.2%) are not accounted for in the statistics.
Of those granted, 3.3% required a time extension. South Africa’s requests per capita stood at 0.05%. Thailand’s oversight agency did not provide online data on requests at the time of research. The only nationally-aggregated data made available by the OIC were on complaints and appeals.7
In the United Kingdom, thirty percent of requests were refused because the information was not available, due to cost prohibition, duplicate requests, or other reasons not covered under exemptions. Exemptions caused refusals 14.3% of the time, as noted in Table 3.
The United States began FY13 with a backlog of 71,790 requests and reported 704,394 requests across 99 agencies in FY13, making a potential request total of 776,184. However, according to the
4Also included: decisions which were still being made, “unreasonable requests”, requests which were not actually requests or requests to the wrong agencies. (Note: it is unclear if these requests were transferred.) 5 India Central Information Commission (Note: most recent annual report from 2012). These numbers, which just include centralized data from the national government, do not represent subnational requests, which as previous studies have shown, constitute a far greater number.
6 These included lack of payment or response from applicants (14,074), information which does not exist (5,413), or the category “no proceedings will be taken on request” (848).
FOIA.gov online portal, only 678,391 requests were processed in FY13.8 A backlog of 95,564 was reported at the end of FY13, leaving 2,229 with unidentified outcomes. As summarized in Table 3, of those processed, 35% were granted in full and 30% granted in part. While 6.1% were refused for exemption reasons, 28.9% were refused for non-exemption reasons, were deemed unresolvable, were duplicate requests, or were withdrawn.9 While there is a 20-day deadline to respond to requests by law, the average response times for simple, expedited and complex requests exceeded that deadline by two to sixty-two days.
Table 1: Summary of Available Data
Country
Year of Law
Central reporting body
Volume & responses to requests
Agencies receiving
most requests
Most frequently
invoked exemptions
to deny disclosure
Appeals Sanctions
Brazil10 2011 Office of Comptroller
General X X X X
India11 2005 Central Information
Commission X X X X
X
Jordan12 2007 Information Commissioner
and Information Council X X X N/A
Mexico 2002 Federal Institute on Access
to Information (IFAI) X X X
South
Africa 2000
South Africa Human Rights
Commission X X
Thailand 1997 Official Information
Commission X N/A
8 Disposition report, 2013; All agencies. www.foia.gov/data.html
9Non-exemption refusals include lack of records, improper FOIA requests, duplicate requests, and records held at other agencies. Notably, 10,288 requests were withdrawn (1.5%).
10 Brazil Office of Comptroller General; Retrieved March 15, 2014. http://www.acessoainformacao.gov.br/sistema/Relatorios/Anual/RelatorioAnualPedidos.aspx
11 Central Information Commission of India, Annual Report, 2012; http://cic.gov.in/AnnualReports/AR-2011-12/AR2011-12E.pdf
United
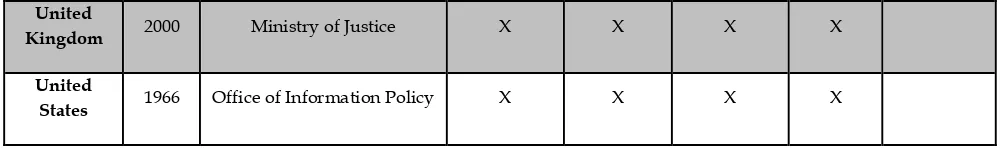
Kingdom 2000 Ministry of Justice X X X X
United
States 1966 Office of Information Policy X X X X
Note: “N/A” refers to “not applicable” because of the lack of a statutory requirement for that oversight function. A blank cell indicates that the data were not made available online by the oversight body.
Table 2: Request Volume Overview
Country
Number of national requests
(year)
Number of agencies reporting
Requests per capita13
Requests outstanding/backlog
% Outstanding14
Brazil 86,661 (2013) 285 0.04% 618 0.7%
India
655,57215 (April, 2011 – March,
2012) 66 0.05% 430,425 65.6%
Jordan 2286 (2013) 15 0.04% 0 0
Mexico 142,766 (2013)16 247 0.12% 11,193 7.8%
South Africa 23,380 (2012-2013) 108 0.05% 0 0
Thailand N/A17 276 N/A N/A N/A
United
Kingdom 49,46418 (2012) 41 0.08% 757 1.5%
United States 776,18419 (2013) 99 0.22% 95,564 12%
13 Requests per capita: total requests divided by population. Population data based on: http://data.worldbank.org/indicator/SP.POP.TOTL. The percentage represents the percentage of the population that has made a request under the RTI law.
14 This number refers to the percent of outstanding requests based on the total number of requests as indicated in column 2.
15 This number includes backlogged requests from previous years. 16 Through December 15, 2013.
17 Note: N/A stands for “Not Available“. In the case of Thailand, data are collected, but OIC does not produce national statistics for public disclosure, other than for appeals and complaints.
18 Not listed: 26% of the total requests were deemed unresolvable.
As shown in Table 1, Thailand stands out in this sample for not making these basic data publicly available. Brazil, Mexico, the United States and the United Kingdom contained the greatest categories of data across the most available years. Jordan was the most likely to grant an information request in full, followed by South Africa and Brazil (see Figure 1). However, Jordan’s reporting only covers 15 agencies when civil society activists estimate the number of public agencies to be over 120 (Meknassi, 2014). Furthermore, a large proportion of all of Jordan’s requests were addressed to the Department of Statistics and may not be formal requests under the RTI law (Meknassi, 2014).20 India and the United States received the most requests and also had the largest backlog of outstanding requests—due not only to the size of their populations but also to high requesting rates. It is important to note that multiple requests may be made by single individuals—unique requestors were not tracked in any of the countries summarized here.
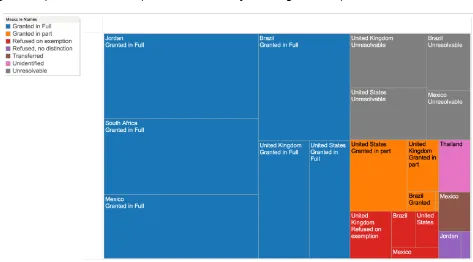
Figure 1: Request Volume and Responses (2012-2013), by Percentage – Treemap View.
The colour of each rectangle indicates the class of disposition (e.g., granted in full). The meaning of each colour is explained in the key in the upper left-hand corner of the figure. The size of each rectangle indicates the volume of requests by class of disposition. Each rectangle is also tagged with the name of the country to which it refers. The figure identifies that Jordan, South Africa and Mexico had the highest volume of requests granted in full.
4.2.
Use of Exemptions
Every RTI law has a set of exemptions that withhold certain types of information from disclosure.21 Most countries have exemptions for commercial secrets and national security. Other frequent exemptions include privacy, exemptions related to investigations or law enforcement, and information covered by legal privilege. To support the right to information, it is critical that the law defines exemptions narrowly. Procedures may also include harm tests to prove that disclosure will create harm, severance clauses, and clear explanations concerning the legal grounds on which the information is being refused. Even better is to have a provision to balance the public interest against the importance of the interest protected by the exception, particularly in cases where public security, health, and the environment may be affected.
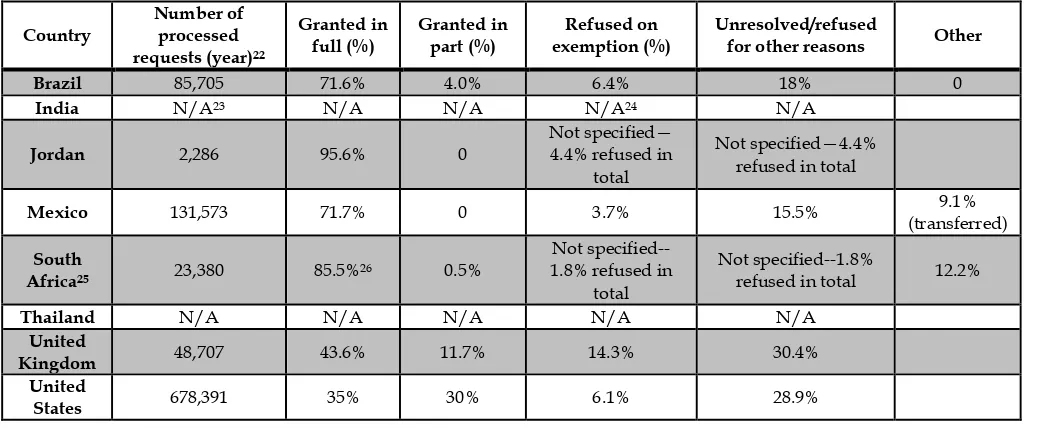
Table 3: Disposition (Response) to Processed Requests
Country Number of processed requests (year)22
Granted in
full (%) Granted in part (%) exemption (%)Refused on Unresolved/refused for other reasons Other
Brazil 85,705 71.6% 4.0% 6.4% 18% 0
India N/A23 N/A N/A N/A24 N/A
Jordan 2,286 95.6% 0
Not specified— 4.4% refused in
total
Not specified—4.4% refused in total
Mexico 131,573 71.7% 0 3.7% 15.5% (transferred) 9.1%
South
Africa25 23,380 85.5%26 0.5%
Not specified--1.8% refused in
total
Not specified--1.8%
refused in total 12.2%
Thailand N/A N/A N/A N/A N/A
United
Kingdom 48,707 43.6% 11.7% 14.3% 30.4%
United
States 678,391 35% 30% 6.1% 28.9%
Exemption statistics enable an oversight body to better understand, at the very least, how frequently different exemptions are being invoked, and ideally, the types of requests that are triggering exemptions. Only four of the eight countries provided nationally aggregated data on the exemptions used. Of those, the most commonly invoked were: privacy, classified information, national security, and finances, which can include commercial confidentiality or management of the
21 “Exceptions” and “exemptions” are used synonymously in the literature 22 (Total requests)-(Outstanding requests), as summarized in Table 2.
23 Only refusals and transfers are reported in the annual report, making it difficult to ascertain how many were granted and outstanding. “Unidentified” refers to those requests in India which have not been refused or transferred, but have not been identified as granted.
24 While the CIC annual report indicates how many exemptions were invoked in total, it is unclear how many refusals were due to exemptions since multiple exemptions could be invoked in one refusal.
economy. Exemption statistics, when provided, typically describe how many times an exemption has been cited, not how many refusals were due to any particular exemption. Multiple exemptions may be cited in one refusal, and exemptions may be cited, but be overruled by public interest tests.
4.3.
Appeals and Sanctions
The availability of appeals systems and ways in which requesters can appeal refusals to grant information vary by country.
Brazil’s Right to Information Act allows four levels of appeal as shown in Figure 2. Requesters may first appeal to the supervisor of the authority who made the decision within the agency. They can appeal that decision to the highest authority within the agency. After that, they can appeal to Office of the Comptroller General. The final stage of appeal in the Mixed Commission for Information Reassessment. There were 6,177 first appeals in 2013, 5,915 of which were processed.
Figure 2: Levels of RTI Appeals in Brazil
In India, the initial appeal is received internally by an appellate authority within the agency as shown in Figure 3. The next stage is the State or Central Information Commission (depending on the nature of the request). The decisions of these commissions are binding. There were 33,922 appeals in 2011-2012, or 63.5% of total refusals. However, no data have been provided on how they were resolved. An appeal against a decision of the CIC may then be made to the courts.
Figure 3: Levels of RTI Appeals in India
In Jordan, the Information Council is the first stage of appeals. Jordan recorded 15 appeals in 2013, but no data are available on how they were resolved. Requesters may appeal the decision of the Information Council to the Higher Court of Justice, but as revealed through interviews with
Within agency
Highest authority within agency
Comptroller General
Mixed Commission on Information Reassessment
Within agency
State or Central Information Commission
stakeholders, the costs and procedural difficulties have made this avenue impassable so far (Meknassi 2014).
Figure 4: Levels of RTI Appeals in Jordan
In Mexico, requesters can first appeal an agency’s decision to deny access to the Comite de Informacion located within each agency. Requesters can then submit a second appeal to the IFAI, which is autonomous and whose decisions are binding. Requesters may appeal the IFAI’s decisions to the courts, although Federal agencies cannot. There were 7,390 appeals at the national level in Mexico in 2013, totaling 66% of refusals for that year. The IFAI did not report data on the reasons for appeal or their resolution status.
Figure 5: Levels of RTI Appeals in Mexico
South Africans can appeal to the public body where the request was made and after that, seek to be heard by the courts. There were 80 appeals in South Africa in 2013 (20% of refusals), nine of which were granted in full (11%).
Figure 6: Levels of RTI Appeals in South Africa
In Thailand, requesters can appeal an agency refusal to the Information Disclosure Tribunal (IDT) and if unsatisfied with that decision, to the Administrative Court. In 2012 in Thailand there were 253
Information Council
Higher Court of Justice
Within agency (Comité de Información)
IFAI
Courts
Within agency
appeals made to the IDT, with 51% granted in full and 12% refused. There were no data provided by Thai government for 37% (n=93) of the appeals in 2012.27
Figure 7: Levels of RTI Appeals in Thailand
The United Kingdom has a five-step appeals process. After the first internal appeal, requesters can appeal to the Information Commissioner’s Office (ICO), then the Information Rights Tribunal, then the Administrative Appeals of the Upper Tribunal and finally the Court of Appeals. However, data retrieved from the Ministry of Justice only reported appeals in 2012 at the first two stages. There were 2,724 appeals for internal review and 351 to the ICO. Of the 2,558 appeals which were processed, internal reviews resulted in the granting of 11% of appeals in full, 14% partially, while 75% were refused. Of the 186 the ICO had processed, it granted 16.7% in full, 15.6% in part, and refused 67.7%.
Figure 8: Levels of RTI Appeals in the United Kingdom
In the United States, the first stage of appeals is internal. If that does not resolve the issue, the requester can seek mediation through the Office of Government Information Services—but this is not formally an appeals mechanism. Then, appeals go to District courts. In 2013, agencies started the year with 3,955 unprocessed appeals from previous years and received 12,028 during the year. Of the combined 15,983, a total of 12,042 were processed in 2013. Of those processed, 5,377 (44.65%) were affirmed, 1,912 were partly affirmed (15.88%) and 1,842 were successfully appealed (15.30%).
27 This is based on web-based research and conversations with Panisa Luangvormeth, Director of the Office of Informatio
n
Disclosure Tribunal
Courts
Within agency
Information Commission
Information Rights Tribunal
Administrative Appeals Chamber, Upper Tribunal
A remaining 2,911 (24.17%) were given the category “other reason”, which is not explained on the FOIA web portal.
Figure 9: Levels of RTI Appeals in the United States
In addition to the challenges posed by different levels and types of appeals, the statistics on appeals often aggregate appeals numbers and offer little explanation as to the basis for an appeal and how it was resolved. Brazil stood out for having the most disaggregated and detailed data on appeals, including the reasons for the appeals, response time, and numbers disaggregated at the monthly level. Due to the high level of variance in data reported by the countries in the sample, it is difficult to draw conclusions based on the available information.
The availability of sanctions for serious failures to comply with the law, whether by individuals or public authorities as corporate entities, has the potential to improve implementation. As shown in Table 4, most RTI laws provide for some sort of sanctions, but experience suggests that sanctions are very rarely imposed in practice (Susman et al. 2012). Of the eight countries, sanctions of one sort or another are provided for in Brazil, India, Mexico, South Africa, and the United States, but only India reported any sanctions in the most recent year of data. Significantly, and unlike in most countries, in India the oversight body can apply sanctions directly, without needing to go to court.
Table 4: Sanctions Provided in Law
Country Sanctions provided in law Scope
Brazil Yes Public agent or military28
India Yes Public officials29
Jordan No
Mexico Yes Public officials
South Africa Yes Public officials30
Thailand No --
United Kingdom Yes Public Authorities and public officials31
28 Brazil Law 12,527 on Access to Information; 2011. 29 India Right to Information Act, 2005.
30 South Africa Protection of Personal Information Act, 2013. But note that the oversight agency does not have sanctioning authority.
Within agency
United States Yes Public Official or employee
5.
Discussion
The data about requests and appeals presented in this paper demonstrates that the state of data collection and reporting on the operation of the responsive provisions of RTI laws is far from complete or standard across the eight countries in the sample. In most cases it was impossible to ascertain whether the data collected by central agencies were comprehensive—including all of the government agencies that fall within the scope of the law—as this information is not made available in reports or online (e.g., Thailand and Jordan). Brazil provides the most detailed data including tables and charts for comparison, information regarding appeals, their nature, and their resolution. Thailand and Jordan had the least data collected across all the areas assessed.
While nearly all countries, with the exception of Thailand, made data available on the volume of national requests and the rate of responses, either in an annual report or via an online portal, data on the use of exemptions was less prevalent, as were the reasons for appeals, or how they were resolved. Data about requests and appeals were not available readily online for multiple years and discrete statistics on, for example, the type of agency which received the most requests per year, were not reported consistently in most countries. Data on the type of information requested were almost always aggregated at the agency or Ministry level, with Mexico and to a lesser extent Brazil also providing information about the type of information requested.
The length of time since the law has been passed mattered less than the strength of the legal provisions regarding reporting on requests and appeals. The United States and Thailand have the oldest laws, but lagged behind Brazil in regard to the availability of data in several categories. New databases and the development of online portals are a positive improvement in the collection of statistics, and the Brazilian government’s achievement in such a short time is noteworthy.
Other significant findings include:
Thailand does not have legal requirements to provide specific statistics to its oversight body;
India’s RTI system does not provide data on response rates, but is the only country to record sanctions taken against individuals who failed to provide information;
The United States was the least likely to grant an information request in full, and Jordan (with a very small sample size) was the most likely;
Requesters who were refused in Mexico, Brazil and India were much more likely to appeal their refusals, possibly indicating a better functioning or more accessible appeals mechanism than in the other countries; and
Brazil’s collection of reasons for appeal was particularly illuminating as it may also be used to highlight areas where exemptions are being misused. Greater transparency around exemption use and appeals may also help improve awareness about the importance of RTI laws and build public trust in using the law.
of RTI laws. Nevertheless, given the continued importance of responsive modes of disclosure and the significance of effective RTI operation as a framework within which other modalities of transparency, such as open data, can function, exploration of data on RTI requests and appeals, even with limitations, provides a good starting point for better understanding what drives effective operation of RTI laws. As an increasing number of RTI laws include proactive disclosure provisions, there is also a need to supplement data on responsive disclosure with statistics on proactive disclosure in order to gain a holistic picture of the operation of a transparency ecosystem within a particular country context. With the need to monitor progress on Sustainable Development Goal 16.10 on public access to information, work could be done to help countries agree upon a common approach to the gathering and disclosure of statistics on the operation of RTI laws as well as on helping them to build capacity to gather and report such statistics.
Beyond gathering statistics on the first degree outcomes of RTI laws, there is an additional need for comparative measures of the effectiveness of the laws in relation to the second and third-degree outcomes discussed above.32 Such cross-country comparative indicators of RTI implementation effectiveness, rather than serving as a way to censure countries, have many potential benefits. These indicators would enable countries and international agencies, such as the UN, to answer questions about what areas of weakness countries have in terms of effective implementation of RTI laws to identify where countries require support. In addition, a database of such indicators would enable researchers to begin to develop better informed and more theoretically robust views on questions such as: Which implementation factors matter most to achieving development outcomes (e.g., supply-side factors, demand-side factors)? In which contexts? Does RTI weaken or strengthen state institutions? Is RTI more effective in states with competitive political environments? Is implementing RTI an appropriate strategy in the context of Fragile and Conflict-Affected States? What is the best approach to implementing RTI laws in different contexts? What are the transmission mechanisms that operate from RTI law passage, to implementation to transparent, accountable and inclusive governance to development outcomes? Statistics do not tell the full story, however33: All data about the RTI system benefits from gathering more contextual data through analyses that capture and acknowledge the unique social, political, and economic realities within which RTI systems operate in each country.
6.
Conclusion
Timely, clearer, and better quality data on the operation of RTI systems would support better understanding of the performance of RTI laws, shortcomings of the legal framework, and areas for improvement. Moroever, if the right to information is to form a key component of Sustainable
32 For example, the World Bank has developed the RTI indicators on Drivers of Effectiveness (RIDE indicators). For more information on the genesis of these indicators, see Trapnell and Lemieux 2014.
Development Goals, good data on the performance of RTI systems will be essential. For countries themselves, such data can also reveal information about high-performing agencies, which generates positive incentives for better performance (as evidenced by the work of the La Alianza Regional por la Libre Expresión e Información in Latin America (Fundar, 2014)), while poor performance can be identified and addressed. Reporting of performance data by oversight bodies is also crucial to the principle of openness, especially in cases where the oversight body is autonomous. Access to the performance statistics of various agencies can not only encourage civil society organizations to analyze and disseminate findings, but can also facilitate collaborative engagement with government over possibilities for improvement or scale-up.
Unevenness of reporting in the countries suggests that a global discussion on RTI reporting standards could be worthwhile and serve as a basis for more effective monitoring and implementation of RTI laws within countries, in addition to facilitating the sharing of data on experiences between countries.
References
Cambridge Economic Policy Associates and PDG South Africa. (2014). Disclosure of Information in Public Private Partnerships. World Bank Institute.
Centre for Law and Democracy. (2014). Global RTI Rating Index. http://rti-rating.org.
Dror, Yebezkel. (1999). “Transparency and Openness of Quality Democracy.” Pp. 25–43 in Openness and Transparency in Governance: Challenges and Opportunities, edited by Michael Kelly. Maastricht: NISPAcee Forum.
Fundar. (2014). Brief: Red Regional de la Sociedad Civil para Promover la Libertad de Expresión y Acceso a la Información.
Global Integrity Report. (2004-2011). https://www.globalintegrity.org/global/report-2011/
Hazell, R., Worthy B., & Glover, M. (2010). The Impact of the Freedom of Information Act on Central Government in the UK: Does FOI Work?. Basingstoke and New York: Palgrave Macmillan.
Holzer, M., & Manoharan, A. (2007). Global Trends in Municipal E-Government: An Online Assessment of Worldwide Municipal Web Portals. In A. Agarwal & V. V. Ramana (Eds.), Foundations of e-government (pp. 178–188). New Delhi: Global Institute of Flexible Systems Management.
Hood, Christopher. (2006). “Varieties of Transparency.” Pp. 25–43 in Transparency: The Key to Better Governance?, edited by Christopher Hood and David Heald. New York: OUP/British Academy Proceedings of the British Academy 135.
Luna, D. E., Gil-Garcia, J. R., Luna-Reyes, L. F., Sandoval-Almazan, R., & Duarte-Valle, A. (2013). Improving the performance assessment of government web portals: A proposal using data envelopment analysis (DEA). Information Polity, 18(2), 169–187.
Meknassi, S. F. (2014). Implementing Right to Information: A Case Study of Jordan. In S. E. Trapnell (Ed.), Right to Information: Case Studies on Implementation (pp. 365–418). Washington, DC: World Bank.
Mendel T. (2014). The Recent Spread of RTI Legislation. Washington DC: World Bank.
OECD. (2011). Government at a Glance. http://www.oecd.org/gov/governmentataglance2011.htm. Open Data Barometer. (2013-). http://www.opendataresearch.org/barometer.
Open Data Index. (2013-). http://global.census.okfn.org/.
Open Society Justice Institute. (2006). Transparency and Silence: A Survey of Access to Information Laws and Practices in Fourteen Countries. New York. Open Society Institute: Open Society Justice Initiative. RTI Assessment and Analysis Group and National Campaign for People’s Right (NCPRI). (2009). Safeguarding
the right to Information: Report of the People’s RTI Assessment 2008.
South African Human Rights Commission. (2013). Annual Report 2013. Braamfontein, South Africa: South African Human Rights Commission.
Susman, T. M., Jayaratnam, A., Snowden, D. C., & Vasquez, M. (2012). Enforcing the Public’s Right to Government Information: Can Sanctions Against Officials for Nondisclosure Work? (SSRN Scholarly Paper No. ID 2295466). Rochester, NY: Social Science Research Network.
Trapnell, S. E. and V. L. Lemieux (2014), Right to Information: Identifying Drivers of Effectiveness in Implementation, Right to Information Working Paper Series No. 2 (Washington, DC: World Bank).
United Nations (2015). Sustainable Development Goals. https://sustainabledevelopment.un.org/topics.
Worthy, B., Amos, J., Hazell, R., & Bourke, G. (2011). Town Hall Transparency? The Impact of the Freedom of Information Act on English Local Government. London, England: The Constitution Unit Department of Political Science UCL (University College London).
About the Authors
Victoria L. Lemieux
Victoria L. Lemieux is a Senior Public Sector Specialist at the World Bank focusing on transparency and information management and an Associate Professor of Archival Studies at the University of British Columbia in Vancouver, Canada.
Stephanie E. Trapnell
Stephanie E. Trapnell is is pursuing a PhD in sociology at George Mason University. Her preliminary dissertation research centers on information flows and networks of influence in right to information and open data regimes.
Jessie Worker
Jessie Worker is an associate with The Access Initiative at the World Resources Institute. His work currently includes helping to improve institutions governing climate change adaptation efforts.
Carole Excell