REPERTORY GRID ANALYSIS AND
CONCEPT MAPPING: PROBLEMS AND
ISSUES
Thomas J.J. McCloughlin
St. Patrick’s College, Dublin City University, Ireland E-mail: [email protected]
Philip S. C. Matthews
Trinity College, University of Dublin, Ireland E-mail: [email protected]
Abstract
‘Repertory grid analysis’ was used as a way of constructing representations of learners conceptions of living things; and finding a common structure or understanding; this was described in previous work. ‘Concept mapping’ has been stated as an appropriate assessment procedure in science curricula in a number of countries. Previous relevant published work describing the benefits of ‘concept mapping’ as a learning, teaching, and assessing tool is large. However, the existence of a large literature is not justification in itself, and in this work we provide a critique of the current literature. Problems with ‘concept mapping’ are simply ignored. However, it is thought that ‘repertory grid analysis’ does overcome some of the recognized problems of ‘concept mapping’ such as: i) comparison of concept maps between students or between students and educators: in repertory grid this becomes not only possible but a reliable method - this has proven to be one of the more problematic areas in traditional ‘concept mapping’; ii) quantification of concept mapping - integer scoring of whole concept maps in ‘repertory grid analysis’ is eliminated since the arranged structure of the graph produced holds significance for the conceptual structure. More research needs to be done in repertory grid analysis and its implications and applications in curricular research have yet to be fully explored.
Key words: concept mapping, conceptual frameworks, repertory grid analysis.
Introduction
Knowledge of how concepts are classified and categorized, terms which are differentiated by Estes (1996) as they become assimilated, leads to the assumption that if the learning environment, i.e., ‘schooling’, is adapted to maximize the acquisition and ordering of concepts, such an adaptation should consider the ordering processes. In a similar thread, scientists order concepts of living things in diagrams which are akin to concept maps, therefore one way to learn, and assess the learning of, the ‘correct’ system of ordering living things would be through such diagrams. Such a diagram would allow the educator to find out easily if the categories formed are formal-biological or folk-biological or somewhere in-between, in the case of living things. McCloughlin and Matthews (2009, 2010) did outline three studies into school-based classifications:
(i) How one group classified five terms of equines: horse, donkey, mule, zebra and pony; and the term ‘goat’ as an ‘out-group’.
Volume 48, 2012
92 using living vs. extinct, unfamiliar vs. familiar exemplars over the post-primary school age-range
(iii) How formal drawings of dicotyledonous plants were classified with two professional biologists as an out-group.
The technique employed by McCloughlin and Matthews (2009, 2010) was an adaptation of repertory grid analysis; however, it is thought that diagrams which represent the ordering of concepts may relate to each other, and this is the subject of this present paper. The aim of this work is to examine the repertory grid technique itself and concept mapping in more detail in relation to constructing a learner’s conceptual framework of concrete representations of abstractions (i.e., concretistic concepts), with concepts of living things being used as an example. It is part of an on-going project into the applications of Repertory Grid Analysis (RGA) in science education research.
What Is Concept Mapping?
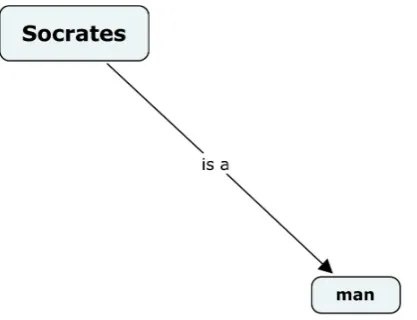
Concept mapping is a way to represent concepts in a diagrammatic manner showing the links between concepts and their components. The term ‘mapping’ is applied because it is thought that the spatial arrangement of concepts denotes a significance, a measureable ‘mental distance’ (Wandersee, 1990), except that in concept mapping the distance are not ‘measured’. Concept maps are typically representations of simple propositions of the ‘subject-link-predicate’ type as shown in Figure 1. Concept mapping was defined by Pankratius and Keith (1987) as “a two-dimensional hierarchical representation of concepts which indicates the relationship between selected concepts”. Fisher (2000) places concept mapping as one of many types of knowledge mapping. She states that it was invented, and extensively researched, by Joseph D. Novak (Wandersee, 1990) and his research team. Concept mapping has been employed in a large number of areas within the area of education. Some of these are: as a learning tool (Horton et al., 1993; Roth & Roychoudhury, 1993); measuring achievement (Pankratius, 1990); reduction of learners’ anxiety (Okebukola & Jegede, 1989); integration within curricular design (Nicoll, Franscisco, & Nakleth, 2001); assessment (Atkinson & Bannister, 1998; Buldu & Buldu, 2010; Laffey & Singer, 1997; Liu, 1994; McClure & Bell, 1990; Oliver & Raubenheimer, 2006; Robinson, 1999; Ruiz-Primo & Shavelson, 1996); and self assessment (Stow, 1997); autobiographical reflections (Lim, 2011); collaborative learning (G. Wilson, Nash, & Earl, 2010); conceptual growth (Miller et al., 2009) – categories which are not mutually exclusive.
93 What is Repertory Grid Analysis?
George Kelly (Kelly, 1992) formulated the seminal work on repertory grid analysis (RGA) which was initially grounded in clinical psychology – and indeed, it is this domain which has made the most extensive use of this technique. RGA was devised to identify, and investigate the relationships between, a person’s mental constructions. Subjects rate, score or rank the relevance, importance or similarity of a characteristic to a list of entities, i.e. concepts – this list comprises the so-called repertory or repertoire. This produces a grid or matrix of n × m form of n columns and m rows (Figure 2.). In classical repertory grid analysis, the subject chooses those characteristics which are pertinent to the test item derived by, or supplied to, the subject. The process of ranking elements against concepts, called ‘constructs’, is a constructive process, in that a representation of the subjects mental ordering has been made explicit in a stepwise fashion.
Figure 2: DISPLAY: A simple matrix of ratings of four elements (people) against three constructs (descriptions).
Volume 48, 2012 94
Figure 3: FOCUS: The same matrix now ‘focussed’ and with cluster analysis, dendrograms on the right.
The result of this analysis is the production of a set of co-ordinates derived from principal component loadings, typically, the first and second loadings are utilised to plot the position of the constructs on a Cartesian plane. The analyses produce graphs that are representations of a person’s set of constructs with the co-ordinates of the constructs plotted as points in two or more dimensions. The selection of only the first and second principal component loadings is again the subject of further work (McCloughlin and Matthews, in preparation).
Figure 4: PRINGRID: The resultant principal components plot of the matrix in Figure 1. and Figure 2.
95 What Then Is Conceptual Framework Mapping?
“Conceptual framework” is a generic term to include techniques for representing concepts and the relationships between them pictorially. In this paper, we consider the use of repertory grid analysis and concept mapping as techniques of conceptual framework mapping and review its relationship with ‘classical’ concept mapping and briefly with modern biological techniques.
Problem of Research
Kinchin (2001) asked the still highly pertinent question that if concept mapping is so helpful to learning science then “why aren’t we all doing it?” Kinchin (2000) believed that there has been a reluctance in the science education researcher community to address problems with concept mapping in the face of purported wide ranging advantages and benefits ascribed to concept mapping. The simple truth is that in spite of the positive literature, teachers of primary, secondary and tertiary science do not use concept mapping as much as they could. The purpose of this paper is to deal with the sort of problems that have been outlined by a number of researchers.
Kinchin (2001) describes the main problem a teacher faces when having administered a concept mapping task to a class group: what do you do with them now? How does one compare 20-30 (or more) concept maps with each other and with the teachers’ ‘authoritative’ conception? Taking one step back further, an even simpler question is how to compare only two concepts that one person constructs, and thus examine the progress of the learner. A key problem of attempting to employ concept maps in education has been to devise protocols to apply a score or ‘mark’ in order to introduce an element of summative assessment. Indeed, early attempts in applying a score to concept maps involved a summative approach (Novak & Gowin, 1984). The constructivist agenda is contrary to impressionistic scoring of test items and issue of validity and reliability are relevant also.
Can Concept Maps Be Assessed?
In this section, a number of methods of scoring concept maps are reviewed before RGA is examined in more detail. The following methods all attempt to decompose concept maps into their components and score the components based on some kind of weighting. The scores are then analysed according to an algorithm, usually a summation. Novakian concept mapping (Markham, Mintzes, & Jones, 1994) has undergone a number of adaptations by different workers (Martin, Mintzes, & Clavijo, 2000), some of whom developed a system for scoring structural complexity and examining propositional validity.
S
cm=
n
c+
n
r+
n
h+
n
b+
n
l+
n
ln
cæ
æ
æ
æ
æ
÷
(i)
Where:
nc, is the number of points for concepts, one for each non-redundant concept,
nr, is the number of points for relationships, one point for each valid, scientifically-acceptable proposition,
nh, is the number of points for hierarchy, five points for each level of hierarchy,
Volume 48, 2012
96 nl, is the number of points for cross-links, ten points for each valid, scientifically-acceptable cross-link.
In a simpler approach the score is the sum of individual scores allotted to: (i) the number of links per se: score of 1 per link
(ii) the number of levels or nestings in a hierarchy: score of 5 per level
(iii) the number of cross links: score of 2 or 10 per cross link depending on which version of the protocol one is using, and
(iv) the numbers of examples: score of 1 per example. This is summarised in the following equality:
S
cm=
n
l+
n
n+
n
c+
n
e (ii)Where:
cm is the concept map score
nl is the number of links, each carrying a weighting of 1 nn is the number of nestings, each carrying a weighting of 5
nc is the number of cross links, each carrying a weighting of 2 or 10 ne is the number of examples, each carrying a weighting of 1.
Whereas these summative approaches have the benefit of simplicity, there are two main causes of concern in its application. Firstly, although the concept map may provide an impression of structure and a complex structure may appear to indicate a rich understanding of the content relating to the concept map, the score merely reflects a measure of the complexity rather than the quality or richness. Unfortunately it does not provide any comment on the structure of the ideas expressed. Secondly, as mentioned before, students who have been trained to construct concept maps would acquire the scoring rules and aim to maximise their scores through cross-links. The rebuff to the second point might be to say that only the relevant cross-links would be scored. However, the issue of relevance is fraught with difficulties of interpretation and the decision to state that one link is more relevant than another becomes subjective although a scoring system should be objective.
Another scoring scheme was developed which takes account of (i) the hierarchical structure of the concept map, (ii) identified propositions, and (iii) the actual validity versus implied validity of concept map components (Schreiber & Abegg, 1991). This is summarised in the following equality:
X
=
[
x
æ
n b
(
+
c
)
]
+
b
c
(iii)Where:
X is the overall concept map score;
x is the initial tally of points awarded for recognition of hierarchical, propositional and valid constructs on a concept map;
n is the number of strands in a concept map;
b is the summed ratios of number of vocabulary terms to number of hierarchical levels per strand;
97 Although Schreiber & Abegg (1991) attempt to address the issue of taking into account the structure of the concept map, they also assume that the practitioner can determine which links are ‘valid’ and which are not.
Equation (i) is very closely related to Equation (ii) in that they are both summations. Aside from a difference in terminology the idea of interconnectedness has been added (Martin et al., 2000). In Equation (i), interconnectedness is represented as the ratio of the score of cross-links to the score of concepts. This is believed to take account of the ‘cohesiveness’ of the concept-map, whereas the score for cross-links perhaps only indicate a measure of ‘integration’ (Martin et al., 2000). However, whatever the nomenclature, the same problem arises of a student who, trained to construct concept maps, may not necessarily understand the concepts contained therein or have ‘ability’ in the topic. Another scoring procedure for scoring structural change (Pearsall, Skipper, & Mintzes, 1997) which bears some similarity to the basic idea behind Kinchin’s method of characterising the structure of concept maps (Kinchin, Hay, & Adams, 2000) is the second system described by (Martin et al., 2000)). In Martin et al.’s (2000) method, three structural changes in the knowledge frameworks are documented:
restructuring, when a concept label is added or deleted from the first hierarchical level of a concept map
accretion, when ten or more concept labels are added to a pre-existing concept
tuning, when any change to a pre-existing concept results in a modification of its meaning by the addition of constraining or constant variables.
In order to develop a scoring system, each map is compared to its successor (map 1 v. map 2; map 2 v. map 3; map 3 v. map 4; and so on if appropriate) and a score of 1 or 0 is recorded for each instance or non-instance of a structural change event. At length, each student receives a set of scores. Although important in their own right, these features of a concept mapping assessment system do not answer the problem of how one practitioner may decide certain links and/or cross-links are valid and others not so.
In response to problems such as validity and reliability, item response theory (IRT) models were employed for scoring concept maps (Liu, 1994). IRT models have been used for scoring and comparing students’ achievements even if they do not sit the same test (Hambleton, H., & Rogers, 1991). Traditional IRT models have been extended to graded IRT (Samejima, 1969), thus students’ responses to an item no longer have to be scored dichotomously as right or wrong: they can be graded as categories. When IRT is used for scoring concept maps, the four aspects of a concept map, i.e., links, hierarchies, cross-links, and examples (á la Novak & Gowin, 1984), are considered ‘test-items’, and the numbers of links, hierarchies, and examples are considered as students’ categorical responses to the ‘test-items’. By applying graded IRT models to students’ responses, it is possible to obtain students’ ability estimates (Liu, 1994). IRT scoring emphasises the overall structure of students’ concept maps instead of the ‘correctness’ of a specific concept map aspect.
Volume 48, 2012
98 Findings
The ‘problem of research’ stated earlier was that concept mapping had a number of inherent problems that reserchers tended to overlook such as the validity and reliability of conclusions drawn from the the structure / arrangement of the concept maps produced. It is proposed that RGA may move beyond such problems.
What Is the Relationship between RGA and Concept Mapping?
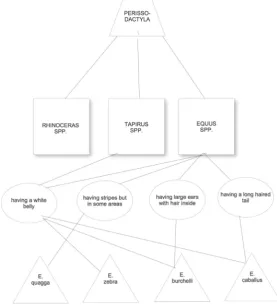
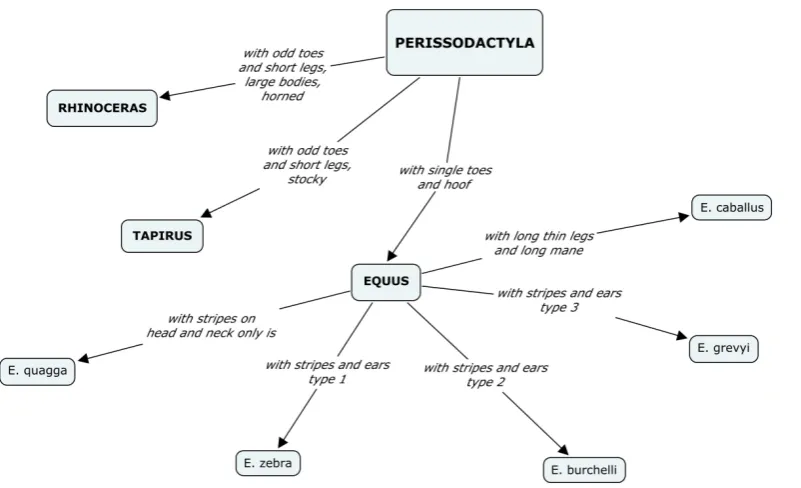
The main aim of this research is to better understand how RGA can be used to study students’ conceptual structures, especially those related to the sciences, and as an example of a concept, PERISSODACTYLA - (odd-toed mammals) was chosen. The technique provides diagrammatic representations of a learner’s conceptual framework in a consistent and rigorous manner. These diagrams can be interpreted as concept maps of a special kind (Lawson, 1997), and the technique allows the concept maps of two or more students to be compared systematically. This is one of the drawbacks of conventional concept mapping where concepts and sub-concepts can be arranged in a hierarchy linearly without labelled linkages (Figure 5) or radially with labelled arrows (Figure 6.) according to preference of the user; however, it is unclear if the user placed any significance on the arrangement, and they were merely being ‘tidy’. If the maps are free drawn, the problem of comparing one child’s concept map with another becomes near insurmountable. Proper comparisons can only be made if the same components are found in all the maps to be compared.
99
Figure 6: Radial concept map of concept: Perissodactyla drawn using Cmap-Tools™.
Volume 48, 2012
100 What is the Relationship between a Dendrogram Produced during RGA and Formal Scientifically Derived Taxonomic Trees?
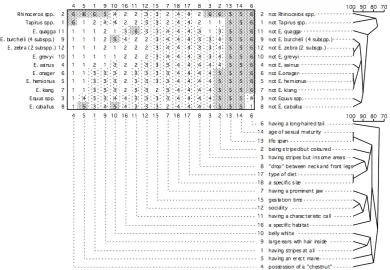
Using the FOCUS program in RepGrid™ (Figure 7.) a dendrogram is produced that has the initial appearance of a taxonomic tree, but is it really what it is? It is a diagram rating the similaritybetween the animals listed. The distance along the scale to the right hand side is a similarity rating e.g., E. onager, hemionus and kiang are clustered very closely since they are all species of wild ass; and E. burchelli, zebra and grevyi since they are all species of zebra. E. caballus, i.e., horse, is rated very close to Equus spp. - the generic ‘horse’ – even though all the animals beginning with the abbreviation E. for Equus are equids, i.e., horse-like animals. Rhinoceros and Tapirus are the next closely related cluster but they are relatively distantly related to each other; and have a greater perceptual, if not psychological, distance from horses, zebra and the like. Odd ones out are the extinct quagga, an animal which belongs close to zebra, and E. asinus, i.e., donkey, though this last species is perceptually closest to the wild asses.
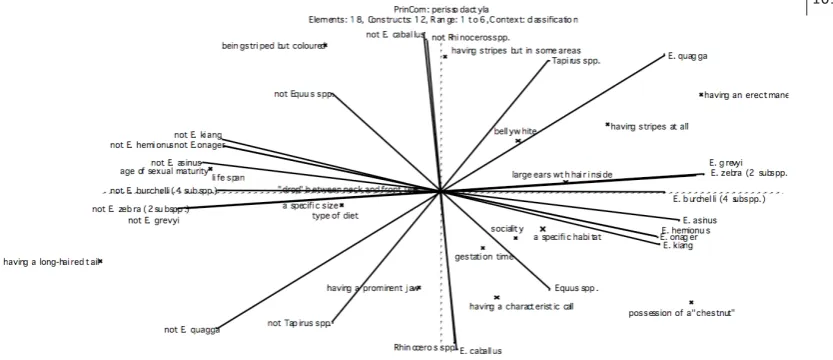
Using the same data, principal components analysis can be done to extract loadings which can be plotted on a Cartesian plane (Figure 8.). In RGA, the analysis is done twice so that the elements are plotted as points and the constructs as vectors. The distance of the element from the construct vector, which is polar, is related to the relevance that the participant thinks about this context, as was inferred earlier in the introduction to RGA
101
Figure 8: Principal components PRINCOM plot of the data from Figure 6.
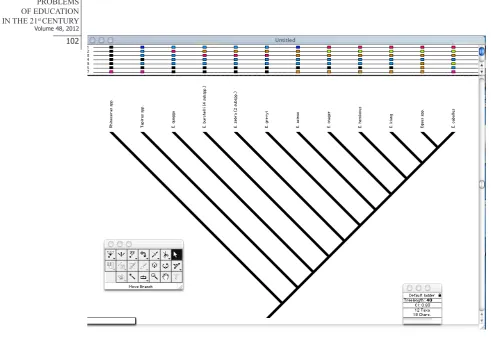
Volume 48, 2012 102
Figure 8: Cladogram for the animals using the original matrix to produce Figure 6.
The comparison of RGA matrices have been dealt with elsewhere (McCloughlin & Matthews, 2005, 2010), and here, suffice to say that since matrices may be treated as single entities in mathematics, the simplest way to compare two matrices is to subtract them and observe the results of subtractions. Two matrices could involve an expert and a novice to locate areas of improvement, and repeated to note development. There are also a number of ways to compare large numbers of matrices of 30, 40 or more individuals; one, is to average the matrices and analyze the resultant ’averaged’ matrix; averaging may be simple averaging of the matrices but more often a centering technique is used.
Conclusions
The principal components plot of RGA is a special sort of concept map, but more so since the distance between concepts has a mathematical significance. The principal components analysis plot locates constructs and their elements, thus rather than a simple propositional logic evident in simple concept maps, a multirelational logic inbuilt in the mathematics of principal components analysis becomes evident in principal components analysis plots. RGA provides for meaningful assessment rather than scoring whole concept maps ‘in the round’, a so-called ‘holistic’ score, or taking the four main components and scoring for ‘relevence’, by which is meant the ‘nearest to the educators idea’ as opposed to the relevence the student places on the concept.
103
intended or failure to grasp the ‘rules’ of the concept map rubric would result in biased scoring. RGA bypasses these issues, and a proper ‘holistic’ score is achieved by RGA, not in the form of a single integer but rather as a matrix. Thus the problem of quantification of concept mapping is addressed. The meaningful comparison of concept maps between students, or between students and educators is possible (whereas this has proven to be one of the more problematic areas in ‘classical’ concept mapping). Although, a number of positive things can be said about RGA, the one major drawback is that the principle components plots need to be interpreted by a person who has spent some time getting to know the nuances of the plots. However, it can be done relatively easy, although it is not ’intuitive’ unlike may things to do with computers.
The revised Irish curriculum for primary schooling may state that concept mapping is an appropriate form of assessment in science but it does not give guidance on how concept mapping is to be done, or indeed what sort should be employed. Certainly, much more research needs to be done in repertory grid analysis and its implications and applications in curricular research have yet to be fully explored.
References
Artiles, A. J., & Trent, S. C. (1990). Characteristics and constructs describing effective teachers. (ERIC
Document Reproduction Service No. ED 340 691).
Atkinson, H., & Bannister, S. (1998). Concept maps and annotated drawings, a comparative study of two assessment tools. Primary Science Review, 51, 3-5.
Bezzi, A. (1996). Use of Repertory Grids in Facilitating Knowledge Construction and Reconstruction in Geology. Journal of Research in Science Education, 33 (2), 179-204.
Buldu, M., & Buldu, N. (2010). Concept mapping as a formative assessment in college classrooms: measuring usefulness and student satisfaction. Procedia Social and Behavioral Sciences, 2 (2), 2099-2104.
Cuniliffe, A. (1994). How do science teachers become professionals? Implications of case studies of two beginning teachers. Paper presented at the annual meeting of the Australian Education Association, Queensland.
Derry, S. J., & Potts, M. K. (1998). How tutors model students: a study of personal constructs in adaptive thinking. American Educational Research Journal, 35 (1), 65-99.
Estes, W. K. (1996). Classification and Cognition (Vol. 22). Oxford: Oxford University Press.
Fang, Z. (1996). A review of research on teacher beliefs and practices. Educational Research, 38 (1), 47-65.
Fetherstonhaugh, T. (1994). Using the repertory grid to probe students’ ideas about energy. Research in Science and Technological Education, 12 (2), 117-127.
Fisher, K. M. (2000). Overview of concept mapping. In K. M. Fisher, J. H. Wandersee & D. E. Moody (Eds.), Mapping biology knowledge (Vol. 11). Dordrecht: Kluwer Academic Publishers. Fransella, F., Bell, R., & Bannister, D. (2004). A manual for repertory grid technique. Chichester: John
Wiley & Sons Ltd.
Hambleton, R. K., H., S., & Rogers, J. H. (1991). Fundamentals of item response theory. Newbury Park: Sage Publications.
Horton, P. B., McConney, A. A., Gallo, M., Woods, A. L., Senn, G. J., & Hamelin, D. (1993). An investigation of the effectiveness of concept mapping as an instructional tool. Science Education, 77, 95-111.
Kelly, G. (1992). The psychology of personal constructs: volume one – a theory of constructs (2nd Ed.).
London: Routledge.
Kinchin, I. M. (2000). Using concept maps to reveal understanding: a two-tier analysis. School Science Review, 81 (296), 41-46.
Volume 48, 2012
104 Kinchin, I. M., Hay, D. B., & Adams, A. (2000). How a quantitative approach to concept map analysis
can be used to aid learning by illustrating patterns of conceptual development. Educational Research, 42 (1).
Kubrusly, M. H. (1984). Does the teacher make a difference? A study on the correlation between learners’ perceptions of their teachers and their reactions to the topics covered during the course. (Master
of Arts), Lancaster.
Laffey, J. M., & Singer, J. (1997). Using mapping for cognitive assessment in project-based science.
Journal of Interactive Learning Research, 8 (3-4), 363-387.
Lawson, M. J. (1997). Concept mapping. In J. P. Keeves (Ed.), Educational research methodology and measurement: an international handbook (2nd Ed., pp. 291-296). Oxford: Pergamon.
Lim, H. (2011). Concept maps of Korean EFL student teachers’ autobiographical reflections on their professional identity formation. Teaching and Teacher Education, 27 (6), 969-981.
Liu, X. (1994, 8 April 1994). The validity and reliability of concept mapping as an alternative science assessment when item response theory is used for scoring. Paper presented at the Annual meeting of the American Education Research Association, New Orleans.
Markham, K., Mintzes, J. J., & Jones, M. G. (1994). The concept map a research and evaluation tool: further evidence of validity. Journal of Research in Science Teaching, 31, 91-101.
Martin, B. L., Mintzes, J. J., & Clavijo, I. E. (2000). Restructuring knowledge in biology: cognitive processes and metacognitive reflections. International Journal of Science Education, 22 (3), 303-323.
McCloughlin, T. J. J., & Matthews, P. S. C. (2005). The comparison of conceptual framework map data in repertory grid analysis. In R. Pintó & D. Couso (Eds.), Contributions of research to enhancing students’ interest in learning science. Barcelona: European Science Education Research
Association.
McCloughlin, T. J. J., & Matthews, P. S. C. (2009). Examining the structures of students’ concepts using
repertory grid analysis. Problems of Education in the 21st Century, 18 (18), 102-114.
McCloughlin, T. J. J., & Matthews, P. S. C. (2010). Comparing learners’ constructs using ‘socio-nets’: an application of Repertory Grid Analysis. Problems of Education in the 21st Century, 25, 87-98. McClure, J. R., & Bell, P. E. (1990). Effects of an environmental education-related STS approach
instruction on cognitive structures of preservice teachers. Pennsylvania State University.
Menmuir, J., & Christie, D. (1999). Encouraging professional reflection in early education. International Journal of Early Years Education, 7 (1), 61-75.
Miller, K. J., Koury, K. A., Fitzgerald, G. E., Hollingsead, C., Mitchem, K. J., & Tsai, H. (2009). Concept mapping as a research tool to evaluate conceptual change related to instructional methods.
Teacher Education and Special Education, 32 (4), 365-378.
Munby, H. (1984). A qualitative approach to the study of a teacher’s beliefs. Journal of Research in Science Teaching, 21 (1), 27-38.
Nespor, J. K. (1985). The role of beliefs in the practice of teaching: final report of the Teacher Beliefs Study. Austin, Texas: Research and Development Center for Teacher Education, Texas University at Austin.
Nicoll, G., Franscisco, J., & Nakleth, M. B. (2001). An investigation of the value of using concept maps in general chemistry. Journal of Chemical Education, 78 (8), 1111-1117.
Novak, J., & Gowin, D. B. (1984). Learning how to learn. New York: Cambridge University Press. Okebukola, P. A., & Jegede, O. J. (1989). Students’ anxiety towards and perception of difficulty of some
biological concepts under the concept-mapping heuristic. Research in Science and Technological Education, 7 (1), 85-92.
Oliver, K., & Raubenheimer, D. (2006). Lessons learned from unstructured concept mapping tasks. Paper
presented at the Second International Conference on Concept Mapping, San Jose, Costa Rica:
Universidad de Costa Rica.
Owens, J. E. (1988). Preservice secondary mathematics teachers’ constructs of mathematics and mathematics teaching. Paper presented at the annual meeting of the American Educational Research Association, New Orleans, Louisiana.
Pankratius, W. J. (1990). Building an organised knowledge base: concept mapping and achievement in
105
Pankratius, W. J., & Keith, T. M. (1987, 26th-27th March 1987). Building an organised knowledge base: concept mapping in secondary school science. Paper presented at the 35th annual meeting of the National Science Teachers’ Association, Washington DC.
Pearsall, N. R., Skipper, J. E. J., & Mintzes, J. J. (1997). Knowledge restructuring in the life sciences: a longitudinal study of conceptual change in biology. Science Education, 81, 193-215.
Robinson, W. R. (1999). A view of the science education research literature: concept map assessment of classroom learning. Journal of Chemical Education, 76 (9), 1179.
Roth, W. M., & Roychoudhury, A. (1993). The concept map as a tool for the collaborative construction of knowledge: a microanalysis of high school physics students. Journal of Research in Science Teaching, 50 (5), 503-534.
Ruiz-Primo, M. A., & Shavelson, R. J. (1996). Problems and issues in the use of concept maps in science assessment. Journal of Research in Science Teaching, 33 (6), 569-600.
Samejima, F. (1969). Estimation of latent ability using a response pattern of graded scores. Psychometrika monograph supplement, 4 (2).
Schreiber, D. A., & Abegg, G. L. (1991, 7-11 April). Scoring student-generated concept maps in introductory college chemistry. Paper presented at the Annual meeting of the National Association for Research in Science Teaching, Lake Geneva, WI.
Shaw, E. L. (1992). The influence of methods instruction on the beliefs of preservice elementary and
secondary science teachers. School Science and Mathematics, 92 (1), 14-22. Slater, P. (1964). The principal components of a repertory grid. London: Vincent Andrew.
Slater, P. (Ed.). (1977). The measurement of intrapersonal space by grid technique: dimensions of intrapersonal space (Vol. 2). London: Wiley.
Solas, J. (1992). Investigating Teacher and Student Thinking About the Process of Teaching and Learning Using Autobiography and Repertory Grid. Review of Educational Research, 62 (2), 205-225. Stow, W. (1997). Concept mapping – a tool for self assessment? Primary Science Review, 49, 12-15. Tisher, R. P. (1983, 14 May 198). Research in science education. Paper presented at the annual conference
of the Australian Science Educational Research Association, University of Waikato, New Zealand.
Walker, R. M., & Kleine, P. F. (1985). Constructs and style preferences of student teachers. Paper presented
at the meeting of the Rocky Mountain Educational Research Association, Law Cruces, New Mexico.
Wandersee, J. H. (1990). Concept mapping and the cartography of cognition. Journal of research in science teaching, 27 (10), 923-936.
Watson, F. (1994). Sixth form A Level students’ perceptions of the difficulty, intellectual freedom, social benefit and interest of science and arts subjects. Research in Science and Technological Education, 12 (1), 43-52.
Williams, S. R., Pack, M., & Khisty, K. L. (1997). Teachers’ beliefs about mathematics as assessed with repertory grid methodology. Paper presented at the Annual meeting of the North American Chapter of the International Group for the Psychology of Mathematics Education, Chicago,
Illinois.
Wilson, G., Nash, M., & Earl, G. (2010). Supporting students with language learning difficulties in secondary schools through collaboration: The use of concept maps to investigate the impact on teachers’ knowledge of vocabulary teaching. Child Language Teaching and Therapy, 26 (2), 163-179.
Wilson, J. M. (1993, August). The predictive validity of concept-mapping: relationships to measures of achievement. Paper presented at the Third International Seminar on Misconceptions and Educational Strategies in Science and Mathematics, Ithaca, Cornell University.
Volume 48, 2012
106 Advised by Hugh Gash, St. Patrick’s College, Dublin, Ireland
Received: September 30, 2012 Accepted: November 07, 2012
Thomas J.J. McCloughlin B.Sc., H.Dip.Ed., M.A. (Ed), Ph.D., Chartered Biologist & Lecturer in Sci-ence Education, Education Department, St. Patrick’s College (a college of Dublin City University), Drumcondra, Dublin 9, Ireland.
E-mail: [email protected]
Philip S.C. Matthews B.Sc., Ph.D., Emeritus Senior Lecturer in Science Education, School of Education, Trinity College (University of Dublin), College Green, Dublin 2, Ireland.