SOCIAL NETWORKING WEBSITES FROM
THE POINT OF VIEW OF UNIVERSITY
STUDENTS: A COMPARATIVE ANALYSIS
Vincentas Lamanauskas, Violeta Šlekienė, Loreta Ragulienė
University of Siauliai, Lithuania E-mail: v.lamanauskas@ef.su.lt, violeta@fm.su.lt, loretar@gmail.com
Dragos Iordache, Costin Pribeanu
National Institute for Research and Development in Informatics – ICI Bucharest, Romania
E-mail: pribeanu@ici.ro
Martin Bilek
University of Hradec Kralove, Czechia E-mail: martin.bilek@uhk.cz
Bulent Cavas
Dokuz Eylul University, Turkey E-mail: bulent.cavas@deu.edu.tr
Tatyana Mazurok
South Ukrainian National Pedagogical University named after K.D. Ushynsky, Ukraine
E-mail: pdpu@pdpu.edu.ua
Abstract
The use of social networking websites is becoming increasingly popular. While there are many reasons for this, the rapid spread of ICT is one of the most determining factors. New technologies provide various possibilities for education and in relation to social networking websites it is worth emphasizing their di-verse possibilities. The functionality of social networking websites is increasing, and this, in its own way, opens many possibilities for the consumers, a factor encouraging the usage of social networking sites. This research relates to the usage of social networking websites. The purpose of the research is to ascer-tain how university students from a range of European countries (Lithuania, Romania, Ukraine, Czech Republic, Turkey) use social networking websites; how they value them; what opinion they have about various social networking websites; what they know about them.
Volume 57, 2013
62 This education research was carried out in 2012-2013, recognizing that it is especially important to un-derstand the essential motives of using social networking websites, to analyze their probable advantages and disadvantages, to make some comparisons among students from the different countries.
The findings illustrated that the respondents knew a lot of social networking websites, with the most frequently visited and most popular being: You Tube, Facebook and Google+. The most important func-tions put forward by the university students were: communication, learning and exchanging information, texting. Gender differences were noted in the case of valuing social networking websites.
The university students pointed out the following SN website advantages: the possibility to communicate with many people at one time, (a)
to get in touch with the people seen long ago also with the friends and relatives living (b)
abroad,
the possibility to find proper information and share it, etc. (c)
The respondents also noted that SN website had disadvantages. They indicated: lack of information pub-licity, a lack of privacy, insecurity in presented data, possible lies, deceptions, etc.
Key words: comparative analysis,ICT,social networking websites, university students.
Introduction
it is obvious, that usage of social networking websites is constantly growing. an evident tendency is the expansion of snW possibilities in a business environment. if earlier it was
thought that usage of SNW is a waste of time, in the latter years business finds more and more
reasons why social networking websites ought to be used. this is marketing, service and prod-uct advertisement, new client search, cooperation development and so on. the other thing – the
amount and the flow of information will certainly not decrease and therefore information usage
and management in general, will remain urgent.
the other tendency is also rather distinct. social networking websites “move” into edu-cational space as well. however, a great number of problems exist here. nowadays teachers
(speaking especially about Lithuanian situation) are not properly prepared in ICT field. Though
ict usage competences are being improved in general, however considerable gaps remain, the shortage of understanding is felt on how to apply information technologies, what their abilities are to make teaching/learning process easier, more effective and interesting for children. ict in its own way changes rapidly, it is complicated to adjust to existing technological environment. on the other hand, nowadays children have grown up in ict surroundings, in the environment
more or less filled with technologies. This makes them more susceptible to technologies in
general. thus, teachers’ society can’t stay behind from ict development either. teachers them-selves have to be ready for unpredictable future (or at least hardly predictable) and to convey this attitude to children. a continuous demand to improve becomes the cornerstone for every member of society.
the problem of motivation to learn and improve remains urgent. despite education sci-ence achievements, motivation encouragement problem remains one of the most serious ones. however, watching children and teenagers’ activities using ict, especially social networking
websites, a very high motivation, a demand to use SNW are fixated. Thus, it is important to use
up that motivation in educational sense, in other words, to use up social networking websites abilities in educational sense. it is already a common and understandable thing in itself to speak about higher technologies in industry, medicine, pharmacy, agriculture and so on. somehow it is spoken very little or not spoken at all about higher technologies in education (pedagogy of higher technology).
Thus, the discussed field remains problematic. New, exhaustive, empiric researches are
communica-in the 21 century Volume 57, 2013 63
tion (usage index ui = 0.92, sd = 0.21), but also for general information search (ui = 0.91, sd = 0.19), for e – mail services (ui = 0.86, sd = 0.26), for listening to music (ui = 0.84, sd = 0.28), for studies (ui = 0.81, sd = 0.26) and other. it is natural, that speaking about social net-working websites, almost the biggest attention is paid to facebook. a. Joinson (2008) having carried out a research, discerned seven unique uses and gratifications: social connection, shared identities, content, social investigation, social network surfing and status updating. ellison et al (2007) studied the relationship between facebook use and the formation and maintenance of social capital. putnam (2000) distinguishes between bridging (weak ties) and bonding (close re-lationships) social capital. in a more recent work, Jung et al (2013) unpacked the dimensions of social capital and found out that some sub-dimensions play an important role in getting favors
from Facebook friends while the two dimensions (bridging and bonding) do not significantly
predict getting favors. as the researchers claim, facebook offers a lot of opportunities for deve-facebook offers a lot of opportunities for deve-lopers and educators too (awouters, palmaers, Veltjen, 2011).
problems lie not only in earlier discussed things. privacy questions are very important (acquisti, Gross, 2005; Kolek & saunders, 2008), and on the whole, social behavior, habits, technology usage (Gemmill, peterson, 2006) and other questions. Jesse p. mendez, J. curry, m. mwavita, K. Kennedy, K. Weinland, K. bainbridge (2009) investigated academic interac-tion problems in social networking websites. they established that students are using social networking websites rather productively, however mostly with the social communication pur-poses. in other words, a strategy remains to create personal relations and to develop them in virtual internet world, communicating through internet social networking websites. the usage of the newest technologies is rapidly growing, though such growth is rather different in vari-ous countries. for example, in Japan both teachers and lecturers are trying to use as much as possible of technologies in their direct work (taynton, 2012), however, it remains unclear how students perceive themselves as users of technology, the types of use of that technology and their perceptions. academic achievement question is urgent. rouis, s., limayem, m., salehi-sangari, e. (2011) ascertained, that the usage of social networking websites makes the academic
students’ achievements worse. He states, that personality traits and self-regulation significantly
determine the use of facebook. however, facebook use negatively affects students` academic performance. the research, carried out in czech republic also showed, that snW users are interested more in social parameters of such networking websites’ usage (e.g. to make friends, to establish new relationships and other) than academic question or problem solution (e.g., to
obtain missing information, advice, recommendation and other) (Karliček, Tomek, Hasprova,
Zamazalova, 2012). regardless doubts, social networking websites have plenty of unrevealed educational possibilities.
regardless of clearly common tendencies, it can be stated, that in different countries certain differences can be observed. the research, carried out in romania showed, that the mo-he mo-tivations that determine young people to use online social networks are psychological ones, and they are strongly related to the human needs of communication, socialization, being an active part of a group, or maintaining long distance friendships (baltaretu, balaban, 2010). a qualitati-ve research carried out later, showed similar motiqualitati-ves, in fact, because the most important things
for the consumers are: the idea of belonging as a member to a social network site is associated to the desire of integrating and being accepted in a group as equal, to the desire of not losing contact with friends, to the appropriate medium for setting up a new friendship and at the same time, relaxing, and having a great free time (marinescu, 2011). one of the newest researches, carried out in turkey shows, that most of the students did not trust virtual friendships, and did not like sharing photographs and political views online (turan, tinmaz, Goktas, 2013). on the other hand, research showed, that students` duration of use of social networks varies according to the type of foundation or state university, they do not prefer social networks for discovery and recognition of themselves and their peers etc. (Ünal Tutgun, Köroğlu, 2013).
thus, research object is the usage of social networking websites. Research purpose
uni-Volume 57, 2013
64 versity students use social networking websites, how they value them, what opinion they have
about various social networking websites, what they know about them. the main research
ques-tions are:
What social networking websites do students know and use most frequently?
•
What social networking website functions do students use and why?
•
do students like social networking websites and why?
•
What do students know about how social networking websites use published
per-•
sonal and other type of information?
What is students’ attitude to possibilities provided by social networking websites?
•
Methodology of Research
General Research Characteristics, Respondents
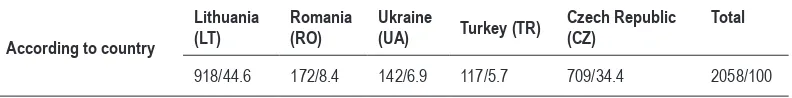
in 2012-2013, 2058 1-st to 5-th course university study students from 5 countries parti-cipated in the research (table 1). 918/44.6% of them from lithuania, 709/34.4% - from czech republic, 172/8.4% - from romania, 142/6.9% - from ukraine and 117/5.7% from turkey.
Table 1. Information about the respondents (N/%).
According to country
Lithuania
(LT) Romania (RO) Ukraine(UA) Turkey (TR) Czech Republic (CZ) Total
918/44.6 172/8.4 142/6.9 117/5.7 709/34.4 2058/100
Instrument
the authors’ prepared questionnaire was used in the research. 16 questions form the questionnaire Social networks. 3 questions in the questionnaire are allotted to establish the char-acteristics of the respondents, 5 open type questions. the 6th question was assigned to evaluate
the frequency of social networking website usage. 23 main networking websites are presented in the list. the 8th question was allotted to evaluate the functions of social networking websites
(e.g., communication, advertisement, friend search, information exchange and so on). also, 26 various type statements about social networking websites were presented and respondents were asked to evaluate them applying the interval likert scale (from “completely agree” to “com-pletely disagree”).
Statistical Data Analysis
in order to analyze research data, measures of descriptive statistics are applied (absolute
and relative frequencies, popularity or usage indexes (0 ≤ PI/UI ≤ 1), standard deviations. the
closer is PI/UI value to 1, the more important, more significant is the statement to the respon -dent, or respondent better approves of it. the ssps statistics batch is used as an instrument for data processing.
Research Results
ukrai-in the 21 century Volume 57, 2013 65
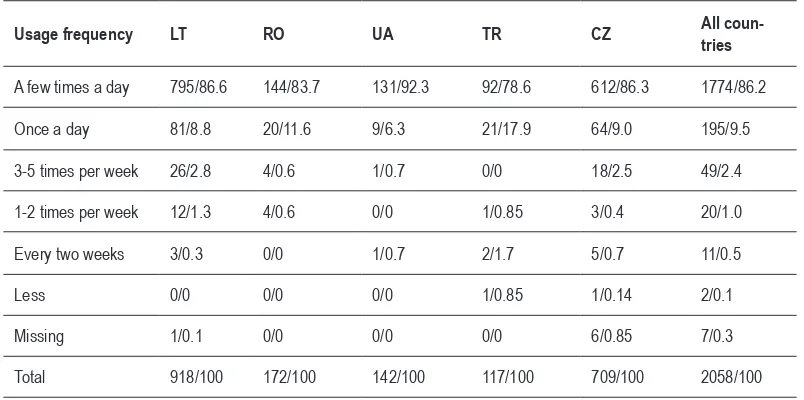
ne respondents (92.3%) use the internet a few times a day. though turkish students, as well, mostly use the internet a few times a day (78.6%), however, even 17.9% go on the internet once a day. only 13/0.6% of all country respondents use the internet every two weeks or less. it can be said, that nowadays youth cannot imagine their day without the internet.
Table 2. The frequency of using the internet (N/%). N = 2058
Usage frequency LT RO UA TR CZ All coun-tries
A few times a day 795/86.6 144/83.7 131/92.3 92/78.6 612/86.3 1774/86.2
Once a day 81/8.8 20/11.6 9/6.3 21/17.9 64/9.0 195/9.5
3-5 times per week 26/2.8 4/0.6 1/0.7 0/0 18/2.5 49/2.4
1-2 times per week 12/1.3 4/0.6 0/0 1/0.85 3/0.4 20/1.0
Every two weeks 3/0.3 0/0 1/0.7 2/1.7 5/0.7 11/0.5
Less 0/0 0/0 0/0 1/0.85 1/0.14 2/0.1
Missing 1/0.1 0/0 0/0 0/0 6/0.85 7/0.3
Total 918/100 172/100 142/100 117/100 709/100 2058/100
it was compared, how much time on avarage students spend on the internet during one visit. it appears, that during one visit on the internet the respondents mostly spend from half
an hour to two hours (table 3): between 10 to 30 min. - 493/24.0%, between 30 min. to 1h. -
534/25.9%, between 1 to 2 h. - 459/22.3% . 261/12.7% of the respondents spend more than 3 hours on the internet. 32.3% of czech respondents spend from 10 to 30 min. during one visit on the internet and 29.6% of ukraine respondents – even more than 3 hours.
Table 3. Students about the time spent on the internet (N/%). N = 2058
Time LT RO UA TR CZ All countries
Less than 10 min. 16/1.7 7/4.1 4/2.8 5/4.3 30/4.2 62/3.0
From10 to 30 min. 202/22.0 25/14.5 14/9.9 23/19.7 229/32.3 493/24.0
From 30 min. to 1h. 237/25.8 46/26.7 33/23.2 27/23.1 191/26.9 534/25.9
From 1 to 2h. 242/26.4 41/23.8 35/24.6 31/26.5 110/15.5 459/22.3
From 2 to 3 h. 118/12.9 24/14.0 14/9.9 10/8.5 70/9.9 236/11.5
More than 3 h. 101/11.0 29/16.9 42/29.6 21/17.9 68/9.6 261/12.7
Missing 2/0.2 0/0 0/0 0/0 11/1.6 13/0.6
Total 918/100 172/100 142/100 117/100 709/100 2018/100
Volume 57, 2013
66 social networking websites a few times a day and only 17.6% - once a day, and the rest 8.4%
of respondents – a few times per week or less. comparing with the usage of the internet, one
can think, that some of the respondents haven‘t created a personal profile in social networking
websites, however, they use the internet.
Table 4. The frequency of visiting social networking websites (N/%). N = 2058
Visiting frequency LT RO UA TR CZ All countries
A few times a day 490/53.4 71/41.3 105/73.9 371/52.3 1037/50.4
Once a day 240/26.1 51/29.7 25/17.6 178/25.1 494/24.0
3-5 times per week 34/3.7 9/5.2 9/6.3 31/4.4 83/4.0
1-2 times per week 53/5.8 30/17.4 1/0.7 32/4.5 116/5.6
Every two weeks 17/1.9 3/1.7 1/0.7 12/1.7 33/1.6
Less 59/6.4 8/4.7 1/0.7 54/7.6 122/5.9
Missing 25/2.7 0/0 0/0 117/100 31/4.4 173/8.4
Total 918/100 172/100 142/100 117/100 709/100 2058/100
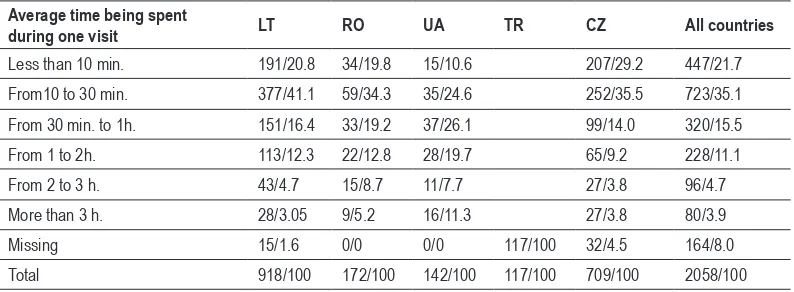
to the question How much time on avarage do you spend on the internet social networ-king websites during one visit ?- 723/35.1% of the respondents answered, that they spend bet-ween 10 min. and half an hour, and 447/21.7% - less than 10min. (table 5). most of the ukraine respondents (26.1%) spend from 30 min. to 1h. on social networking websites during one visit, and 11.3% - stay even more than 3 hours. comparing with the time spent on the internet in ge-neral, one can claim, that social networking websites occupy not a small part of the time spent on the internet. turkish respondents did not give answers to these questions.
Table 5. Students about the time being spent on the social networking websites (N/%). N = 2058
Average time being spent
during one visit LT RO UA TR CZ All countries
Less than 10 min. 191/20.8 34/19.8 15/10.6 207/29.2 447/21.7
From10 to 30 min. 377/41.1 59/34.3 35/24.6 252/35.5 723/35.1
From 30 min. to 1h. 151/16.4 33/19.2 37/26.1 99/14.0 320/15.5
From 1 to 2h. 113/12.3 22/12.8 28/19.7 65/9.2 228/11.1
From 2 to 3 h. 43/4.7 15/8.7 11/7.7 27/3.8 96/4.7
More than 3 h. 28/3.05 9/5.2 16/11.3 27/3.8 80/3.9
Missing 15/1.6 0/0 0/0 117/100 32/4.5 164/8.0
Total 918/100 172/100 142/100 117/100 709/100 2058/100
in the 21 century Volume 57, 2013 67
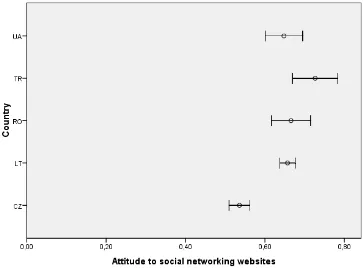
Table 6. Attitude to social networking websites. (PI – popularity index, 0 ≤ PI ≤ 1; SD - standard deviation)
Do you like social
network-ing websites? LTPI/SD ROPI/SD UAPI/SD TRPI/SD CZPI/SD TotalPI/SD
0.66/0.30 0.67/0.32 0.65/0.28 0.73/0.31 0.54/0.35 0.62/0.33
sn are most popular among turkish students (pi = 0.73, sd = 0.31) and a little less po-pular among czech students (pi = 0.54, sd = 0.35). the other country respondents‘ pi (lt, ro, ua) are very close to average. having analysed opinion distribution, one can see (figure 1), that czech and lithuanian respondent evaluation has the least deviation from average. turkish respondents‘ popularity index is the highest, however, their opinion distribution is the biggest of all.
Figure 1: Evaluation of social networking websites.
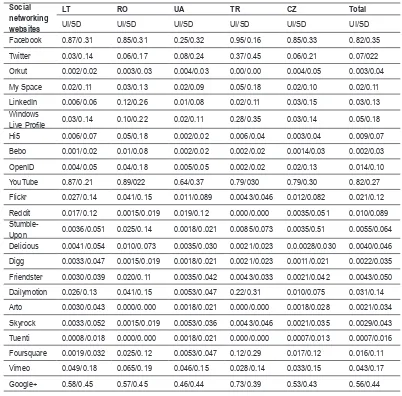
23 social networking website names were presented in the questionnaire and it was in-teresting to know, how often the respondents take part in them. having made a generalization, one can put forward 3 main social networking websites (table 7), which are mostly visited by the respondents of the countries involved in the research. the most visited online social
net-works are: Facebook (pi = 0.82, sd = 0.35), YouTube (pi = 0.82, sd = 0.27) and Google+ (pi
= 0.56, SD = 0.44). In these internet sites every consumer can create his profile, find friends,
communicate in interest groups and so on. all other social networking websites are visited rare-ly, however, there isn‘t a sn which was not known by at least a few respondents.
analysis in terms of countries showed, that turkish students are those who mostly use different sn. apart from the mentioned main social networking websites, they use sn very
Volume 57, 2013
68 Live Profile (turkey pi = 0.28, sd = 0.35), Dalymotion (turkey pi = 0.22, sd = 0.31), Fours-guare (turkey pi = 0.12, sd = 0.29). facebook is the most popular among turkish respondents (pi = 0.95, sd = 0.16), and respondents of ukraine more favourably participate in YouTube
(pi = 0.64, sd = 0.37), than in Facebook (pi = 0.25, sd = 0.32). lithuanian and romanian respondents similarly highly value both Facebook (lithuanian pi = 0.87, sd = 0.31, romanian pi = 0.85, sd = 0.31), and You Tube (lithuanian pi = 0.87, sd = 0.21, romanian pi = 0.89, sd = 022). czech respondents more highly value facebook (pi = 0.85, sd = 0.33), than You Tube (pi = 0.79, sd = 0.30). Google+ is valued by turkish respondents best (pi = 0.73, sd = 0.39), and it has the least popularity among Ukrainian respondents (pi = 0.46, sd = 0.44). the other countries‘ Google+ pi > 0.50. romanian respondents a little better know LinkedIn
(pi = 0.12, sd = 0.26) and Windows Live Profile (pi = 0.10, sd = 0.22) . the respondents of each country noted not a few national sn. especially active participants in them are ukrainian respondents.
Table 7. Students about participation in social networking websites: usage frequency (UI – usage index, , 0 ≤ UI ≤ 1;SD - standard deviation)
Social networking websites
LT RO UA TR CZ Total
UI/SD UI/SD UI/SD UI/SD UI/SD UI/SD
Facebook 0.87/0.31 0.85/0.31 0.25/0.32 0.95/0.16 0.85/0.33 0.82/0.35
Twitter 0.03/0.14 0.06/0.17 0.08/0.24 0.37/0.45 0.06/0.21 0.07/022
Orkut 0.002/0.02 0.003/0.03 0.004/0.03 0.00/0.00 0.004/0.05 0.003/0.04
My Space 0.02/0.11 0.03/0.13 0.02/0.09 0.05/0.18 0.02/0.10 0.02/0.11
LinkedIn 0.006/0.06 0.12/0.26 0.01/0.08 0.02/0.11 0.03/0.15 0.03/0.13
Windows
Live Profile 0.03/0.14 0.10/0.22 0.02/0.11 0.28/0.35 0.03/0.14 0.05/0.18
Hi5 0.006/0.07 0.05/0.18 0.002/0.02 0.006/0.04 0.003/0.04 0.009/0.07
Bebo 0.001/0.02 0.01/0.08 0.002/0.02 0.002/0.02 0.0014/0.03 0.002/0.03
OpenID 0.004/0.05 0.04/0.18 0.005/0.05 0.002/0.02 0.02/0.13 0.014/0.10
YouTube 0.87/0.21 0.89/022 0.64/0.37 0.79/030 0.79/0.30 0.82/0.27
Flickr 0.027/0.14 0.041/0.15 0.011/0.089 0.0043/0.046 0.012/0.082 0.021/0.12
Reddit 0.017/0.12 0.0015/0.019 0.019/0.12 0.000/0.000 0.0035/0.051 0.010/0.089
Stumble-Upon 0.0036/0.051 0.025/0.14 0.0018/0.021 0.0085/0.073 0.0035/0.51 0.0055/0.064
Delicious 0.0041/0.054 0.010/0.073 0.0035/0.030 0.0021/0.023 0.0.0028/0.030 0.0040/0.046
Digg 0.0033/0.047 0.0015/0.019 0.0018/0.021 0.0021/0.023 0.0011/0.021 0.0022/0.035
Friendster 0.0030/0.039 0.020/0.11 0.0035/0.042 0.0043/0.033 0.0021/0.042 0.0043/0.050
Dailymotion 0.026/0.13 0.041/0.15 0.0053/0.047 0.22/0.31 0.010/0.075 0.031/0.14
Arto 0.0030/0.043 0.000/0.000 0.0018/0.021 0.000/0.000 0.0018/0.028 0.0021/0.034
Skyrock 0.0033/0.052 0.0015/0.019 0.0053/0.036 0.0043/0.046 0.0021/0.035 0.0029/0.043
Tuenti 0.0008/0.018 0.000/0.000 0.0018/0.021 0.000/0.000 0.0007/0.013 0.0007/0.016
Foursquare 0.0019/0.032 0.025/0.12 0.0053/0.047 0.12/0.29 0.017/0.12 0.016/0.11
Vimeo 0.049/0.18 0.065/0.19 0.046/0.15 0.028/0.14 0.033/0.15 0.043/0.17
in the 21 century Volume 57, 2013 69
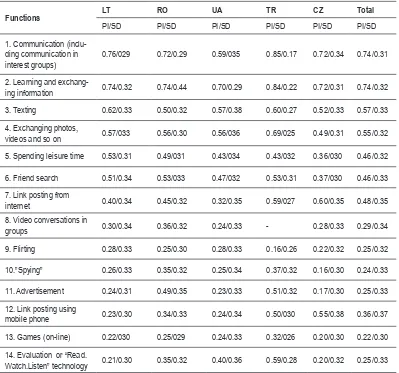
the respondents were asked to evaluate social networking website functions according to their importance for them. 14 functions were presented and they had to be evaluated using
five range scale from completely not important to very important. Popularity index was calcu -lated (table 8).
Table 8. Social networking website function importance PI – popularity index, 0 ≤ PI ≤ 1;SD - standard deviation
Functions LT RO UA TR CZ Total
PI/SD PI/SD PI/SD PI/SD PI/SD PI/SD
1. Communication (inclu-ding communication in
interest groups) 0.76/029 0.72/0.29 0.59/035 0.85/0.17 0.72/0.34 0.74/0.31
2. Learning and
exchang-ing information 0.74/0.32 0.74/0.44 0.70/0.29 0.84/0.22 0.72/0.31 0.74/0.32
3. Texting 0.62/0.33 0.50/0.32 0.57/0.38 0.60/0.27 0.52/0.33 0.57/0.33
4. Exchanging photos,
videos and so on 0.57/033 0.56/0.30 0.56/036 0.69/025 0.49/0.31 0.55/0.32
5. Spending leisure time 0.53/0.31 0.49/031 0.43/034 0.43/032 0.36/030 0.46/0.32
6. Friend search 0.51/0.34 0.53/033 0.47/032 0.53/0.31 0.37/030 0.46/0.33
7. Link posting from
internet 0.40/0.34 0.45/0.32 0.32/0.35 0.59/027 0.60/0.35 0.48/0.35
8. Video conversations in
groups 0.30/0.34 0.36/0.32 0.24/0.33 - 0.28/0.33 0.29/0.34
9. Flirting 0.28/0.33 0.25/0.30 0.28/0.33 0.16/0.26 0.22/0.32 0.25/0.32
10.”Spying” 0.26/0.33 0.35/0.32 0.25/0.34 0.37/0.32 0.16/0.30 0.24/0.33
11. Advertisement 0.24/0.31 0.49/0.35 0.23/0.33 0.51/0.32 0.17/0.30 0.25/0.33
12. Link posting using
mobile phone 0.23/0.30 0.34/0.33 0.24/0.34 0.50/030 0.55/0.38 0.36/0.37
13. Games (on-line) 0.22/030 0.25/029 0.24/0.33 0.32/026 0.20/0.30 0.22/0.30
14. Evaluation or “Read.
Watch.Listen” technology 0.21/0.30 0.35/0.32 0.40/0.36 0.59/0.28 0.20/0.32 0.25/0.33
the most important fnctions for all country respondents are communication (pi = 0.74, sd = 0.32) learning and exchanging information (pi = 0.74, sd = 0.32). less popular is texting (pi = 0.57, sd = 0.33), exchanging photos, videos and so on (pi = 0.55, sd = 0.32), link pos-ting from the internet (pi = 0.48, sd = 0.35), spending leisure time in the internet (pi = 0.46, sd = 0.32) and friend search (pi = 0.46, sd = 0.33). the lowest (negative) evaluation get the
games (on-line) (PI = 0.22, SD = 0.30), advertisement (PI = 0.25, SD = 0.33), flirting in social
networking websites (pi = 0.25, sd = 0.32).
Volume 57, 2013
70 that function as well: Lithuania (PI = 0.74, SD = 0.32), Romania(PI = 0.74, SD = 0.44), Czech
republic (pi = 0.72, sd = 0.31), ukraine (pi = 0.70, sd = 0.29). czech respondents are the le-ast interested in friend search (pi = 0.37, sd = 0.30), and turkish and romanian representatives are mostly interested in advertisement. turkey (pi = 0.51, sd = 0.32) and romania (pi = 0.49, sd = 0.35). advertisement function for czech representatives is the least important (pi = 0.17, sd = 0.30). Evaluation or “Read.Watch.Listen” technology is the most important for turkish respondents (pi = 0.59, sd = 0.28), the youth of other countries are interested in it less.
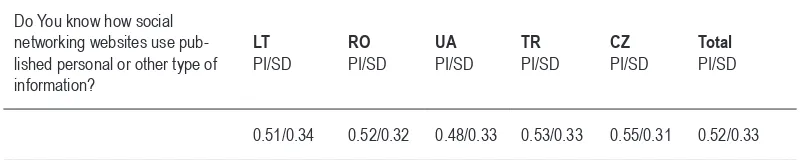
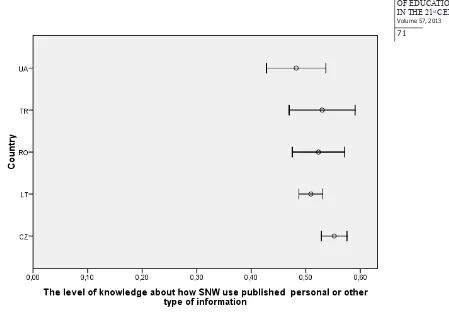
the consumers‘ actions in social networking websites are public, unless the consumer indicates privacy levels (show to everybody, to friends or only to himself). therefore, the res-pondents were asked whether they know, how social networking websites use published perso-nal and other type of information. the answers showed, that the respondents of all countries in-volved in the research, only partly (pi = 0.52, sd = 0.33) know about information usage (table 9). the biggest popularity index is of czech republic (pi = 0.55, sd = 0.31), and the smallest one – of ukraine (pi = 0.48, sd = 0.33).
Table 9. The level of knowledge about how SNW use published personal or other type of information. (PI – popularity index, 0 ≤ PI ≤ 1; SD - standard deviation)
Do You know how social networking websites use pub-lished personal or other type of information?
LT
PI/SD ROPI/SD UAPI/SD TRPI/SD CZPI/SD TotalPI/SD
0.51/0.34 0.52/0.32 0.48/0.33 0.53/0.33 0.55/0.31 0.52/0.33
in the 21 century Volume 57, 2013 71
Figure 2: Knowledge about SNW published information usage.
the respondents were asked to express their opinion about people who use social net-working websites. four statements were formulated and respondents were asked to evaluate them (table 10). the statement - enjoying communication (pi = 0.78, sd = 0.20) has the most positive position. the highest pi is of czech respondents (pi = 0.84, sd = 0.16), the lowest – of ukraine (pi = 0.60, sd = 0.26). further, people are indicated who are searching for novelties (pi = 0.74, sd = 0.21), enjoying new technologies (pi = 0.69, sd = 0.22). the statement that
these are people, having communication difficulties in real life ( PI = 0.62, SD = 0.28) has the
least positive view. ukrainian respondents gave a very low evaluation of this (pi = 0.43, sd = 0.31).
Table 10. Students about people tending to use social networking websites. (PI – popularity index, 0 ≤ PI ≤ 1;SD - standard deviation)
Evaluate these statements about people, tending to use social networks
LT RO UA TR CZ Total
PI/SD PI/SD PI/SD PI/SD PI/SD PI/SD
1. Enjoying communication 0.78/0.19 0.80/0.19 0.60/0.26 0.84/0.16 0.78/0.20
2. Enjoying new technologies 0.71/0.21 0.79/0.18 0.58/0.25 0.66/0.22 0.69/0.22
3. Searching for novelties 0.71/0.22 0.64/0.20 0.70/0.26 - 0.80/0.18 0.74/0.21
4. Having communication
Volume 57, 2013
72 the respondents were asked, whether participation in social networking websites
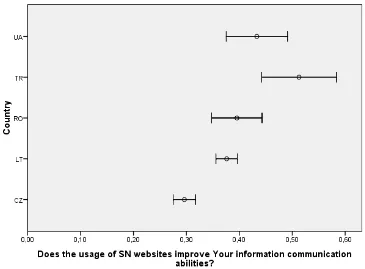
im-proves their information communication abilities. They could answer: yes, it imim-proves; partly improves; has no influence. the respondents‘ analysis of the countries involved in the research, showed (table11), that the most positive evaluation of the relationship improvement between participation in the social networks and information communication abilities was of turkish respondents (pi = 0.51, sd = 0.39). the slightest relationship between sn and information abi-lities was noticed by czech respondents (pi = 0.30, sd = 0.28). it can be seen, that respondents not very highly value that sn improve their information communication abilities.
Table 11. Students‘ opinion about SN and information communication abilities
(PI – popularity index, 0 ≤ PI ≤ 1; SD - standard deviation)
Does the usage of SN websites improve Your information communica-tion abilities?
LT
PI/SD ROPI/SD UAPI/SD TRPI/SD CZPI/SD TotalPI/SD
0.38/0.31 0.40/0.32 0.43/0.35 0.51/0.39 0.30/0.28 0.36/0.32
opinion distribution of this question around the mean value analysis (figure 3) shows, that the smallest spread is of czech and lithuanian respondent opinion, though their positive views are not high (czech - pi = 0.30, sd = 0.28; lithuanian - pi = 0.38, sd = 0.31). and tur-kish respondents‘ opinion distribution is the biggest, however, their pi value is the highest of all. not a small opinion variance is noticed between czech and ukraine respondents.
in the 21 century Volume 57, 2013 73
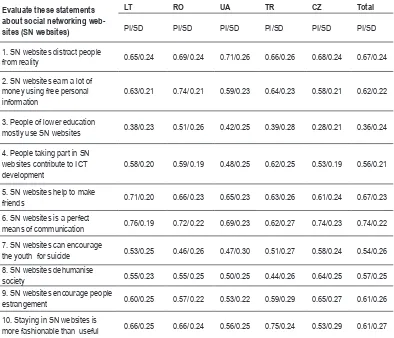
social networking websites reveal the participants‘ activity, sociality, because the main information is this, what the consumer wrote, what his mood was, who he started dating, who he started going out with, what photos installed, how he commentates, who he joined and so on. 26 statements about social networks were presented in the questionnaire and the respondents were asked to evaluate them in the 5 range scale from completely agree to completely disagree.
each country respondents involved in the research rather highly value social networks
in various aspects and the majority of all country evaluations are similar (fluctuate at about ave -rage) (table 12). almost all people of every country, having participated in the questionnaire, use social networks and accentuate that sn is a perfect means of communication (pi = 0.74, sd
= 0.22) and is a good possibility to find out various news (PI = 0.74, SD = 0.22). However, at
the same time they emphasize, that communication in virtual space will never substitute direct peoples‘ relations (pi = 0.88, sd = 0.24), that most people belonging to SN websites don‘t know, who they share information with about themselves, their hobbies and life (pi = 0.71, sd = 0.23) and, that information conveyed by SN websites can have negative influence on teena -gers‘ behaviour and health (pi = 0.71, sd = 0.21). a little less worry about communication in
virtual space (PI = 0.78, SD = 0.24) and about SN negative influence on teenagers‘ behaviour
and health (pi = 0.67, sd = 0.21) expressed respondents from romania; and about not having knowledge about personal information spread – respondents from ukraine (pi = 0.65, sd =
0.21). These are five out of presented 26 most significantly expressed, contrary and supplemen -ting one another statements about sn.
Table 12. Students‘ opinion about social networking websites. (PI – popularity index, 0 ≤ PI ≤ 1;SD - standard deviation)
Evaluate these statements about social networking web-sites (SN webweb-sites)
LT RO UA TR CZ Total
PI/SD PI/SD PI/SD PI/SD PI/SD PI/SD
1. SN websites distract people
from reality 0.65/0.24 0.69/0.24 0.71/0.26 0.66/0.26 0.68/0.24 0.67/0.24
2. SN websites earn a lot of money using free personal
information 0.63/0.21 0.74/0.21 0.59/0.23 0.64/0.23 0.58/0.21 0.62/0.22
3. People of lower education
mostly use SN websites 0.38/0.23 0.51/0.26 0.42/0.25 0.39/0.28 0.28/0.21 0.36/0.24
4. People taking part in SN websites contribute to ICT
development 0.58/0.20 0.59/0.19 0.48/0.25 0.62/0.25 0.53/0.19 0.56/0.21
5. SN websites help to make
friends 0.71/0.20 0.66/0.23 0.65/0.23 0.63/0.26 0.61/0.24 0.67/0.23
6. SN websites is a perfect
means of communication 0.76/0.19 0.72/0.22 0.69/0.23 0.62/0.27 0.74/0.23 0.74/0.22
7. SN websites can encourage
the youth for suicide 0.53/0.25 0.46/0.26 0.47/0.30 0.51/0.27 0.58/0.24 0.54/0.26
8. SN websites dehumanise
society 0.55/0.23 0.55/0.25 0.50/0.25 0.44/0.26 0.64/0.25 0.57/0.25
9. SN websites encourage people
estrangement 0.60/0.25 0.57/0.22 0.53/0.22 0.59/0.29 0.65/0.27 0.61/0.26
10. Staying in SN websites is
Volume 57, 2013
74 11. Communication in virtual
space gives bigger opportunities 0.61/0.22 0.59/0.22 0.43/0.27 0.58/0.26 0.56/0.27 0.57/0.25
12. Constant staying in virtual environment causes damage to
person‘s socialization 0.67/0.24 0.67/0.25 0.63/0.24 0.77/0.23 0.74/0.23 0.70/0.24
13. Communication in virtual space will never substitute direct
peoples‘ relations 0.89/0.17 0.78/0.24 0.85/0.22 0.83/0.23 0.89/0.18 0.88/0.19
14. Most people belonging to SN websites don‘t know, who they share information with about themselves,their hobbies and life
0.72/0.23 0.70/0.22 0.65/0.21 0.74/0.22 0.71/0.23 0.71/0.23
15. SN websites is a reliable
computer device 0.45/0.22 0.60/0.20 0.44/0.20 0.39/0.36 0.41/0.21 0.44/0.22
16. Information conveyed by SN websites can have negative
influence on teenagers‘ behaviour
and health
0.72/0.21 0.67/0.21 0.68/0.23 0.69/0.19 0.73/0.21 0.71/0.21
17. SN websites make negative
influence on pupils‘ marks and
ability to concentrate 0.73/0.21 0.67/0.23 0.65/0.26 0.71/0.20 0.69/0.22 0.70/0.22
18. One can find a lot of useful
information in SN websites 0.67/0.23 0.72/0.19 0.67/0.20 0.71/0.20 0.74/0.22 0.70/0.22
19. SN websites is a good means
of spending your leisure time 0.62/0.26 0.60/0.25 0.50/0.27 0.52/0.26 0.31/0.25 0.50/0.29
20. SN websites is good
possibil-ity to find out various news 0.75/0.21 0.76/0.21 0.71/0.23 0.75/0.20 0.67/0.20 0.72/0.21
21. SN websites is a good thing for those, who don‘t perceive
what privacy is 0.61/0.25 0.58/0.26 0.50/0.22 0.51/0.26 0.62/0.23 0.60/0.25
22. This is a good opportunity to learn, improve, communicate with the whole world without going out from home
0.66/0.23 0.65/0.25 0.59/0.27 0.57/0.27 0.57/0.26 0.62/0.25
23. SN websites is a wonderful
means of relaxation 0.60/0.25 0.65/0.23 0.54/0.25 0.52/0.27 0.49/0.26 0.56/0.26
24. SN websites provide
nation-al and internationnation-al knowledge 0.63/0.23 0.68/0.20 0.40/0.26 0.70/0.22 0.65/0.23 0.63/0.24
25. SN websites is a perfect
means for self-advertisement 0.73/0.22 0.69/0.21 0.64/0.22 0.67/0.23 0.50/0.27 0.64/0.26
26. SN websites save time, allow
in the 21 century Volume 57, 2013 75
here, also are the statements rather highly evaluated by all countries, expressing
positi-ve and negatipositi-ve attitude towards SNW:
One can find a lot of useful information in SN websites
• (pi = 0.70, sd = 0.22), SN
websites help to make friends (pi = 0.67, sd = 0.23), SN websites is a perfect me-ans for self-advertisement (pi = 0.64, sd = 0.26) (though ukrainian representatives doubt about this (pi = 0.50, sd = 0.27).
Constant staying in virtual environment causes damage to person‘s socialization •
(pi = 0.70, sd = 0.24), SN websites distract people from realityST (pi = 0.67, sd = 0.24),SN websites earn a lot of money using free personal information (pi = 0.62, sd = 0.22), Staying in SN websites is more fashionable than useful (pi = 0.61, sd = 0.27),SN websites encourage people estrangement (pi = 0.61, sd = 0.26). this shows, that sn evaluation is not and cannot be unambiguous, that social networks
are a multidimentional construct, covering both positive and negative influence on personality
and her socialization.
analysis, regarding countries, having participated in the research, showed, that lithu-anian (pi = 0.62, sd = 0.26) and romlithu-anian (pi = 0.60, sd = 0.25) respondents are convinced, that sn is a good means of spending your leisure time. turkish (pi = 0.52, sd = 0.26) and ukrainian (pi = 0.50, sd = 0.27) respondents doubt in this, and czech respondents do not agree with the statement, that SNis a wonderful means of relaxation (pi = 0.31, sd = 0.25). the opi-nions of the countries also differed evaluating the statement, that SNwebsites provide national and international knowledge. this statement got the highest evaluation by turkish respondents (pi = 0.70, sd = 0.22). romanian (pi = 0.68, sd = 0.20), czech (pi = 0.65, sd = 0.23) and li-thuanian (pi = 0.63, sd = 0.23) respondents have no doubt in this as well. however, ukrainian representatives expressed negative position in this aspect (pi = 0.40, sd = 0.26). they doubt and do not agree, that sn websites provide national and international knowledge. romanian representatives state, that sn websites is a reliable computer device (pi = 0.60, sd = 0.20), though respondents of other countries doubt in this or do not agree (pi = 0.44, sd = 0.22). a similar differenciation of opinions is noticed of the statement People of lower education mostly use SN. only romanian respondents expressed doubt in this statement (pi = 0.51, sd = 0.26). the other countries‘ (lt, ua, tr, cZ) representatives have negative attitude in this aspect (pi = 0.36, sd = 0.24). they are convinced, that sn consumers are not of a lower intellect.
It is obvious, that SN both positive and negative influence on every personality and on
all society is not an unambiguous phenomenon. therefore, its evaluation cannot be unambi-guous as well. it is determined by various reasons, which need to be differentiated and resear-ched more exhaustively.
Conclusions
it has been stated, that the majority of respondents of all countries involved in the re-search use the internet a few times a day. also, more than half of them visit social networking websites a few times a day, and even three quarters of ukrainian respondents do this. it is obvious, that using the internet and visiting social networking websites are closely and directly related things.
social networking websites are popular among the youth of the countries, having
par-ticipated in the research: SNW are the most popular among Turkish respondents and the least
popular among czech ones. sn evaluations of other country respondents (lt, ro, ua) are close to average.
it has been stated, that even though respondents know quite many social networking
websites, the most frequently visited and the most popular are three: You Tube, Facebook,
Google+. different sn mostly use turkish respondents, who, without mentioned main social networking websites, participate in the other sn, poorly known in the other countries (Twitter,
Volume 57, 2013
76 the most important snW functions for all country respondents are communication and
learning and exchanging information. Less important are: texting, spending leisure time in the
internet, friend search, exchanging photos, videos and so on. Games (on-line), advertisement
and flirting in SN get the lowest (negative) evaluation. Evaluation or “Read.Watch.Listen” technology is the most important for turkish respondents. the other countries‘ youth are inte-rested less in this.
it is worrying, that all country, having participated in the research, respondents only partly know how social networking websites use published personal and other type of infor-mation.
it has been stated, that all country, having participated in the research, respondents are
active social network users and discern both positive and negative influence on personality and her socialization:
one can claim, that all country, having participated in the research, respondents
rat-•
her highly value social networks and acknowledge their usefulness both for commu-nication and leisure and for social and obtaining information needs.
respondents are rather strongly convinced, that snW distract people from reality,
•
make real relationship among people weaker, encourage people estrangement, even encourage for suiside.
the analysis of the respodents‘ opinion about sn according to countries, having taken
part in the research, showed:
that lithuanian and romanian respondents are convinced, that snW is a good
•
means of spending leisure time. turkish and ukrainian respondents doubt in this, and czech ones – do not agree with this statement.
the statement, that
• SNW provide national and international knowledge, was evalua-ted at the highest by Turkish respondents, romanian, czech and lithuanian respon-dents do not doubt in this, and ukrainian representatives doubt or do not agree. romanian representatives state, that sn is a reliable computer device, though
res-•
pondents from other countries doubt in this or do not agree.
such not unambiguous snW evaluation position is interpreted as positive. on the other hand, it is obvious, that educational potential of social networking websites in students‘ evalu-ation is expressed rather weakly and it raises a grounded worry.
Note
this paper was presented at the ioste eurasia regional symposium & brokerage event horizon 2020-eu framework programme for research and innovation, october 30-november
1, 2013, Antalya, Turkey. It was approved by the Symposium scientific committee.
References
Acquisti, A., & Gross, R. (2005). Imagined communities: Awareness, information sharing, and privacy
on the Facebook. in Proceedings of the 6th Workshop on Privacy Enhancing Technologies, (ed.) p. Golle & G. Danezis, 36-58. Cambridge: Robinson College.
awouters, V., palmaers, d., Veltjen, a. (2011).2Facebook or not 2Facebook in Education: that’s the ques
-tion? Teaching and Learning on Facebook. In.: Splet izobraževanja in raziskovanja z IKT / En -abling education and research with ICT(Mednarodna konferenca Splet izobraževanja in razisko -vanja z iKt - sirikt2011, Kranjska Gora, 13. - 16. april 2011 / the 5th international conference
SIRikt, 13th - 16th April 2011). Ljubljana: Mi ka, p. 148-151.
baltaretu, c. m., balaban, d. c. (2010). motivation in using social network sites by romanian stu-dents. a Qualitative approach. Journal of Media Research, 6, 67-74.
Ellison N.B., Steinfield C., Lampe C. (2007) The Benefits of Facebook ‘‘Friends:’’ Social Capital and
in the 21 century Volume 57, 2013 77
Gemmill, E., & Peterson, M. (2006). Technology use among college students: Implications for Student
affairs professionals. NASPA Journal, 43 (2), 280-300.
Joinson, a. n. (2008). ‘looking at’, ‘looking up’ or ‘Keeping up with’ people? motives and uses of facebook. in. CHI 2008 Proceedings · Online Social Networks (april 5-10, 2008). florence, italy, p. 1027-1036.
Jung, y., Gray r, lampe c., ellison n. b. (2013) favors from facebook ‘unpacking dimensions of social capital. Proceedings of CHI 2013, 1143-1168, acm.
Karliček, M., Tomek, I., Hasprova, M., Zamazalova, M. (2012). Social Networking Sites in the Czech Republic: an Empirical Study. Management & Marketing Challenges for the Knowledge Society, 7 (1), 15-28.
Kolek, E.A. & Saunders, D. (2008). Online disclosure: An empirical examination of undergraduate Face
-book profiles. NASPA Journal, 45 (1).
lamanauskas, V., Šlekienė, V., Ragulienė, l. (2010). Lietuvos universitetų studentų patirtis naudoti in -formacines komunikacines technologijas. Gamtamokslinis ugdymas / Natural Science Education, 3 (29), 14-27.
marinescu, V. (2011). the youth of social networks uses and the social networks for youth a com-parison between the uses of facebook and hi5 among romanian youth. Проблеми на постмо -дерността, Том i, Брой 2. retrieved october 04, 2013, from http://ppm.swu.bg/media/32065/ marinescu,%20v.%20the%20youth%20of%20social%20networks%20uses%20and%20the%20 social%20networks%20for%20youth%20a%20comparison%20between%20the%20uses%20 of%20facebook%20and%20hi5%20among%20romanian%20youth.pdf
mendez, Jesse p., curry, J., mwavita, m., Kennedy, K., Weinland, K., bainbridge, K. (2009). to friend
or Not to Friend: Academic Interaction on Facebook. International Journal of Instructional Technology & Distance Learning, 6 (9). retrieved on 20 april 2012 from, http://www.itdl.org/
Journal/sep_09/article03.htm
Putnam, R. D. (2000). Bowling alone: The collapse and revival of American community. New York:
simon & schuster.
rouis, s., limayem, m., salehi-sangari, e. (2011). impact of facebook usage on students’ academic
Achievement: Role of Self-regulation and Trust. Electronic Journal of Research in Educational Psychology, 9 (3), 961-994.
taynton, K. (2012). The Net Generation in Japan: a Survey of Internet Behaviours of Students Aged
13-21. Teaching English with Technology, 12 (1), 3-19.
turan, Z., tinmaz, h., Goktas, y. (2013).the reasons for non-use of social networking Websites by university students. Comunicar: Scientific Journal of Media Education, 21 (41), 137-145.
Ünal Tutgun A., Köroğlu, O. (2013). A comparative study of social network usage and adoption among
turkish prospective teachers.Mevlana International Journal of Education (MIJE), 3 (4), 24-42.
Advised by Laima Railienė, University of Siauliai, Lithuania
Volume 57, 2013 78
Vincentas Lamanauskas Professor, Natural Science Education Research Centre, Siauliai University, 25-119 P.Višinskio Street, LT- 76351, Siauliai, Lithuania.
Phone: +370 687 95668.
E-mail: lamanauskas@projektas.lt
Website: http://www.lamanauskas.projektas.lt
Violeta Šlekienė PhD., Associate Professor, Department of Physics, Faculty of Natural Sciences,
iauliai University, 19 P. Visinskio Street, LT-77156 Siauliai, Lithuania. Phone: +370 41 595721.
E-mail: fk@fm.su.lt
Website: http://www.su.lt/ This e-mail address is being protected from spambots. You need JavaScript enabled to view it
Loreta Ragulienė Associate Professor, Department of Physics, Faculty of Natural Sciences,
Šiauliai University, 19 P. Visinskio Street, LT-77156 Siauliai, Lithuania. Phone: +370 41 595721.
E-mail: fk@fm.su.lt Website: http://www.su.lt/
Dragos Daniel Iordache PhD., Researcher, National Institute for Research and Development in
Informat-ics - ICI Bucharest, Blvd. Mareşal Averescu 8-10, 011455 Bucharest, Romania.
E-mail: iordache@ici.ro
Costin Pribeanu PhD., Senior Researcher, National Institute for Research and Development in
Informatics - ICI Bucharest, Blvd. Mareşal Averescu 8-10, 011455 Bucharest,
Romania.
E-mail: pribeanu@ici.ro
Website: http://rochi.ici.ro/pribeanu/
Martin Bilek Professor, Department of Chemistry – Section for Chemistry Didactics, Faculty of Science, University of Hradec Kralove, Rokitanskeho 62, CZ-50003 Hradec Kralove, Czech Republic
Phone: +420- 493331164. E-mail: martin.bilek@uhk.cz Website: http://www.uhk.cz/
Bulent Cavas PhD., Associate Professor, Dokuz Eylul University, Department of Science Education, Izmir, Turkey
Phone: +905324267927 E-mail: bulent.cavas@deu.edu.tr
Tatyana Mazurok Professor, Department of Applied Mathematics and Informatics, Faculty of Physics and Mathematics, South Ukrainian National Pedagogical University named after K.D. Ushinsky, 26 Staroportofrankovskaya Street, 6520, Odessa, Ukraine.