INTRODUCTION
Solar energy is one of the most essential re-sources of renewable energy. It is clean, safe, and non- pollutant for the environment. One hour of the solar energy reaching the surface of the Earth is equivalent to all needs of energy for all humans on the Earth for one year. The solar energy data is vital for conducting the feasibility studies for solar energy systems. The solar data is essential in many applications like designing PV systems, solar collectors, solar dryers, and in buildings [Ertekin & Yaldiz, 1999] [Sabziparver & Shetaee, 2007]. The solar data values of direct normal irra-diance allow one to derive precise information on the performance of solar energy systems [Lopez, Rubio & Batlles, 2000]. There are different tech -niques and devices used to measure the solar ra-diation. The received solar energy depends on the time during a day and during the season. In addi-tion, it depends on the geographical place [Schar-mer & Greif, 2000]. For a country like Oman,
the economical and efficient application of solar energy is dependent on the solar data. Different types of devices are used to measure the solar flux, like pyrheliometer, Pyranometer [Paulescu, et al., 2012]. The collected solar data is very im-portant for researchers or any person working in the solar field. There are many scientists who used different models to predict solar flux.
Several scientists measured the solar irra-diation as a reference [Lee, Yoo, & Levermore, 2013] measured the global solar irradiation on a horizontal surface for major cities of South Korea during the period (1986–2005). In North Mexico City, Matsumoto [Matsumoto et al., 2014] meas-ured the global-horizontal solar radiation from 1999 until 2012 [Perez, Bilbao & De-Meguel., 2014] measured the monthly mean hourly values of direct irradiance for different locations in Spain characterized by different climatic conditions. The study carried out during the period (2002–2012) [Gairaa & Benkaciali, 2011] performed hourly measurements of global and diffuse radiant fluxes
Accepted: 2019.08.28 Available online: 2019.09.30
Volume 20, Issue 9, October 2019, pages 38–43 https://doi.org/10.12911/22998993/112341
Variation in Direct Solar Irradiation with Relative Humidity
and Atmospheric Temperature
Aref Wazwaz
1*, Mohd Shariq Khan
11 Chemical Engineering Department, College of Engineering, Dhofar University, P.O. Box 2509, 211 Salalah,
Oman
* Corresponding author’s e-mail: aref@du.edu.om
ABSTRACT
A class first Pyranometer was used to measure the direct solar irradiation and the obtained results were analyzed. Separate sensors were used to measure the relative humidity and the atmospheric temperature (RH/AT sensors). The measurements were conducted for the whole year of 2013. The author analyzed the collected solar data during one day, month, and year. The maximum, minimum, average, and accumulative solar irradiation (SR) were calculated and analyzed with connection to relative humidity and atmospheric temperature. The author found that April was characterized by the average maximum solar irradiation (SR= 1112±1W/m2), May had the maximum SR accumu
-lation (13276552± 1W/m2). The maximum average percentage relative humidity found in July (% RH = 97± 3%),
while the minimum average % RH is in December (% RH = 25± 3%). In May, the maximum average atmospheric temperature was 36.0 ± 0.6oC, while the average minimum was in January (AT= 19.1 ± 0.6oC). The total
accumula-tion of solar flux during the year 2013 is 222 ± 1MW/m2.
at Ghardaia in southern Algerian peninsula from January 1, 2005, to December 31, 2008. The col-lected data are very important in the design of building energy systems. In Saudi Arabia, they made Solar Atlas in February 2014, which pro-vides live data recorded from 41 stations across the country [AlYahya & Irfan, 2016].
In our study, solar irradiation was measured for the first time at Dhofar University (North Al-Saadah-Salalah) to have a data bank for utilizing solar energy for different purposes. Al-Saadah-Salalah is at 17.0167° N, and 54.0929° E. This study was carried out in the period from Janu -ary 1, 2012, until December 31, 2013 [Wazwaz & Salmi, 2010]. The Automated Weather Station (AWS) was constructed at the roof of the Chemi-cal Engineering Department. The AWS composed of the first-class Pyranometer, along with the RH/ Temperature sensors. There are different models used to calculate the solar irradiance (direct and diffuse) by connecting it with humidity and ambi -ent temperature [Jimenez, Barrionuevo & Rodri -guez, 2016] [Loutfi et al., 2017].
EXPERIMENTAL
Installation of the Automated Weather Station (AWS)
We installed the Automated Weather Station (AWS) on the roof of the Chemical Engineering Department – College of Engineering- Dhofar University- North of AlSaadah-Salalah Oman. The station consisted of a pyranometer (first class), and relative humidity/atmospheric temper-ature (RH/AT) sensors. The specifications of the Pyranometer and the RH/AT illustrated in Table 1 and 2, respectively. The AWS was bought from Coastal Environmental Systems, Inc.
The utilized pyranometer used is first class (S80124, coastal Environmental Systems). This solar radiation sensor is applied in scientific grade solar radiation observations. It complies with the “first class” specifications within the lat -est ISO and WMO standards. It serves to meas -ure the solar radiation flux that is incident on a plane surface in W/m2 from a 180 degrees field of
view (also called “global” solar radiation). Work -ing completely passive, us-ing a thermopile sen-sor, the sensor generates a small output voltage proportional to this flux. Employing two glass domes, certain measurement errors are reduced; in
particular, thermal offsets, so that high measure-ment accuracy can be attained. The sensor can be directly connected to most commonly used data logging systems. It used for scientific meteoro -logical observations, building physics, climate- and solar collector testing. A common application is for outdoor solar radiation measurements as part of a meteorological station. This application requires horizontal leveling; leveling feet and a level are included. The cable can be installed or replaced by the user. The applicable standards are ISO 9060 and 9847, WMO (World Meteorologi -cal Organization), and ASTM E824–94. It used for stability estimations according to EPA.
The relative humidity and air temperature sensor (RH/AT sensors) is compact and easy to use. The relative humidity element is a hygro-scopic capacitive type. It is interchangeable. These elements never need calibration. Instead, the elements are easily replaced without the ex -pense and inconvenience sometimes associated with the calibration process. The membrane filter/ mechanical housing of the sensor protects it from dust and dirt.
The AWS connected to a PC and controlled by software (INTERCEPT V1.17.62). The AWS is working day and night, continuously recording the readings every minute. The collected data are
Table 1: Specifications of pyranometer
Item Specification
ISO classification First Class
Spectral range 305 to 2800 nm
Sensitivity (nominal) 15 μV/ Wm-2
Temperature range -40 to +80 °C
Range 0 to 2000 Wm-2
Temperature dependence < 0.1%/°C
Calibration traceability WRR
Table 2: Specifications of RH/AT sensors.
Item Specification
RH Accuracy +/- 3%
RH Resolution 0.1%
RH Range 0 – 100% RH
Operational Temperature
Range -30°C to +60°C
Storage Temperature -80°C to +80°C
AT Accuracy +/- 0.6°C
Time Constant, Max 1 sec in well-stirred oil. 15 sec in still air
processed, analyzed and plotted. Figure 1 shows all parts of the first class Pyranometer and RH/ AT sensors, respectively. The numbers inscribed in Figure 1 are describes as follows:
1. Detector
2. Outer glass dome. 3. Inner glass dome. 4. Sun shield. 5. Cable. 6. Connector. 7. Adjustable feet. 8. Smart interface. 9. Humidity indicator. 10. Desiccant.
11. Bubble level.
Figure 2 shows the installed automated weath-er station installed on the roof of the Chemical Engineering Department at Dhofar University.
RESULTS AND DISCUSSION
Calculations during the day
The Automated Weather Station (AWS) col -lects the solar data, Relative Humidity (RH) and Atmospheric Temperature (AT) during the day per minute and sends it via the data logger to be saved on the PC. The collected data was analyzed using Excel. Figure 3 below shows the data col -lected during the first day of January 2013 where SR represents the solar flux (solar irradiation).
The time of measurement started at 12:00 AM mid night until 11:59 PM next day (working 24 hours).
Figure 3 indicated the following parameters during that day: 1. SR: Maximum of SR = 846 ± 1 W/m2, Average of SR = 506 ± 1 W/m2,
Ac-cumulative of SR = 338718 ± 1 W/m2. 2. RH:
Maximum of RH= 42 ± 3%, Average of RH= 29 ± 3%, Minimum of RH= 16 ± 3%. 3. AT: Maxi -mum of AT = 28.4 ± 0.6oC, Average of AT= 22.5
± 0.6 oC, Minimum of AT= 17.8 ± 0.6oC. We did
the same calculations for all days of all months of the year 2013.
Calculations during the month
During each month of the year 2013, the au-thor performed the calculations to find the Maxi -mum of SR, Average of SR, Accumulative of SR, Maximum of RH, Average of RH, Minimum of RH, Maximum of AT, Average of AT, and Mini -mum of AT as seen in Figure 4. Figure 4 shows that during January 2013: The Average of Maximum SR = 901±1 W/m2, Average of SR = 470 ±1 W/m2,
The Average Accumulation of SR = 319984 ±1 W/ m2, The Accumulation of SR = 9599519 ±1 W/
m2. In the same way, the calculations for RH and
AT were performed (see Figures 5 and 6). Figure 5 shows the calculations of RH for January 2013.
Figure 5 shows that: Average of the Maxi -mums of RH = 61±3 %, Average of RH = 48±3%, Average of Minimums of RH = 31±3 %. From Figure 6, we found that: Average of Maximums of AT = 28.8 ± 0.6 oC, Average of AT = 23.2±0.6 oC,
Average Minimums of AT = 19.1±0.6 oC. During
January 2013, it was found that: The Maximums of SR= 1282± 1 W/m2 (In January 29), The Maxi
-mums of RH = 75±3% (In January 9, 30), The Maximums of AT= 32.3 ±0.6 oC (In January 3).
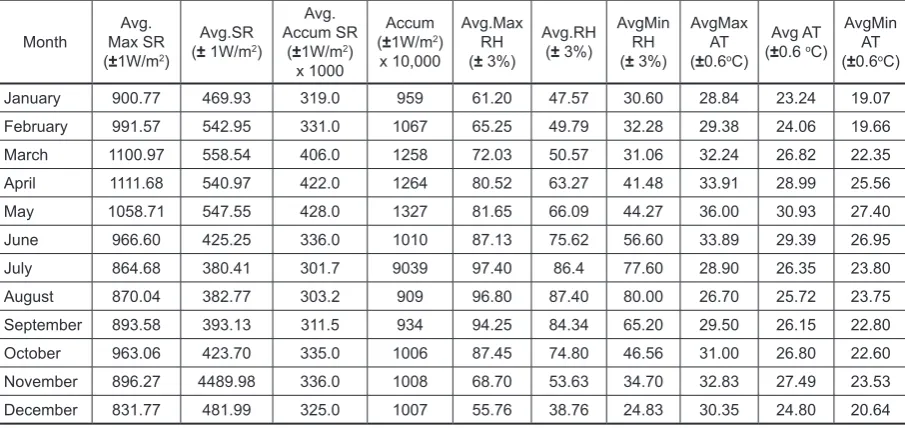
The investigation was carried out in the same way for the rest of the months of the year 2013. The summary of all months is shown in Table 3.
Figure 1: Solar radiation sensor
Figure 4:Solar irradiation for January 2013
Figure 5: Relative humidity for January 2013
Figure 6: Atmospheric temperature for January 2013
It can see (from Table 3) that: 1. In SR cal-culations: April gave the maximum average SR, March gave the best average, May month gave the best average accumulative of SR, and May is the best accumulation of SR among all months of the year 2013. In RH calculations: July gave the average maximum of RH, December gave the av -erage minimum of RH, and August gave the best average value. In AT calculations: May gave the average maximum of AT, January gave the aver -age minimum of AT, and May gave the highest value of the average of AT. Among all maximums in all months, we found that: the maximum SR found in April, the maximum RH found in July, and the maximum value of AT found in May. The accumulative SR for the whole year of 2013 is 222 ±1 MW/m2.
CONCLUSIONS
The AWS installed was composed of first-class pyranometer and the RH/AT sensors. The measured values of the SR, RH, and AT are for the year 2013. The measured values of all param-eters used to make several calculations such as average, accumulative, average maximums, aver -age minimums, aver-age among all data measured. It can be concluded that May is the best for col-lection of solar irradiation, while July is the worst one of collection solar irradiation because of the presence of thick layers of clouds in the sky dur-ing this month, which prevented some of the solar radiation from reaching the surface of the earth. This can be seen clearly in the average maximum RH values which are found in July (97±3%). Table 4: The maximum SR, RH, and AT found in the year 2013 at Dhofar University
Month Max SR(±1W/m(Day/s number)2) (Day/s number)Max RH (±3%) Max AT (±0.6(Day/s number)oC)
January 1282.00 (29) 75.00 (9.30) 32.30 (3)
February 1249.00 (12) 88.00 (3) 32.20 (15)
March 1360.00 (26) 88.00 (26) 36.40 (8)
April 1362.00 (5) 90.00 (3,4) 38.80 (2)
May 1280.00 (7) 87.00 (31) 41.80 (19)
June 1149.00 (24) 94.00 (29) 37.10 (10)
July 1027.85 (13) 95.6 (1–11, 15–31) 29.5 (9)
August 1034.22 (15) 94.00 (20–30) 28.9 (21)
September 1062.20 (18) 88.20 (4–8,20–25) 34.50 (20)
October 1144.79 (5) 95.00 (10) 37.75 (15)
November 980.00 (16) 83.00 (22) 36.70 (7)
December 1022.00 (13) 81.00 (8) 34.90 (4)
Table 3: Summary of the measured and calculated SR, RH and AT for all months of the year 2013
Month Max SR Avg.
(±1W/m2)
Avg.SR (± 1W/m2)
Avg. Accum SR
(±1W/m2)
x 1000
Accum (±1W/m2)
x 10,000
Avg.Max
RH
(± 3%)
Avg.RH (± 3%)
AvgMin
RH
(± 3%)
AvgMax
AT
(±0.6oC)
Avg AT (±0.6 oC)
AvgMin
AT
(±0.6oC)
January 900.77 469.93 319.0 959 61.20 47.57 30.60 28.84 23.24 19.07
February 991.57 542.95 331.0 1067 65.25 49.79 32.28 29.38 24.06 19.66
March 1100.97 558.54 406.0 1258 72.03 50.57 31.06 32.24 26.82 22.35
April 1111.68 540.97 422.0 1264 80.52 63.27 41.48 33.91 28.99 25.56
May 1058.71 547.55 428.0 1327 81.65 66.09 44.27 36.00 30.93 27.40
June 966.60 425.25 336.0 1010 87.13 75.62 56.60 33.89 29.39 26.95
July 864.68 380.41 301.7 9039 97.40 86.4 77.60 28.90 26.35 23.80
August 870.04 382.77 303.2 909 96.80 87.40 80.00 26.70 25.72 23.75
September 893.58 393.13 311.5 934 94.25 84.34 65.20 29.50 26.15 22.80
October 963.06 423.70 335.0 1006 87.45 74.80 46.56 31.00 26.80 22.60
November 896.27 4489.98 336.0 1008 68.70 53.63 34.70 32.83 27.49 23.53
Generally, most of the year is very good for the collection of solar radiation at Dhofar University (Dhofar Region). This makes Dhofar University (Dhofar Region) an excellent place for the Photo-thermal and Photovoltaic applications.
Acknowledgments
The research leading to these results has re-ceived research project grant funding from The Research Council (TRC) of the Sultanate of Oman under research agreement number [ORG DU EI 10 016]. Therefore, we are thankful to the TRC for their continuous support.
REFERENCES
1. AlYahya, S. and M.A. Irfan. 2016. Analysis from the new solar radiation Atlas for Saudi Arabia. So-lar Energy, 130: 116–127.
2. Ertekin, C. and Yaldız. O., 1999. Estimation of monthly average daily global radiation on horizon-tal surface for Anhorizon-talya (Turkey). Renewable En-ergy, 17(1): p. 95–102.
3. Gairaa, K. and S. Benkaciali,. 2011. Analysis of so-lar radiation measurements at Ghardaïa area, south Algeria. Energy Procedia, 6: 122–129.
4. Jimenez. V.A., Barrionuevo. A., Will. A., Rodrí -guez. S. 2016. Neural Network for Estimating Daily Global Solar Radiation Using Temperature, Humidity and Pressure as Unique Climatic Input Variables. Smart Grid and Renewable Energy, 7(03): 94–103.
5. Lee, K., Yoo. H., and Levermore., G.J., 2013. Qual -ity control and estimation hourly solar irradiation on inclined surfaces in South Korea. Renewable energy, 57: 190–199.
6. López, G., M.A. Rubio, and F.J. Batlles, 2000. Es -timation of hourly direct normal from measured global solar irradiance in Spain. Renewable En-ergy, 21(2): 175–186.
7. Loutfi, H., Bernatchou. A., Raoui. Y., Tadili. R, 2017. Learning processes to predict the hourly global, direct, and diffuse solar irradiance from daily global radiation with artificial neural net -works. International Journal of Photoenergy, doi. org/10.1155/2017/4025283
8. Matsumoto. Y., Valdés. M., Urbano. J. A., Kobayas -hi. T., López. G., Peña. R. 2014. Global solar irra-diation in north Mexico city and some comparisons with the south. Energy Procedia, 57: 1179–1188. 9. Paulescu. M., Paulescu. E., Gravila. P., Badescu. V.
2012. Weather modeling and forecasting of PV sys -tems operation. Springer, Berlin Heidelberg New York. 10. Pérez. B. A., Bilbao. J., De Miguel. A., Roman. R.
2014. Analysis of solar direct irradiance in Spain. Energy procedia, 57: 1070–1076.
11. Scharmer. K., Greif. J., 2000. The European Solar Radiation Atlas. Les Presses de l’École des Mines: Paris.
12. Sabziparver A., Shetaee H. 2007. Estimation of global solar radiation in arid and semi-arid climates of East and West Iran. Energy, 32: 649–655. 13. Wazwaza, A., & Salmi. J., 2010. Solar Net Collec