Monika et al. World Journal of Engineering Research and Technology
PREDICTING TEST EFFORT ESTIMATION: A MODEL BASED
UPON SOFTWARE TESTING MANAGEMENT STRUCTURE
Monika Grover*1 and Pradeep Kumar Bhatia2
CSE Department, G. J. University of Science & Technology, Hisar, Haryana, India.
Article Received on 18/05/2017 Article Revised on 04/06/2017 Article Accepted on 19/06/2017
ABSTRACT
Software testing is the most important phase of the Software
Development Life Cycle. On most software projects testing activities
consume at least 40 percent of the project effort. Software testing is
essential to ensure software quality. Schedule is always running tight
during the software system development, thereafter reducing efforts of
Performing software testing management. In such a situation, improving software quality
becomes an impossible mission. It is our belief that software industry needs new approaches
to promote software testing management. This paper discussed the V-model that already
existed, further proposes a improved V model that consider together test stages and
maintenance test stages. This model makes the software testing pass through the each stage of
software development cycle. Test Effort Estimation is an important activity in software
development because on the basis of effort cost and time required for testing can be
calculated. Another feature of present paper to the Estimation of Testing Effort using estimate
the effort required to test a software project, based on the number of use cases and the other
features of object-orientation used in software development.
KEYWORDS: Software testing, SDLC, STLC, UCP, Software quality, Effort estimation.
INTRODUCTION
Ever since the invention of computer, it has proved to be a vital part of our life while being
used in various aspects like agriculture, industry, medicine, commerce and education.
Considering the importance of computer, its demand is also ever increasing and hence
different types of software used for different types of work as in banks, research laboratory,
*Corresponding Author
Monika Grover
CSE Department, G. J.
University of Science &
Technology, Hisar,
Haryana, India.
wjert, 2017, Vol. 3, Issue 4, 218 -229
World Journal of Engineering Research and Technology
WJERT
www.wjert.org
ISSN 2454-695X Original Article
Monika et al. World Journal of Engineering Research and Technology
corporate offices etc. Software development requires understanding the requirements of the
customers, designing the software, testing the software for any possible errors, removal of
bugs, and finally delivery of product satisfactory to customarily needs. Software development
life cycle (SDLC) involves various stages in the development of software.[4-8] First of all, an
overall planning of various stages and method to implement them is necessary. The software
architecture is the key towards efficient software and this task is done by various Software
Development Models. Software development models are the various processes or
methodologies that are being selected for the development of the project depending on the project’s aims and goals. There are many development life cycle models that have been
developed in order to achieve different required objectives. The models specify the various
stages of the process and the order in which they are carried out.
There are various types of software process models which have been used by various
industries. Some of them are following:
1. Waterfall model
2. Iteration model
3. V-shaped model
4. Spiral model
5. Extreme model
The selection of model has very high impact on the testing that is carried out. It will define
the what, where and when of our planned testing, influence regression testing and largely
determines which testing techniques to use.[3] Here in this paper we will mainly focus on
V-model. In this paper section 2 contains overview of existing V - Model. Section 3 introduces
the proposed modified V - Model. Section 4 describes on historical data.
Existing V-models
Traditional V-model
Figure 1 shows the traditional V-model. Horizontal axes represent time or project
completeness whereas vertical axes represents level of abstraction. Left -side of the model is
Software Development Life Cycle (SDLC). Right side of model is Software test life cycle
(STLC). Software is designed on the left hand (downhill) part of the model and built and
tested on right hand (uphill) part of the model. Entire figure shows V-like structure. Hence
Monika et al. World Journal of Engineering Research and Technology
Fig 1: V–Model of software development process.
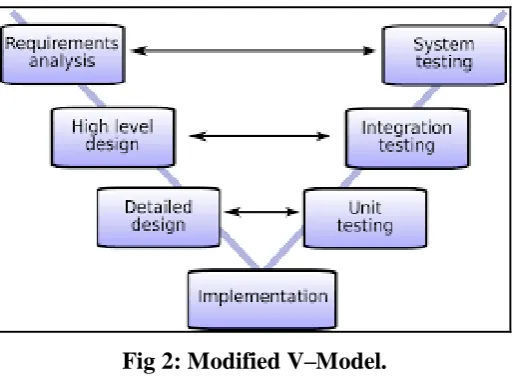
Modified V-Model
Fig 2: Modified V–Model.
It is an expansion of waterfall model where each level of developmental life cycle is verified
before moving on to next level. The only difference is that instead of going down the
waterfall in a linear way.
Following approach is used for test effort estimation in Use Case Point.[6,12]
1. First of all number of actors in the system are determined and categorized into 3 levels
simple, average and complex, based on their complexities. Then weights are assigned to
each type of these actors. From this Unadjusted Actor Weight (UAW) is calculated.
2. A similar procedure is applied to use cases in the system and Unadjusted Use Case
Weights (UUCW) is determined.
3. Unadjusted Use Case Points is calculated using the formula UUCP=UUCW+UAW.
4. Technical and Environmental Factors (TEF) are computed.
Monika et al. World Journal of Engineering Research and Technology
6. Final effort is computed as: Final effort = AUCP* ratio of development man-hours
needed per use case point.
Advanced V-Model
Though test effort based on UCP only gives good result, there is still a lot of gap between the
actual and predicted values. The results from this method can be further refined. To find final
effort, two additional factors are considered.
1. expertise of development team
2. expertise of testing team
The values for these parameters are given in Tables 1 and 2.
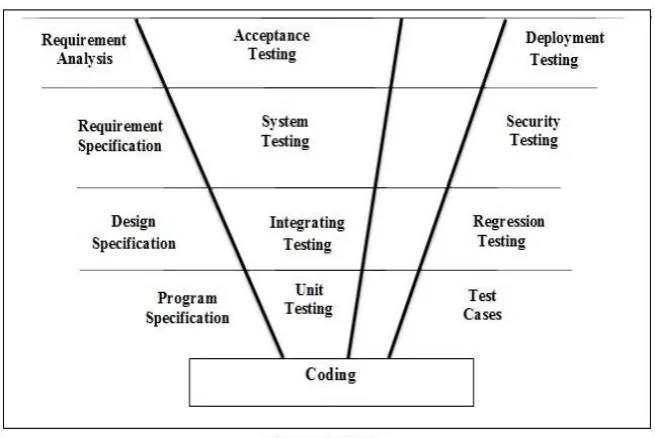
Advanced V-model differs from traditional model by addition of deployment and
maintenance phases which includes deployment testing, security testing, regression testing
and test cases. Figure 3 shows the advanced V-model.
Fig 3: Advanced V–Model.
Expertise of Development Team can be.
Experienced design and development team.
A mixture of experienced and non-experienced design and development team.
Non-experienced design and development team.
We have to do more Re testing and more Bug reporting for non experienced design and
Monika et al. World Journal of Engineering Research and Technology
Experienced Testing team can able to prepare better test cases and time taken to execute the
test cases will be minimal than the non- experience testing team. Refer table 2.
Table 1: Weights for development team expertise.
Expertise of Testing Team Factor
Experience Testing Team 5 A mixture of experienced and non-experienced Testing team 10 Non-experienced Testing team 15
Table 2: Weights for testing team expertise.
Expertise of Development Team Factor
Experienced design and development team 2 A mixture of experienced and non-experienced design and development team. 4 Non-experienced design and development team 8
1. First of all the number of actors in the system are determined and categorized into 3 levels
simple, average and complex, based on their complexities, from this Unadjusted Actor
Weight (UAW) is calculated.
2. A similar procedure is applied to use cases in the system and Unadjusted Use Case
Weights (UUCW) is determined.
3. Unadjusted Use Case Points is calculated using the formula UUCP=UUCW+UAW.
4. Technical and Environmental Factors (TEF) are computed.
5. Test Case Point is calculated as: TCP = UUCP*[0.65+0.01*TEF].
6. Values of DTF and TTF are selected from the table 2 and table 3 respectively for a given
project.
7. Final effort is computed as: Final effort = TCP (DTF+TTF).
Proposed V - Model
Proposed V-model, a model defines structural details of its components and thus helping us
better comprehension of the regarding model. Architecture gives the structural description of
the components and thereby helping us to understand the components in a modified and
better way. In this improved model, a software test management structure of component from
a structural point of view. The structure of the components of software testing management
and software maintenance tests are the basic elements, and they compose of software testing
management structure. The necessary and beneficial structural components are analyzed from
software development, testing and maintenance point of view.
Monika et al. World Journal of Engineering Research and Technology
together with Development Team Factor (DTF) and Testing Team Factor (TTF). The values
for these parameters are given in Tables 3, 4 and 5.
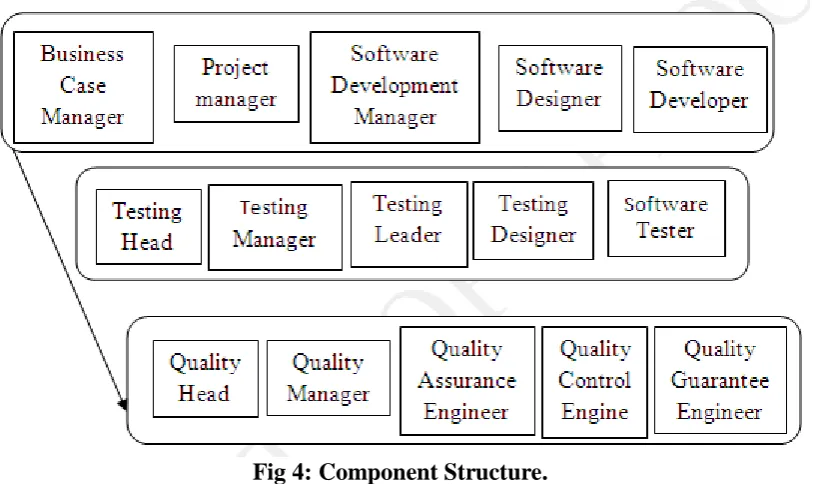
Component Structural Diagram of Proposed V-Model
Figure 4 depicts component structure diagram and corresponding component structure
services diagram respectively.
Fig 4: Component Structure.
A brief introduction of some essential and beneficial components is analyzed and is given
below:
Project Management Plan
1. Business Case Manager maintains business case and provides the essential environment
regarding the project.
2. Project manager makes a balance between risk and uncertainty and processing while
planning decisively regarding benefitting project
3. Software development manager is the leader of programmers. His main task is
maintenance of SDLC in progressive direction. He supervised and guides his team in
technical errors, preparing code of software etc.
4. Software designer manages the interaction between different components of software
either at same time or different times irrespective of the language in which their code is
written.
5. Software developer builds the main design of project with greater scope than coding and
Monika et al. World Journal of Engineering Research and Technology
Test management plan
1. Testing head maintains project and provide the project management plan.
2. Test manager serves to satisfy both testers and corporate. He builds test planning and
provides to tester that checks project quality to satisfy the demand required. He provides
updates regarding project development to corporate time to time so that they can decide
right time for implementation of project.
3. Testing leader is the live connection between testing manager and testing team. His
function is to complete the testing process within the assigned time.
4. Test designer develops testing strategy and testing plans. He provides the final assessment
of the whole testing process.
5. Software tester performs software tests and builds test cases.
Quality management plan
1. Quality head releases the project in the last stages of software development.
2. Quality manager helps to customize the process of software development. He creates the
entire quality management plan.
3. Quality assurance engineer finds the position of defects in software and functions to
prevent and remove defects.
4. Quality control engineer supervises all the activities which maintain software quality.
5. Quality guarantee engineer solves and tackles all the problems regarding software.
Effort Estimation using Proposed V- Model
We have three different teams’ project development team, testing team and quality
management team. According to R. T. Sundari [13], a factor can be determined for each team
based on the expertise of team members. This factor determines respective team influence of
effort estimation i.e. DTF (Development Team Factor), TTF (Testing Team Effort), and QTF
(Quality Team Factor).
Table 3, 4, 5 give you an idea about calculation of DTF (Development Team Factor), TTF
(Testing Team Effort), QTF (Quality Team Factor) respectively.
Table 3: Expertise of Development Team and Factor.
Expertise of development team factor
Monika et al. World Journal of Engineering Research and Technology
Table 4: Expertise of Testing Team and Factor.
Expertise of testing team factor
Experience testing plan as well as team 2
Experienced testing team 5
A mixture of experienced and non-experienced testing team 10 Non-experienced testing 15
Table 5: Expertise of Quality Team and Factor.
Expertise of quality testing team factor
Experienced quality planner 1.5 Experienced quality testing team 2 A mixture of experienced and non-experienced quality testing team 3 Non-experienced quality testing team 6
Experienced quality planner can supervise all the activities which maintain software quality
and able to produce good quality than the non-experience quality-testing team.
1. First of all number of actors in the system are determined and categorized into 4 levels
simple, average, complex and very complex based on their complexities, from this
Unadjusted Actor Weight (UAW) is calculated.
2. A similar procedure is applied to use cases in the system and Unadjusted Use Case
Weights (UUCW) is determined.
3. Unadjusted Use Case Points is calculated using the formula UUCP=UUCW+UAW.
4. Technical and Environmental Factors (TEF) are computed.
5. Test Case Point is calculated as: TCP = UUCP*[0.65+0.01*TEF].
6. Values of DTF, TTF and QTF are selected from the tables 3, 4, 5 respectively.
7. Final effort is computed as: Final effort = TCP (DTF+TTF+QTF).
EXPERIMENTS AND RESULTS
The project under study is a product support web site for a large North American software
company. The estimation was done from the business level use cases made available at the
time of signing the requirements. The actors at this time were the different types of users
Monika et al. World Journal of Engineering Research and Technology
Effort Estimation with Nageswan method
1. Calculation of Unadjusted Actor Weight (UAW).
A: Average
Actor Type No of Use Cases Factor UAW
B2C User A 15 2 30 Subscribers A 13 2 26 Admin User A 3 2 8
Total UAW 64
2. Calculation of Unadjusted Use Case Weight (UUCW).
Use case Type Factor UUCW
Login Complex 15 15 Support Request VC 20 Very Complex 20 20 Support Resource Mgt. Simple 5 5 User Creation Average 10 10 Fix Notifications Simple 5 5
Total UUCW 55
3. Calculation of the UUCP
Unadjusted Use Case Points (UUCP) = UAW + UCW = 64 + 55 = 119.
4. Technical factor (TEF) computation
Factor Description Assigned Value Weight Extended Value
T1 Test Tools 5 3 15
T2 Documented inputs 5 5 25 T3 Development Environment 2 1 2 T4 Test Environment 3 1 3
T5 Test-ware reuse 3 2 6
T6 Distributed system 4 4 16 T7 Performance objectives 2 1 2 T8 Security Features 4 2 8 T9 Complex interfacing 5 2 10
Total TEF 87
5. Adjusted UCP Calculation
(AUCP) =UUCP *[0.65+(0.01*TEF)] = 119 *[0.65+0.01*87] = 180.88.
6. Final Effort
Effort = AUCP * Conversion Factor
Effort = 180.88 * 13 = 2351.44.
Project Complexity needs 15% of the estimated effort to be added. 10% is spent in
co-ordination and management activity.
Monika et al. World Journal of Engineering Research and Technology
Actual Effort = 390 man-days [Project End]
Magnitude of Relative Error (MRE) =
| Actual Effort-Predicted effort |/Actual Effort * 100
=|390-367|/390*100 = 5.8%
Effort Estimation with Advanced V- Model
Total Effort =AUCP * (DTF+TTF)
For the given project for which test effort is to be estimated, taking the values of DTF and
TTF to be 8 and 10 respectively.
Total Effort = 180.88*(10+8) = 3255.84 man hours.
= 406.98 man days
Magnitude of Relative Error (MRE) =
| Actual Effort - Predicted effort |/Actual Effort * 100
=|390-406.98/390*100 = 4.36%
Effort Estimation with Proposed V-Model
Total Effort =AUCP * (DTF+TTF+QTF)
=180.88*17= 3074.96 man hours
= 384.37 man days
Magnitude of Relative Error (MRE) =
| Actual Effort - Predicted effort |/Actual Effort * 100
=|390-384.37|/390*100 = 1.44%
The obtained results can be summarized as given in Table 6 and Figure 6.
Table 6: Comparison of results obtained from different approaches.
Approach Predicted Value MRE
Monika et al. World Journal of Engineering Research and Technology
Figure 5: MRE of various approaches.
CONCLUSION
This paper presents an improved-V model describing that for efficient software testing
management along with the development and testing process improved the maintenance
process is also equally important. Thus we have integrated these processes for efficient
software testing management. In this paper use case points (UCP) is used for computation of
test effort estimation and the results led us to the conclusion that test effort estimation
obtained is more accurate than exiting V-models. The results were compared with those
obtained from existing V-models, and were found to be closer to the actual effort
REFERENCES
1. Ian Sommerville, "Software Engineering", Addison Wesley, 7th edition, 2004.
2. CTG. MFA – 003, a Survey of System Development Process Models, Models for Action
Project: Developing Practical Approaches to Electronic Records Management and
Preservation, Center for Technology in Government University, Albany / Suny, 1998.
3. Nabil M. Ali and A. Govardhan, 2010, a Comparison between Five Models of Software
Engineering. IJCSI International Journal of Computer Science Issues, 1998; 7(5): ISSN
(Online): 1694-0814, 94 – 101.
4. Steve Easterbrook, Software Lifecycles, University of Toronto Department of Computer
Science, 2001.
5. National Instruments Corporation, Lifecycle Models, http://zone.ni.com, 2006.
6. J J Kuhl, Project Lifecycle Models: How They Differ and When to Use Them.
www.businessesolutions.com, 2002.
Monika et al. World Journal of Engineering Research and Technology
8. Rlewallen, Software Development Life Cycle Models, http://www.codebeter.com, 2005
9. Rook, Paul, E. Rook, 1986, controlling software projects, IEEE Software Engineering
Journal, 2005; 1(1): 7-16.
10.S. Mathur, S. Malik, Advancements in the V-Model International Journal of Computer
Applications (0975 – 8887), 2010; 1(12): 29-34.
11.R. S. Yadav, Improvement in the V-Model. International Journal of Scientific &
Engineering Research, Volume 3, Issue 2, ISSN 2229-5518 IJSER, 2012; 1-8.
12.S. Kumar, Capability Determination of Software Design using V- Model. International
Journal of Advances in Engineering Research (IJAER), 2012; 4(II): August ISSN:
2231-5152.
13.Sundari, R.T., TCPA - Tool to Test Effort Estimation. available at, 2011.
http://citeseerx.ist.psu.edu/viewdoc/summary?doi=10.1.1.117.6132
14.A. F. Sheta, A. A. Afeel, Software Effort Estimation for NASA Projects Using Genetic
Programming, Journal of Intelligent Computing, 2010; (1): 146-156.
15.B. Anda, H.C. Benestad, and S.E. Hove, "A Multiple-Case Study of Software Effort
Estimation Based on Use Case Points," Proc. Int'l Symposium Empirical Software Eng,