Volume 3 Issue 2 ǁ February 2018.
www.ijahss.com
Effect of Environmental Work and Pressure Work to Employee
Performance Through Job Satisfaction
PT. BANK BCA
Monica Suharnira
1), Suharto
2), Guswandi
3)1)
Student Master of Management Krisnadwipayana University Jakarta
2)
Associate Professor at Faculty of Economics Krisnadwipayana University Jakarta
3)
Lecturer at Faculty of Economics Krisnadwipayana University Jakarta
Campus UNKRIS Jatiwaringin. P.O. Box 7774 / Jat CM. Jakarta 13077, Indonesia
Abstract: This study aims to determine the effect of work environment and pressure work on employee performance simultaneously and partially and to know the influence of work environment and pressure work on employee performance through job satisfaction. Research conducted on the employees of PT. Bank BCA. The sampling technique used saturated sample method involving 98 people. Data analysis using path analysis. The result of the research shows that the work environment and pressure work variables influence the employee performance simultaneously, the work environment variables influence the partial employee performance, the pressure work variables affect the partial employee performance. The direct effect is greater than the indirect effect so it can be said that the variable of job satisfaction is not as intervening variable. The direct effect is greater than the indirect effect so it can be said that the job satisfaction variable is not an intervening variable.
Keywords: Work Environment, Pressure work, Job Satisfaction, Employee Performance
I. INTRODUCTION
The ability of employees to do certain skills is needed. This is related to employee performance. Employee performance is very necessary, because with this performance will be known ability of employees in carrying out the tasks assigned to him. It is therefore necessary to establish clear and measurable performance and set out together as a reference.
Performance is performance that is the result of work produced by employees or real behavior that is displayed in accordance with its role in the organization. Performance can be viewed as a process or a result of work. Performance is a process of how the work takes place to achieve the work. However, the work itself also shows performance. The work is achieved individually or institutionally, which means that the performance is the end result obtained individually or in groups. In carrying out the duties, the person or institution is granted authority and responsibility, which means the person or institution is granted the right and power to be followed up, so that his work can be done well. Factors that are predicted to affect employee performance are the work environment, pressure work, and job satisfaction. Research Kotteswari and Sharief (2014) states that pressure work affects the performance of company employees. This research was conducted on the industrial process employee outsourcing business in India.
Other studies suggest that the work environment has an effect on job satisfaction. The higher the working environment the greater job satisfaction (Raziq and Maulabakhsh, 2015). The research was conducted on a number of employees at educational institutions, banking sector and telecommunication industry operating in Pakistan.
II. LITERATURE REVIEW
2.1 Work Environment
The work environment is something that exists around the workers and that affects itself in carrying out the tasks charged (Nitisemito, 1992). Furthermore, according Sedarmayanti (2001) work environment is the entire tooling tools and materials encountered, the environment surrounding where a person works, methods of work, and arrangement of work both as individuals and as a group.
According to Schultz & Schultz (2006) the work environment is defined as a condition related to the characteristics of the place of work to the behavior and attitudes of employees where it is related to the occurrence of psychological changes due to things experienced in the work or in certain circumstances that should continue to be noticed by organizations that include work boredom, monotonous work and fatigue
In the opinion ofSedarmayanti (2001) who said that a condition of work environment can be said well if man can run an activity optimally, healthy, safe and comfortable.
Based on the theory and concept of work environment as described above, it can be concluded that the work environment is something that always exist around the area of employees / workers, whether it includes the physical environment, or included into the non-physical environment and the network in working relationships in an organization that can affect the morale of employees / workers in completing the work that has been assigned.
Type of Work Environment
Broadly speaking, the type of work environment is divided into two, namely (Sedarmayanti, 2001): 1. Physical Work Environment
a. Work environment directly related to employees such as work centers, chairs, tables, and so forth. b. An intermediary environment or common environment can also be called a work environment that
affects the human condition such as temperature, humidity, air circulation, lighting, noise, mechanical vibration, odor, color and others.
2. Non-Physical Work Environment
Companies should be able to reflect conditions that support cooperation between the level of superiors, subordinates and who have the same status. Conditions that should be created are the atmosphere of kinship, good communication, and self-control (Nitisemito, 2000). So this non-physical work environment is also a working environment group that cannot be ignored.
Benefits of the Work Environment
According to Ishak and Tanjung (2003), the benefits of working environment is to create a passion for work, so that productivity and job performance increases. Meanwhile, the benefits of working with motivated people are that work can be done properly, which means that the work is done according to the correct standards and on a specified timescale. Her work performance will be monitored by the individual concerned, and will not result in too much supervision and the fighting spirit will be high.
In the work environment around workers / employees, both physical and non-physical work environment there is certainly a benefit that can be felt by employees and workers. And as according Isaac and Tanjung (2003) about the benefits of the work environment means that, the benefits of the work environment is to create a passion for work, so that productivity and job performance increases.
Then the benefits gained from working with motivated people are as follows: a. The work can be done properly
b. Employee performance / worker will be directly monitored by the individual concerned.
2.2 Pressure Work
Work stress is stress due to an imbalance between the characteristics of the employee's personality with the characteristics of his job aspects and can occur in all working conditions. Quick and Quick (1984) categorize the types of stress into two, namely:
1. Eustress, which results from a response to stress that is healthy, positive, and constructive (constructive). These include the well-being of individuals as well as organizations associated with growth, flexibility, adaptability, and high levels of performance.
2. Distress, which results from the response to stress that is unhealthy, negative, and destructive. These include individual and organizational consequences such as cardiovascular disease and high absenteeism, associated with illness, decline, and death.
Beehr and Newman (1999) reviewed some cases of occupational stress and concluded three symptoms of stress in individuals, namely:
2. Physiological Symptoms 3. Symptoms of Behavior
The impact of stress is divided into the impact of stress on employees and the impact of stress on the company. a. For Employees
In the employee, the consequences can include decreased arousal, high anxiety, frustration and so on (Rice, 1999). Consequences on these employees are not only related to work activities alone, but can extend to other activities outside of work. As cannot sleep quietly, appetite is reduced, less able to concentrate, and so forth.
b. For the Company
For the company, the consequences that arise and are indirect is the increased level of absenteeism, decreased levels of productivity, and psychologically can decrease organizational commitment, trigger alienated feeling, to turnover. To be able to eliminate the stress can be held stress management. Stress management is divided into:
Stress Management
Then needed the right approach in managing stress, there are two approach that is a) an individual approach
b) organizational approach.
Technique of Stress Reduction a) Bio feedback
b) Meditation
c) Cognitive restructuring
According to Anwar (1993) Work stress is a pressing feeling or feeling depressed experienced by employees in the face of their work. Yoder and Staudohar (1982: 308) define Job Stress is a work-related stress also affects the person's emotion, thought process and physical condition, where the pressure comes from the work environment in which the individual is situated.
Beehr and Franz (2002) define work stress as a process that causes people to feel pain, discomfort or tension due to a particular job, workplace or work situation. Stress is a condition of tension that affects the emotions, thinking processes and conditions of a person. If a person / employee experiencing stress that is too big will be able to disrupt the ability of a person / employee to face the environment and the work to be done (Handoko 1997)
According to Anoraga (2001), work stress is a form of a person's response, both physically and mentally to a change in the environment that is perceived to be disturbing and causing him to be threatened. Gibson et al (1996), states that job stress is an adjustment response mediated by individual differences and / or psychological processes which are a consequence of any external action (environment), situation, or event that establishes excessive psychological or physical demand to someone.
Category of Work Stress
According to Phillip (2002), a person can be categorized as having job stress if:
1. Affairs of stress experienced also involves the organization or company where individuals work. But the cause is not only within the company, because the problems of household brought to work and homework problems can also be a cause of work stress.
2. Resulting in negative impacts for companies as well as individuals.
3. It is therefore necessary cooperation between the two parties to solve the stress problem
In general, a person experiencing stress on the job will display symptoms that include 3 aspects, namely: Physiological, Psychological and Behavior (Robbins, 2003).
1. Physiological has an indicator that is: there are changes in the body's metabolism, increased heart rate and breath rate, increased blood pressure, the onset of headaches and cause heart attacks.
2. Psychological have indicator that is: there is dissatisfaction of work relationship, tense, anxiety, anxiety, irritability, boredom and often delay work.
3. Behavior has an indicator that is: there are changes in productivity, absenteeism in work schedules, changes in appetite, increased consumption of cigarettes and alcohol, talking with rapid intonation, easily restless and insomnia.
Factors Cause Work Stress
According to (Robbin, 2003) causes of stress that there are 3 factors: 1. Environmental Factor.
3. Individual Factors
2.3 Job Satisfaction
Job satisfaction, according to Martoyo (1992), is basically one of the psychological aspects that reflects one's feelings toward his work, he will be satisfied with the suitability between his ability, his skills and his expectations with the work he faces. Satisfaction is actually a subjective condition that is the result of a conclusion based on a comparison of what an employee receives from his job as expected, desired, and thought of as appropriate or entitled to it. While every employee / employee subjectively determines how the job is satisfactory.
According to Tiffin (1958) in As'ad (1995) job satisfaction is closely related to attitudes of employees to their own work, work situation, cooperation between leaders and employees. Meanwhile, according to Blum (1956) in As'ad (1995) suggests that job satisfaction is a general attitude that is the result of some special attitudes toward work factors, adjustments and individual social relationships outside the workplace.
According to Herzberg as quoted by Sumantri (2001), the attributes of satisfied worker behavior are those who have high motivation to work, they prefer to do their work, while the characteristics of the less satisfied workers are those who are lazy to go to work, and lazy in doing his job. So it can be concluded that job satisfaction is the feeling or attitude of a person to the work he does, which can be influenced by various factors, both internal and external factors.
According to Robbins (2003) there are two approaches that can be used to measure employee job satisfaction, namely:
1. Single global rating 2. Summation score
Factors Affecting Job Satisfaction
Factors that affect job satisfaction can basically be two parts: intrinsic factors or factors that come from within the employee itself such as expectations and needs of the individual and the second is extrinsic factors, extrinsic factors are factors that come from employees such as company policy , the physical condition of the work environment, the interaction with other employees, the payroll system, etc. Theoretically, the factors that can influence job satisfaction are numerous, such as leadership style, behavior, locus of control payroll expectation, and work effectiveness.
The factors that are commonly used to measure an employee's job satisfaction are: (a) job content, actual job performance and job control; (b) supervision; (c) organization and management; (d) an opportunity to advance; (e) salaries and other financial benefits such as incentives; (f) co-workers; and (g) working conditions (Chruden & Sherman, 1972).
According Hasibuan (2004) employee job satisfaction is influenced by factors: 1. Reasonable and fair remuneration
2. Proper placement according to skill 3. Weight of work
4. Atmosphere and work environment
According to Robbins (2003) there are four factors that are conducive to high job satisfaction levels, namely:
a. Work that mentally challenges People prefer jobs that give them the opportunity to use their skills and abilities and offer a variety of tasks, freedom and feedback about how well they do it. These characteristics make the work mentally challenging.
b. employee's fair. Benefits employees want a system of sustenance that they consider unambiguous, and in line with their expectations. If the payments appear to be fair based on job demand, individual skill level, and the standard of community payments, satisfaction may be generated.
c. Working environment conditions that support employees are concerned with their working environment when it comes to personal comfort and the ease of working. Many studies have shown that employees prefer a harmless or comfortable physical environment. In addition, most employees prefer to work not far from home, in clean and relatively modern facilities, with adequate tools and equipment.
d. Supportive colleagues. From work people get more than just money or tangible achievements, for some employees also can fill the need for social interaction. Therefore, it is not surprising that an employee has a supportive and friendly partner to improve their job satisfaction.
According to Spector (1997) aspects of job satisfaction there are 2 factors, namely intrinsic and extrinsic factors. These factors serve as indicators in this study on the job satisfaction scale.
a) Intrinsic Factors
• Activity: How far the job can still occupy the individual • Independence: The authority to be self-employed • Variety: Opportunities to do different jobs
• Social status: Public acknowledgment of employment status
• Moral values: Work is not related to anything that can interfere with conscience • Security Certainty of work provided
• Social service: The opportunity to help others do the work • Authority: Having power over others
• Ability utilization: Opportunity to use existing capabilities • Responsibility: Responsibility in making decisions and actions • Creativity: The freedom to express new ideas
• Achievement: Feelings gained when completing a task b) Extrinsic Factors
• Compensation: The amount of rewards or wages received • Advancement; Opportunity to get promotion
• Coworkers; How good is the relationship between co-workers
• Human relations supervisions: The ability of superiors in interpersonal relationships
• Technical supervisions: The ability or skill of the boss concerns everything related to the job • Company policies and practice: How far the company pleases the workers
• Working conditions: Working conditions such as working hours, temperatures, office supplies and work locations
• Recognition: Compliments obtained when completing good work
Dimensions of Job Satisfaction
Nelson and Quick (2006) revealed that job satisfaction is influenced by 5 specific dimensions of the job ie salary, job itself, promotion opportunity, supervision and co-worker.
1. Salary
2. Position promotion opportunities 3. Supervision
4. Coworkers
III. RESEARCH METHODS
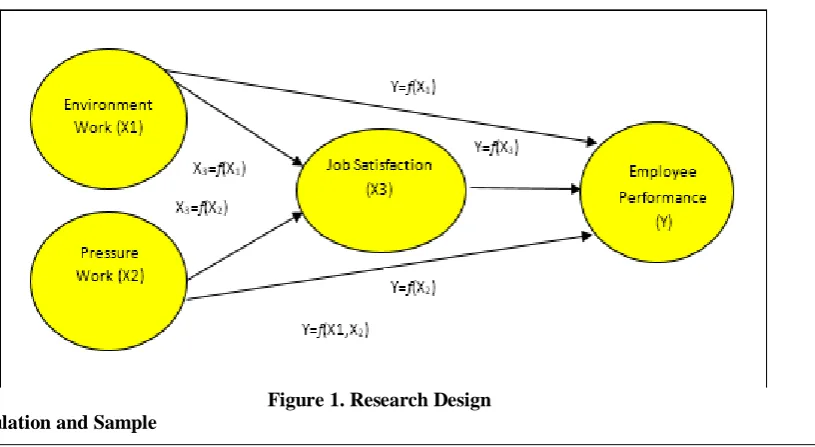
3.1 Research Design
This research uses explanatory analysis approach. This means that each variable presented in the hypothesis will be observed through testing the causal relationship of independent variables to the dependent variable. Relationships between variables can be described in the form of path analysis diagram as follows:
Population is a generalization region consisting of objects / subjects that have a certain quantity and characteristics set by researchers to be studied and then drawn conclusions (Sugiyono, 2005). The sample is the pull of a portion of the population to represent the entire population, (Surakhmad, 2000).
The samples used by the authors in this study were company employees. The total number of employees is 98 people. The number of employees is entirely involved in this study. So the sampling is using saturated sample method.
3.3 Data Collection Techniques
To obtain a concrete and objective data must be held research on the problems studied, while the steps that researchers took in the collection of data are:
a. Primary data
Primary data is data obtained directly from the object of research In this case the primary data obtained from field research that is data collection method used premises direct research on the object of research in question.
b. Secondary data
Secondary data is data obtained indirectly from research object. In this case the secondary data obtained from the library research data collecting method that is done by studying and understanding books of literature of the author's work that can be justified theoretical basic.
3.4 Data Processing Techniques
Questionnaires to be used in research, to produce a valid and reliable instrument first tested with validity and reliability test instrument. According Sugiyono (2007) "Validity is a condition that describes the level of the instrument concerned is able to measure what should be measured". While reliability is a value that shows the consistency of a measuring device in measuring the same symptoms (Riduwan, 2003). By using a valid and reliable instrument, it is expected that the results will be valid and reliable.
1. Test Data Validity
Testing the validity of the instrument using the item analysis, which is to calculate the score of each item with the total score which is the number of each score item. The correlation coefficient used is Product Moment correlation coefficient.
2. Test Data Reliability
Looking for instrument reliability whose score is not 1, but it is a range between several values, eg 10 or 0-100 or scales of 1-3, 1-5, or 1-7, and so on can use alpha coefficients (α) from Cronbach alpha.
IV. RESEARCH RESULT AND DISCUSSION
4.1 Validity Test Results
The working environment variables include 6 questions composed from numbers 1 through 6. The question is then submitted to 98 employees. Before analyzed further then the results of the questionnaire is seen the validity and reliability. Validity test results can be seen in the following table.
Table 1. Validity Test Results Instrument Variable Work Environment Variable Statement R arithmetic R table Description
Work Environment (X1)
Question 1 0,840 0.198 Valid
Question 2 0,621 0.198 Valid
Question 3 0,621 0.198 Valid
Question 4 0,697 0.198 Valid
Question 5 0,743 0.198 Valid
Question 6 0,621 0.198 Valid
Source: Primary Data, processed in 2017
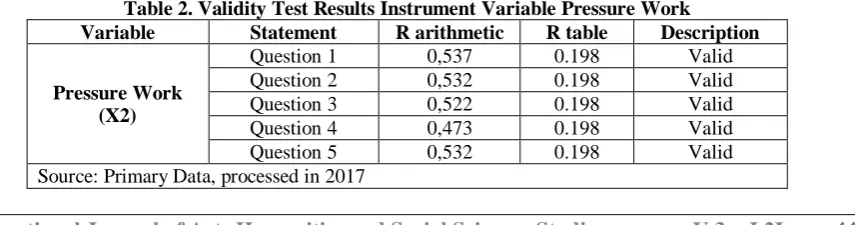
Pressure work variables include 5 questions. The question was then submitted to 98 employees. Before further analyzed the results of the questionnaire is seen the validity. Validity test results can be seen in the following table.
Table 2. Validity Test Results Instrument Variable Pressure Work
Variable Statement R arithmetic R table Description
Pressure Work (X2)
Question 1 0,537 0.198 Valid
Question 2 0,532 0.198 Valid
Question 3 0,522 0.198 Valid
Question 4 0,473 0.198 Valid
Question 5 0,532 0.198 Valid
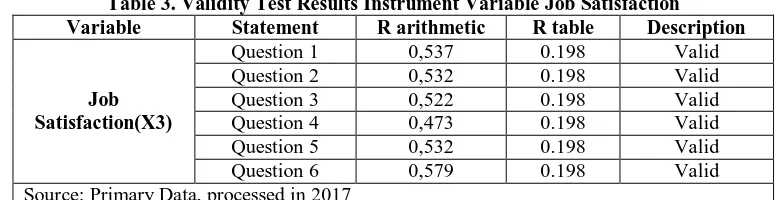
Job satisfaction variables include 6 questions. The question was then submitted to 98 employees. Before further analyzed the results of the questionnaire is seen the validity. Validity test results can be seen in the following table.
Table 3. Validity Test Results Instrument Variable Job Satisfaction Variable Statement R arithmetic R table Description
Job Satisfaction(X3)
Question 1 0,537 0.198 Valid
Question 2 0,532 0.198 Valid
Question 3 0,522 0.198 Valid
Question 4 0,473 0.198 Valid
Question 5 0,532 0.198 Valid
Question 6 0,579 0.198 Valid
Source: Primary Data, processed in 2017
Employee performance variables include 9 questions. The question was then submitted to 98 employees. Before further analyzed the results of the questionnaire is seen the validity. Validity test results can be seen in the following table.
Table 4. Instrument Validity Test Results Employee Performance Variables Variable Statement R arithmetic R table Description
Employee Performance (Y)
Question 1 0,534 0.198 Valid
Question 2 0,603 0.198 Valid
Question 3 0,484 0.198 Valid
Question 4 0,465 0.198 Valid
Question 5 0,577 0.198 Valid
Question 6 0,404 0.198 Valid
Question 7 0,450 0.198 Valid
Question 8 0,480 0.198 Valid
Question 9 0,497 0.198 Valid
Source: Primary Data, processed in 2017
Based on Tables 1,2,3 and 4 it can be seen that all of the variable questionnaires used (work environment, pressure work, job satisfaction and employee performance variables) results are valid.
4.2 Test Reliability
Test reliability to know the extent to which the measurement results are reliable and consistent. In Table the following test results note that all variables have alpha above 0.6 which means that all variables in this study reliable.
Table 5. Reliability Test Results Instrument Variable Research Variable Cronbach Alpha (α) Description
Work Environment(X1) 0, 736 Reliable
Pressure Work (X2) 0, 609 Reliable
Job Satisfaction(X3) 0, 717 Reliable
Employee Performance (Y) 0, 633 Reliable
Source: Primary Data, processed in 2017
Based on Table 5, Cronbach alpha reliability test results can be seen that all existing statements form a reliable measure of the work environment variables, pressure work, job satisfaction and employee performance form a reliable measure of each dimension.
4.3 Discussion
4.3.1 Effect of Work Environment and Pressure of Work on Employee Performance
Linear analysis model can be seen based on calculation by using SPSS program as follows.
Table 6. Results of the first equation analysis
Model
Unstandardized Coefficients
Standardized
Coefficients t Sig. B Std. Error Beta
1 (Constant) 12,612 2,112 5,970 ,000
Work Environment ,602 ,080 ,579 7,521 ,000
Pressure Work ,321 ,096 ,257 3,333 ,001
Based on Table 6, the simultaneous structural equations can be described as follows: Y = 0.579 X1 + 0.257 X2
The value of F arithmetic can be obtained from the following table
Table 7. Value F Calculate simultaneous equations
Model Sum of Squares df Mean Square F Sig.
1 Regression 955,261 2 477,631 39,953 ,000b
Residual 1135,718 95 11,955
Total 2090,980 97
a. Dependent Variable: Employee Performance
b. Predictors: (Constant), Work Environment, Pressure Work
Source: Primary Data, processed in 2017
Based on Table 7 it is known that the F value is 13,792 and the significance is 0,05. This value is less than 0.05. This means that work environment variables and pressure works affect employee performance simultaneously. The magnitude of the influence of independent variables on the dependent variable can be seen from the r quadratic value as follows.
Table 8. The r-value of the squared first regression model. Based on Table 7 it is known that the F value is 13.792 and the significance is 0.05. This value is less than 0.05. This means that work environment variables and pressure works affect employee performance simultaneously. The magnitude of the influence of independent variables on the dependent variable can be seen from the r quadratic value as follows.
Table 8. The r-value of the squared first regression model
Model R R Square Adjusted R Square
Std. Error of the Estimate
Durbin-Watson
1 ,514a ,264 ,245 4,47485 ,951
a. Predictors: (Constant), Work Environment, Pressure Work b. Dependent Variable: Employee Performance
Source: Primary Data, processed in 2017
Based on Table 8 it is known that r square value of 26.4% means work environment variables and pressure work effect employee performance of 26.4% while the rest is influenced by other variables not included in equation model.
4.3.2. Analysis of The Effect of Work Environment on Partial Employee Performance
The results of the analysis of the effect of the work environment on the performance partially can be seen in the following table.
Table 9. Results of the second regression equation analysis
Model
Unstandardized Coefficients
Standardized
Coefficients t Sig.
B Std. Error Beta
1 (Constant) 16,372 1,877 8,721 ,000
Work Environment ,652 ,083 ,627 7,889 ,000
a. Dependent Variable: Employee Performance Source: Primary Data, processed in 2017
The structural equation of the data of Table 9 can be seen as follows: Y = 0.627X1
Based on Table 9, the results of the above analysis note that the working environment coefficient of 0.627. The value of t is 7,889. Value significance of 0.00. This value of significance is smaller than 0.05. This means that the working environment variables affect the performance of employees partially. The amount of influence of the work environment on employee performance can be seen in the following table.
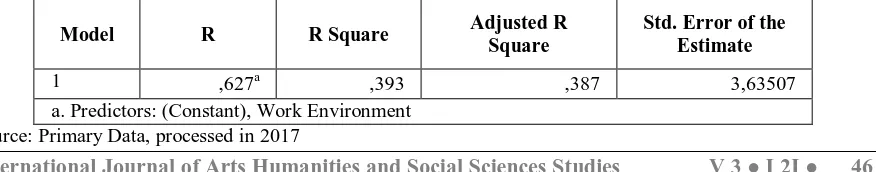
Table 10. The square r-value of the second equation
Model R R Square Adjusted R Square
Std. Error of the Estimate
1 ,627a
,393 ,387 3,63507
Based on Table 10 it can be seen r square value of 0.393. This means that the effect of work environment variable on employee performance is 39.3% and the rest is influenced by other variables that are not included into equation model.
4.3.3 Analysis of The Influence of Pressure of Work on Partial Employee Performance
The result of the analysis of the effect of work pressure on performance partially can be seen in the following table.
Table 11. Results of the analysis of the third regression equation
Model
Unstandardized Coefficients
Standardized
Coefficients t Sig. B Std. Error Beta
1 (Constant) 23,954 1,858 12,890 ,000
Pressure Work ,457 ,119 ,365 3,845 ,000
a. Dependent Variable: Employee Performance Source: Primary Data, processed in 2017
The structural equation of the above data can be seen as follows: Y = 0.365X2
Based on Table 11 it is known that the pressure work coefficient of 0.365. The value of t is 3.845. Value significance of 0.00. This value of significance is smaller than 0.05. This means that the pressure work variable affects the employee's performance partially. The magnitude of the influence of pressure work on employee performance can be seen in the following table.
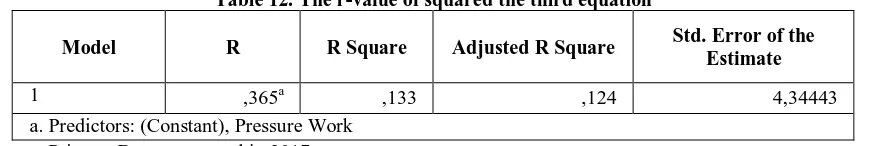
Table 12. The r-value of squared the third equation
Model R R Square Adjusted R Square Std. Error of the Estimate
1 ,365a ,133 ,124 4,34443
a. Predictors: (Constant), Pressure Work Source: Primary Data, processed in 2017
Based on Table 12 it can be seen the r square value of 0.133. This means that the effect of pressure work variables on employee performance is 13.3% and the rest is influenced by other variables not included in the equation model.
4.3.4 Analysis of Influence Job Satisfaction Against Employee Performance Partially
The results of the analysis of the effect of satisfaction on performance partially can be seen in the following table.
Table 13. Results of the analysis of the fourth regression equation
Model
Unstandardized Coefficients
Standardized
Coefficients t Sig. B Std. Error Beta
1 (Constant) 18,499 2,066 8,952 ,000
Job Satisfaction ,648 ,106 ,530 6,116 ,000
a. Dependent Variable: Employee Performance Source: Primary Data, processed in 2017
The structural equation of the above data can be seen as follows: Y = 0.530X3
Based on Table 13 the results of the analysis note that the job satisfaction of 0,530. The value of t is 6,116. Value significance of 0.00. This value of significance is smaller than 0.05. This means that the job satisfaction variable affects the employee's performance partially. The magnitude of the effect of job satisfaction on employee performance can be seen in the following table
Table 14. The r-value of squared the fourth equation
Model R R Square Adjusted R Square
Std. Error of the Estimate
1 ,530a ,280 ,273 3,95900
Based on Table 14 we can see the r square value of 0.280. This means that the effect of the job satisfaction variable on employee performance is 28.0% and the rest is influenced by other variables that are not included in the equation model.
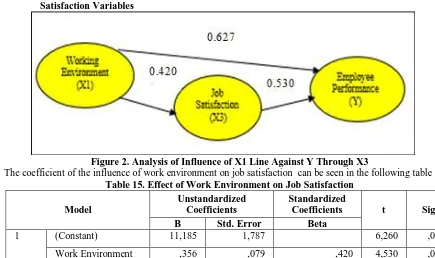
4.3.5 Analysis of The Effect of Work Environment on Employee Performance Through Job Satisfaction Variables
Figure 2. Analysis of Influence of X1 Line Against Y Through X3
The coefficient of the influence of work environment on job satisfaction can be seen in the following table
Table 15. Effect of Work Environment on Job Satisfaction
Model
Unstandardized Coefficients
Standardized
Coefficients t Sig. B Std. Error Beta
1 (Constant) 11,185 1,787 6,260 ,000
Work Environment ,356 ,079 ,420 4,530 ,000
a. Dependent Variable: Job Satisfaction Source: Primary Data, processed in 2017
Based on Figures 2 and Table 15, it can be seen that the direct effect of work environment on employee performance is 0.627. While the effect of work environment on employee performance through job satisfaction is 0,420 x 0,530=0,2226. In this case the direct influence is greater than the indirect effect so it can be said that the variable of job satisfaction is not as intervening variable.
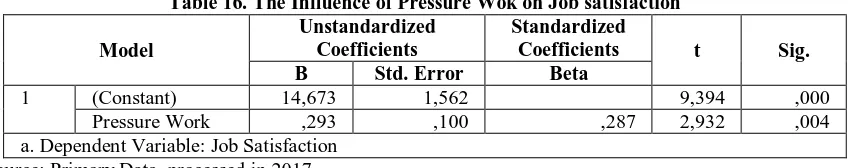
4.3.6 Analysis of The Influence of Pressure of Work on Employee Performance Through Job Satisfaction Variables
Table 16. The Influence of Pressure Wok on Job satisfaction
Model
Unstandardized Coefficients
Standardized
Coefficients t Sig. B Std. Error Beta
1 (Constant) 14,673 1,562 9,394 ,000
Pressure Work ,293 ,100 ,287 2,932 ,004
a. Dependent Variable: Job Satisfaction Source: Primary Data, processed in 2017
Based on Figures 3 and Table 16 it can be seen that the direct effect of pressure work on employee performance is 0.365. While the influence of pressure work on employee performance through job satisfaction is 0,287 x 0,530 = 0,15211. In this case the direct influence is greater than the indirect effect so it can be said that the variable of job satisfaction is not as intervening variable.
V. CONCLUSIONS AND SUGGESTIONS
5.1. Conclusion
Work environment variables and pressure works affect employee performance simultaneously. F value count 39,953 and significance equal to 0,05. This value is less than 0.05. The r squared value of 45.7% means the working environment and pressure work affect the employee performance of 45.7% while the rest is influenced by other variables not included in the equation model.
Work environment variables affect the employee's performance partially. The value of t is 7,889. Value significance of 0.00. This value of significance is smaller than 0.05. The value of r squared is 0.393. This means that the effect of work environment on employee performance is 39.3% and the rest is influenced by other variables not included in the equation model.
Pressure work variable affects partially employee performance. The value of t is 3.845. Value significance of 0.00. This value of significance is smaller than 0.05. The value of r squared is 0.133. This means that the effect of pressure work variables on employee performance is 13.3% and the rest is influenced by other variables not included in the equation model.
The job satisfaction variable affects the employee's performance partially. Value significance of 0.00. This value of significance is smaller than 0.05. The value of r squared is 0.280. This means that the effect of the job satisfaction variable to the employee performance is 28.0% and the rest is influenced by other variables not included in the equation model.
The effect of work environment on employee performance is 0.627. The effect of work environment on employee performance through job satisfaction is 0,420 x 0,530 = 0,2226. In this case the direct effect is greater than the indirect effect so it can be said that the variable of job satisfaction is not as intervening variable.
The direct effect of pressure work on employee performance is 0.365. While the effect of pressure work on employee performance through job satisfaction is 0.287x 0.530 = 0.15211. In this case the direct effect is greater than the indirect effect so it can be said that the variable of job satisfaction is not as intervening variable.
5.2. Suggestion
Work environment needs to be considered in improving employee performance. The work environment includes the means employed by employees and non-physical conditions such as communication, organizational culture and so on. Companies need to maintain and maintain the equipment needed by employees so that they feel at home to work.
In addition, company management needs to pay attention to pressure work from its employees. Pressure work needs to be revisited. Excessive pressure works can result in employees feeling stressed by work but too weak pressure works will also impact employees' unpreparedness in getting the job done. Jobs are very slow to complete.
Job satisfaction also needs to be improved. Job satisfaction will occur if all employee needs are met. But companies also need to consider the company's ability to meet the employee's wishes.
REFERENCES
[1.] Amiroso, J dan Mulyanto. 2015. Influence Discipline, Working Environment, Culture Of Organization And Competence On Workers Performance Through Motivation, Job Satisfaction Regional Development Planning Board Of Sukoharjo Regency. International knowledge sharing platform, vol. 7, No. 36.
[3.] Barorah, A. 2013. Pengaruh Pengembangan Karir Dan Motivasi Terhadap Kinerja Dengan Kepuasan Kerja Sebagai Variabel Intervening (Studi kasus pada Politeknik Ilmu Pelayaran Semarang. www.academia.edu
[4.] Bemardin, H. John, 2003, Human Resources Management: An Experiential Approach 3rd edition, McGraw-Hill/Irwin, New York
[5.] Caroline dan Susan. 2014. Influence Of Career Development Of Employee Performance Int He Public Of University, A case of Kenyatta University. International journal of social science management and entrepreneurship 1 (2), 1-16
[6.] Davis, Keith and John W. Stroom. 2004. Organizational Behavior, HumanBehavior at Work, 10th Edition, International Edition, McGraw-Hill, New York.
[7.] Dessler Gary, 2005. Manajemen Sumber Daya Manusia, PT. Indeks Kelompok Gramedia, Jakarta [8.] Dessler, Gary, 2000,Human Resources Management, 8th Edition, Prentice Hall, International Inc. [9.] Faustino Cardoso Gomes. 2004. Manajemen Sumber Daya Manusia, Andi Offset, Yogyakarta [10.]Fred Luthans. 2006. Perilaku Organisasi – Edisi Sepuluh, Penerbit Andi, Yogyakarta
[11.]George, J., & Jones, G. 2002. Organizational Behavior – 3rd edition, Prentice-Hall, USA
[12.]Gibson, James L., John M.Ivancevich, and James H.Donnelly, 2006, Organization Behavior-Structure-Process, 7th Edition, Erwin Homewood, Boston.
[13.]Gee, The Liang. 2006. Manajemen Perkantoran, Trigenda Karya, Bandung
[14.]Grewal, Lopes, Kadis, Gall dan Salovey, P. 2006. Evidence That Emotional Intelligence Is Related To Job Performance And Effect And Attitude At Works. Journal psicothema, Vol. 18, Suppl. pp. 132-139. [15.]Hadari Nawawi. 2003. Manajemen Sumber Daya Manusia Untuk Bisnis yang Competitif, Gajah Mada
University Press, Yogyakarta
[16.]Handoko, T. Hani . 2003. Manajemen Sumber Daya Manusia, BPFE, Yogjakarta [17.]Hasibuan, M. 2005. Manajemen SDM. PT Bumi Aksara, Jakarta
[18.]Hasibuan, Malayu S.P. 2003. Manajemen : Dasar, Pengertian dan Masalah. Jakarta: Bumi Aksara. [19.]Ivancevich dan John M. 2007. Human Resources Management. Mc.Graw Hill
[20.]Jeffrey A. Mello. 2002. Strategic Human Resource Management, South-Western College Publisher, USA
[21.]Johan M. Ivancevich. 2006. Perilaku dan Manajemen Organisasi, Penerbit Erlangga, Jakarta
[22.]Keith Davis, John Newstrom. 2001. Organizational Behavior – Human Behavior at Work, McGraw Hill Higher, International Student Edition
[23.]Kevin R. Murphy, Jeanette N, Cleveland,. 2002. Understanding Performance Appraisal, Sage Publication - Prentice-Hall, USA
[24.]Khagendra Nath Gangai, Mahakud Chandra dan Sharma Vikas. 2016. Association Between Locus Of Control And Job Satisfaction In Employee: A Critical Review. Vol. 3. Issue 2, No. 10.
[25.]Kotteeswari, M dan Sharief. 2014. Job Stress And Its Impact On Employees Performance A Study With Reference To Employees Working In Bpos. International Journal of business and administration research review, Vol. 2, issued 4
[26.] KreitnerdanKinicki. 2005. PerilakuOrganisasi, Buku 1 Jakarta :SalembaEmpat
[27.]Luthans, Fred, 2002, Organizational Behavior, 7th Edition, McGraw-Hill.Inc, New York.
[28.]Malayu S.P. Hasibuan. 2007. Manajemen Sumber Daya Manusia, Dasar dan Kunci Keberhasilan, CV. Haji Masagung, Jakarta
[29.] Maltby, J., Day, L., Macaskill, A. (2007). Personality, Individual Differences and Intelligence. At http://en.wikipedia.org/wiki/Locus_of_control
[30.]Mangkunegara, Prabu Anwar. 2002. Manajemen Sumber Daya Manusia Perusahaan, Penerbit PT. Remaja Rosdakarya, Bandung
[31.]Manileti. 2013. Pengaruh pengembangan karir terhadap kepuasan kerja karyawan Human Reosurces Area 09 PT. Telkom, Tbk, Bandung. Hasil penelitian tidak dipublikasikan pada jurnal. Sumber: www.academia.edu
[32.]Mansoor, Jinnah, Fida, S, dan Ahmad, Z. 2011. Impact Of Job Stress On Employee Job Satisfaction, A Study On Telecomunication Sector Of Pakistan. Journal of business studeis quartely, Vol. 2, No. 3, pp. 50-56.
[33.]Marihot AMH Manullang. 2004. Manajemen Personalia, Gadjah Mada University Press, Yogyakarta [34.]Mathis, Robert L. dan Jackson, John R, 2004, Human Resources Management, 10th edition,
[36.]Moeljono, Djokosantoso. 2003. Budaya Korporat dan Keunggulan Koperasi. Jakarta: Elex Media Komputindo
[37.]Mutia S. Panggabean. 2004. Manajemen Sumber Daya Manusia, Ghalia Indonesia, Bogor
[38.]Nganga, James. 2015. The Impact Of Organizational Culture On Performance Of Educational. Journal IJBSSnet.com journal Vol 3 No. 8.
[39.]Noe, Raymond A, et al., 2003, Human Resources Management: Gaining a Competitive Advantage, 4 edition, McGraw-Hill/Irwin, New York
[40.]Pamudji. 2003. Studi Organisasi , Penerbit Andi, Yogyakarta
[41.]Payaman J. Simanjuntak, 2005. Manajemen dan Evaluasi Kerja. Lembaga Penerbit FEUI, Jakarta [42.]Payaman J.Simanjuntak,. 2005. Manajemen Sumberdaya Manusia, Penerbit BPFE-UI, Jakarta [43.]Pervez, Ali. M. 2010. Impact Of Emotions On Employee Performance: An Evidence From
Organization Of Pakistan. OIDA interntional Journal of sustainable development
[44.]Ponnu, D dan Hassan, Zubair. 2015. The Influences Of Organizational Culture On Performance Management. International Journal Of Accounting, Business And Management. Vol 1 (No. 1) April, 2015
[45.]Raziq, A dan Maulabakhsh, R. 2015. Impact Of Working Envionment On Job Satisfaction. Procedia Economics And Finance, 23, 717-725
[46.]Ricky W. Griffin. 2004. Manajemen, Penerbit Erlangga, Jakarta
[47.]Risma, D. 2012. Pengaruh Kecerdasan Emosional Terhadap Kinerja Karyawan. Educhild, Vol. 01, No. 1.
[48.]Robbbins dan Judge. 2007. Perilaku Organisasi, Jakarta : Salemba Empat
[49.]Robbins, P.Stephen, 1998, Organizational Behavior, 8th Edition, Prentice Hall, International.Inc., New Jersey.
[50.]Robbins, Stephen P. 2004. Perilaku Organisasi: Konsep, Kontraversi, Aplikasi, Edisi Bahasa Indonesia, Alih Bahasa : Pujatmoko, Prehallindo, Jakarta
[51.]Robert L. Mathis, John H. Jackson. 2002. Manajemen Sumber Daya Manusia, PT. Salemba Emban Patria, Jakarta
[52.]Rosemary Harrison. 2003. Human Resources Management, Addison Wesley, USA,
[53.]Sancoko. 2013. Pengaruh motivasi dan penilaian kinerja terhadap kepuasan kerja PT. Pos Indonesia. Hasil penelitian tidak dipublikasikan pada jurnal.
[54.]Sekaran, U. 2000. Research Methods for Business A Skill Building Approach, Third Edition. John Willy & Sons, Inc.
[55.]Simamora, Henry, 2001, Manajemen Sumber Daya Manusia, Edisi Kedua., Yogyakarta, STIE YKPN.
[56.]Simanjuntak, Payaman J. 2005. Manajemen dan Evaluasi Kerja. Jakarta : Lembaga Penerbit FEUI [57.]Sondang P. Siagian, 2008. Manajemen Sumber Daya Manusia, Bumi Aksara, Jakarta,
[58.]Sopiah. 2008. Perilaku Organisasi. Yogyakarta : Penerbit And
[59.]Sri, Harjanti. 2013. Pengaruh Kompleksitas Tugas, Locus Of Control Terhadap Kepuasan Kerja Auditor (Studi Kasus Auditor Kap Se Jateng Dan Diy). http://eprints.uns.ac.id/id/eprint/10439
[60.]Sturisno. 2012. Sumber Daya Manusia, Gramedia, Surabaya
[61.]Styanti, Prihatini dan Nareswari. 2015. Determinant Of Career Development Through Intervening Of Performance And Promotion On Employee: Evidence From Indonesia. International Journal Of Business And Management Invention, 2319-8028, vol 4, issue 6
[62.]Sudjana, 2003. Teknik Analisis Korelasi dan Regresi, Tarsito, Bandung, [63.]Sugiyono. 2007. Metode Penelitian Administrasi , Edisi - 2, Alfabeta, Bandung [64.]Sugiyono. 2008. Metode Penelitian Bisnis, CV. Alfabeta, Bandung,
[65.]Susilo Martoyo, 1992. Manajemen Sumber Daya Manusia. Jakarta : BPFE
[66.]T. Hani Handoko. 2004. Manajemen Personalia dan Sumberdaya Manusia, Penerbit BPFE, Yogyakarta
[67.]T. Hani Handoko. 2004. Manajemen, Penerbit BPFE, Yogyakarta
[68.]Terry, George R. 2003. Prinsip-prinsip Manajemen. Cetak ketujuh, Bumi aksara, Jakarta
[69.]Tika, Pabundu. 2006. Budaya Organisasi dan Peningkatan Kinerja Perusahaan. Jakarta : PT. Bumi Aksara.
[70.]Tobing, KL., DS. 2009. Pengaruh Komitmen Organisasional Dan Kepuasan Kerja Terhadap Kinerja Karyawan PT. Perkebunan Nusantara III di Sumatera Utara. Jurnal Manajemen dan Kewirausahaan, Vol. 11, No. 1
Jayapura, Papua). International Journal of Business and Management Invention, Vol 1, issued 1, pp. 69-76
[72.]Umar, Husein. 2002. Riset Pemasaran dan Perilaku Konsumen. PT. Raja Grafindo Persada, Jakarta [73.]Umar, Husein. 2004. Metode Penelitian Untuk Skripsi dan Tesis Bisnis, PT. Raja Grafindo Persada,
Jakarta
[74.]Umar, Husein. 2008. Riset Sumber Daya Manusia dalam Organisasi. Jakarta : PT Gramedia Pustaka Utama.
[75.]Wahyudi, 2002, Manajemen Sumber Daya Manusia, Sulita, Bandung [76.]Waluyo, Minto. (2013). Psikologi Industri. Jakarta: Akademia Permata