ISSN (Online): 2409-4285 w w w.IJCSSE.org Page: 166-176
Detection and Classification of Cassava Diseases Using Machine
Learning
Ozichi Emuoyi bofarhe1, Justice O. Emuoyi bofarhe2, Segun Adebayo3, Adebamiji Ayandiji4, Oloyede Demeji5 and
Oreoluwa James6
1, 3, 4, 5, 6 Department of Computer Science and Information Technology, Bowen University, Iwo, Osun State, Nigeria 2 Department of Computer Science and Engineering , Ladoke Akintola University, Ogbomosho, Oyo State, Nigeria
1[email protected], 2[email protected], 3[email protected], 4[email protected], 5[email protected], 6[email protected]
ABSTRACT
In this work, we develop and trained machine learning models for the detection and classification of cassava (M anihot esculenta Crantz) disease as Blight or M osaic. Our emphasis here was on two major cassava diseases that occur in Nigeria which are the Cassava M osaic Disease (CM D) and the Cassava Bacterial Blight disease (CBBD). A total of 46 models were trained in two categories from over 18,000 cassava leaf images was collected at different times of day containing leaves at different levels of symptom manifestation. One model diagnosed the healthy leaf and the other model detected the diseases that are present on the leaf when diagnosed as an unhealthy leaf and two most accurate models were exported. A 5-fold cross-validation was used to test the Cubic Support Vector M achine (CSVM ) model developed for health diagnosis and the Coarse Gaussian Support Vector M achine (CGSVM ) model developed for disease detection which yielded accuracies of 83.9% and 61.6% respectively .
Keywords: Author Guide, Article, Camera-Ready Format, Paper Specifications, Paper Submission.
1. INTRODUCTION
Machine learn ing is a co mputational proble m-solving method used in solving problems involving very co mple x patterns which will usually be unreasonable to expect a human progra mmer to e xp licit ly identify and develop into a program. The term mach ine learn ing also refers to the automated detection of meaningful patterns in data (Shalev-Shwart z and Ben-David, 2014), it is an applicable tool in disease detection that helps to control the adverse effect of the p lant diseases on food production generally. Furthermo re, the importance of this fact is strengthened when global demographic data is considered. The present estimated world population stands at 7.6 billion and by 2050, the wo rld population is projected to have reached a 10 billion ma rk. Despite these projected population, the landmass that is available
for the ever increasing hu man population re ma ins unchanged where out of which only 11.58% (17.25million sq. km, 6.66million sq.km) is for agricultural use. (Central Intelligence Agency, 2016; United Nations, Depart ment o f Econo mic and Social Affairs, Population Division, 2017) with the hu man population consuming about 2940 kca l per capita per day of food. (Vasileska, 2012).
Cassava (Manihot esculenta Crant z) is an annual root crop that grows in tropical and s ubtropical regions and the most widely grown root crop that produces an edible tuber which is a third ma jor source of carbohydrates after rice and ma ize for about 800 million people worldwide (FAO, 2013). Generally, it is classified as sweet or bitter based on the quantity of the cyanide compounds found in it and the global production is about 203 million megatonnes (Alexandratos and Bruinsma, 2012). Despite its usefulness to the existence of human, research has shown that over 30 diseases with causes ranging from virus to bacteria to fungi to many other agents but with most of their sy mptoms being visibly observable. The effects of these diseases also span a wide spectrum which can range fro m a ffecting p lant establishment and vigour to inhibit ing photosynthetic effic iency to causing preharvest or postharvest deterioration. In sub-Saharan Africa with Nigeria as the case study, the most predominant cassava diseases that are commonly found are Firstly the cassava bacterial b light disease (CBBD)
which is caused by the bacterium
spots then enlarge and merge to form large b rown patches which affect the lea f parts by the tips and eventually shows a superficially burnt appearance. (Antoine, Amégnikin and Wydra, 2016).
Secondly, the cassava mosaic wh ich is a v irus -induced cassava disease and found mostly in Africa and India with the identified causative Ge miniv iruses seem in the Indian cassava mosaic virus (ICM V), the African cassava mosaic virus (ACM V) and the East African cassava mosaic virus (EA CM V). The symptoms include observable mosaic patterns on the leaves of the affected plants, the leaf appearing pale yellow with only a t inge of green, general lea f wh iteness and leaf paleness. (CA BI, 2018).
2. REVIEW OF RELATED WORKS
During the late 1900s, cassava was assumed to be resistant to pests and to diseases. Researchers have discovered that over 30 d iseases ranging fro m v irus, bacteria, fungi and to many other agents seen in cassava plant. The effects of these diseases also span a wide spectrum which can range fro m a ffecting plant establishment and vigour to inhibiting photosynthetic efficiency thereby causing preharvest or postharvest deterioration. So me of the causal agents (virus, bacteria, and fungi) are distributed worldwide, appearing in a lmost all cassava plantations worldwide wh ile others are limited to specific regions, countries or continents possibly because their dissemination occurs main ly through the use of infected planting materia l for propagation. Due to the prevalence of the pests and diseases, the yield of the cassava crop has reduced so great leading to low productivity. Although the total losses caused by the Cassava Mosaic Disease are e xtre me ly difficult to estimate, it re ma ins a ma jor cause of yield loss. The losses depend on the variety and stage of infection, which can usually be substantial. Yie ld losses of 25-95% a re reported. (Bisimwa and Walangululu, 2015). Despite the challenges derive from the effect of the disease which leads to low yield in productions. Some researchers have carried out a number of studies on cassava disease and other plant-related diseases and among them are the agricu lturist, life scientists, and biologists.
In Sue Han Lee et a l 2017 presented a paper on how deep learning e xtracts and learns leaf features for plant classification and used convolutional neural networks (CNN) and deconvolutional network (DN) approach to obtain results that show that different orders of venation are the best representative features and that mu lti-level representation exists only in lea f data corresponding to species classes, which fits with the hierarchica l botanical definit ions of leaf characters. It was discovered that the
work grants insights into the design of new hybrid feature ext raction models and improves the discriminative power of p lant classification systems but focused more on the leaf feature e xtract ion rather than actual disease detection. Also, Konstantinos P. Ferentinos 2018 in a paper tit led deep lea rning models for plant d isease detection and diagnosis worked at developing convolutional neural network models to perform plant d isease detection and diagnosis using simp le leaves images of healthy and diseased plants, through deep learning methodologies. Training of the models was performed with the use of an open database of 87,848 images, containing 25 d ifferent plants in a set of 58 distinct classes of plant and disease combinations, including healthy plants. The work achieved the best performance of a very h igh success rate of 99.53% which deemed it significantly high resulting in the model to be a very useful advisory or ea rly wa rning tool but the dataset used contained unverified images causing inaccuracy in selected cases and the focus was not on cassava and/or cassava diseases. While in A manda Ra mcharan et al 2017 a work on deep learning for image-based cassava disease detection using a dataset of cassava disease images was considered which was taken in a fie ld in Tanzania. The researchers applied transfer learning to train a deep convolutional neural network in order to identify three d iseases and two types of pest damage. In their work the best-trained model accuracies we re 98% for brown leaf spot (BLS), 96% for red mite da mage (RM D), 95% fo r green mite da mage (GM D), 98% for cassava brown streak disease (CBSD), and 96% for cassava mosaic d isease (CMD) and the best model achieved an overall accuracy of 93% for data not used in the training process. Although the work used deep learning approach to achieve the overall accuracy of 93% when compared to traditional mach ine lea rning approaches and also used transfer learn ing wh ich offe rs a fast, affordable, and easily deployable strategy for digital plant disease detection but the work fails to address the occurrence of cassava bacterial blight disease.
3. METHODOLOGY
Cassava Bacterial Blight disease. The model in the first tier of the architecture (the health diagnosis model) used the Cubic Support Vector M achine (CSVM ) algorithm to classify the given image of the cassava leaf as being diseased or healthy while the model in the second tier of the architecture stipulate the disease detection model by the Coarse Gaussian Support Vector M achine (CGSVM ) algorithm to detect which of Cassava M osaic Disease or Cassava Bacterial Blight disease is present in the plant.
3.1 Model Development
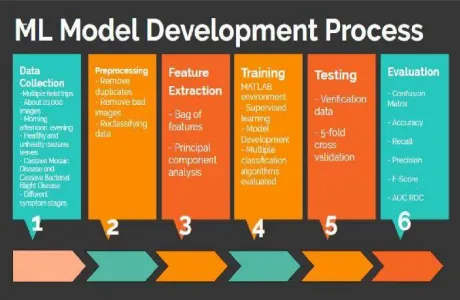
The development of the machine learning model trained process steps used are highlighted in Figure 1 and explained
Fig. 1. Machine Learning Model Training Process
3.1.1 Data Collection
The cassava leaf images were taken from thirteen field trips of three Bowen University, Iwo cassava farms and collected 18,000 images of the cassava leaves as primary data with commonly digital cameras of commercially acceptable specifications. The images were collected at different times of day morning, afternoon and evening, in order to increase the data variation so that the model developed, will not be restricted in accuracy to a particular time of day; the 18,000 collected images were distributed into 6,000 for morning, 6,000 for afternoon and 6,000 for evening images. All these images comprise healthy cassava leaves, leaves with Cassava M osaic Disease and leaf with Cassava Bacterial Blight Disease at different stages of symptom manifestation.
All the collected images were cleaned manually, preprocessed and labelled in preparation for the training of the predictive
model.Figure 2, Figure 3 and Figure 4 show the sample of the
collected images.
Fig. 2. Sam ple Healthy Training Data
Fig. 3. Sam ple Blight Training Data
Fig.4. Sam ple Mosaic Training Data
3.1.2 Preprocessing
In this data cleaning process, irregular and poor images were removed, the image size was normalized and the dataset was made ready for training, also wrongly classified images were reclassified and images with multiple diseases were placed in the dataset of both diseases.
3.1.3 Feature Extraction
descriptive attributes contained in the input data after the preprocessed data. This extraction method was used for both tier 1 and tier 2 of the architecture due to its remarkable simplicity and impressive performance where several features were extracted from the cleaned images used for the training of the models in the 2 tiers of the system that lasted for a duration of about 8 hours. Hence the pseudo code used for the feature extraction is as stipulated by firstly Load image data into an image data store object, then create a bag-of-features from the image data store, encode the image as new features and finally create a table using the encoded features.
In order to reduce the number of features that the algorithm needs for the development of the model, a principal component analysis (PCA) feature was introduced which is an in-built MATLAB facility was used to trim down the thousands of extracted features to 500 principal features for each tier of the architecture. The models were trained in the M ATLAB environment using supervised learning for the features extraction. Eventually resulted in the first tier having two data classes labelled “Healthy” and “Unhealthy” while for the second tier, the two data classes were labelled “Mosaic” and “Blight”. Also for the experiment to run perfectly a range of 23 learning algorithms in 6 categories such as discriminant analysis, logistic regression Classifiers, support vector machines, nearest neighbour classifiers, ensemble classifiers and decision trees) were trained for both tiers of the architecture. M ultiple algorithms were trained so that a comparison can be made in search of the choice of the best algorithm. Five (5)-fold cross- validation was employed in testing the model. Cross-validation was preferred to holdout validation because it gives the model the opportunity to train on multiple train-test splits which gives a better indication of how well the model performs on unseen data whereas the holdout method uses a single train-test split and the score depends on how the data is split into train and test sets.
We analyzed the accuracy of the training of the final layer developed using M ATLAB for the new cassava image datasets with the two different architectures by considering the following metrics: where TP stands as the true positives, FP stands as the false positives, FN stands as the false negatives and TN stands as the true negatives.
Hence to calculate the accuracy of the model, we will have the overall ratio of rightly predicted values (true positives and true negatives) to the total population accuracy to be
TP
TN
FP
FN
TN
TP
Accuracy
To minimize false negatives that is the number of times a diseased model is classified as healthy, then the recall sensitivity prediction accuracy was used to calculate actual positives and false negatives when not to be tolerated and which formula is
FN
TP
TP
ediction
y
Sensitivit
call
Pr
Re
Furthermore to minimize false positives that is the number of times a healthy model is classified as diseased, then the precision formula was used to calculate the performance indicator about positive predictions and when false positives cannot be tolerated, which formula is
FP
TP
TP
ecision
Pr
Also for F-Score which is the harmonic mean of recall and precision and a balance between recall and precision which was a suitable alternative to accuracy. It is calculated by:
call
ecision
ecision
call
Score
F
Pr
*
Re
Pr
*
Re
*
2
Similarly, AUC-ROC, where AUC refers as the Area Under Curve and ROC, is Receiver Operating Characteristics. AUC-ROC curve is a performance measurement for classification problem at various thresholds settings. The ROC curve summarizes each confusion matrix that each threshold produces and also helps to find the optimal threshold for the mod el based on the level of false positives or false negatives tolerable to the problem being considered. The larger the area under the ROC curve, the better the algorithm performance. Hence the formulas are shown below:
The True Positive Rate (TPR) is calculated by:
FN
TP
TP
TPR
andThe False Positive Rate (FPR) is calculated by:
FP
TN
FP
FPR
The ROC curve is plotted with True Positive Rate (TPR) against the False Positive Rate (FPR) where TPR is on y -axis and FPR is on the x-axis.
3.1.4 System Testing
The developed mobile application system was taken for live field testing to different cassava plants in order to evaluate and examine the validity of the work developed at different times of day- morning, afternoon and evening. From the testing analysis, we discovered that some of the plants were healthy, some had Cassava M osaic Disease (CM D) while some are Cassava Bacterial Blight Disease (CBBD). Thereby allowing the plants in all of these categories to adequately detected.
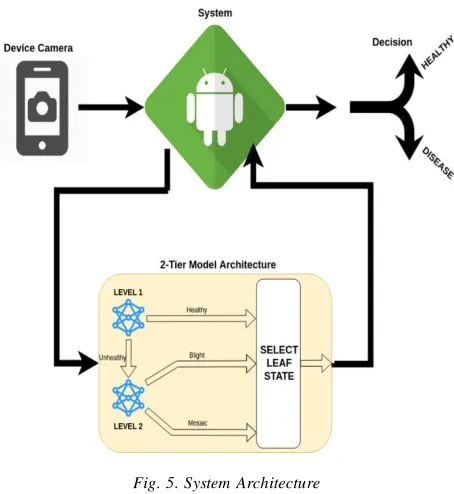
3.2 System Architecture
The system developed from the M ATLAB models is a 2 tier system where the first level detects if the disease is healthy or not and the second tier detects which of the diseases the plant suffers from- either Cassava M osaic Disease (CM D) or Cassava Bacterial Blight Disease (CBBD).
Fig. 5. System Architecture
A Unified M odelling Language (UM L) diagram that shows the actors in the system with their different functions performance and interactions among the elements of the system is shown in figure 6. From the diagram, it shows the single actor “User” and the interactions with the system.
Fig. 6. ULM Diagram of the cassava disease detection System
4. RESULT
In order to put up the newly developed system into operation (using the approach that was stated in the methodology and also to achieve the objectives of this research, the theoretical design into a working system was converted and components of the system were also tested and evaluated using the hardware specifications which includes a laptop or desktop (64 bit) with Random Access M emory of 8GB minimum, Intel Core i5 CPU
2.40GHz minimum , Camera (20 megapixels minimum) and 50mm Lens minimum and software requirements for the development of the systems which also includes Windows Operating System 10 and M ATLAB 2018.
4.1 Results from the Feature Extraction
Fig. 7. Health Feature Extraction Result
This shows that 1,265,804 features were extracted from the images used in training the model to predict the health of the plant as shown in the screenshot.
Fig. 8. Disease Feature Extraction Result
1,129,538 features were also extracted from images used in training the model used to detect the exact disease of the plant as shown in the screenshot in figure 8
Fig. 9. Sam ple Plot of Bag of Features
Features for both health classification and disease classification were extracted using the Bag of Features feature extraction method. Principal Component Analysis (PCA) was then used in grouping the related features into 500 and reduce the bag of features to contain only 500 predictors. A sample of the bag of features is shown in figure 9.
Fig. 10. Health Classification Algorithm s and their Respective Accuracies
The health classification model detects whether or not the image of the leaf given is healthy. It uses 500 principal components extracted during the feature extraction stage as predictors and it gives a 2 class response (“Healthy” or “Unhealthy”). In the model development process, 23 machine learning algorithms were trained in M ATLAB and the most accurate model, which was a Cubic Support Vector M achine (SVM ), was exported in figure 10.
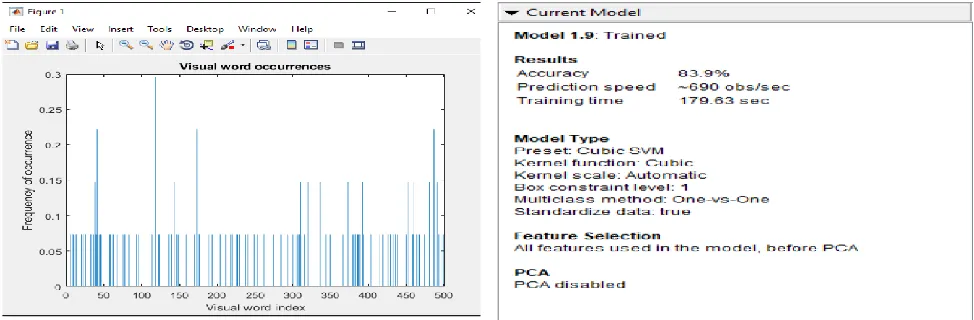
Fig. 11. Health Classification Model (Cubic SVM) Details
This display s that the Cubic Support Vector M achine model had an accuracy of 83.9% using 5-fold cross-validation and a prediction speed of about 690 objects/second.
Fig. 12. Health Classification Model (Cubic SVM) Scatter Plot
The scatter plot depicting the correct and incorrect predictions shown in figure 12 reveals that the majority of the correct predictions fall directly on the vertical or horizontal line perpendicular to the origin (i.e. when the x-axis predictor and the y-axis predictor are alternately equal to zero). This pattern reveals an insight that can be used to simplify the prediction into an equation of a line based on the two predictors.
Fig. 13. Health Classification Model (Cubic SVM) Confusion Matrix of Num ber of Observations
From the results obtained from the numbers of observations for each class the values then becomes from the health classification confusion matrix displays shows that the true positives for Healthy dataset are 1261 and false positives for the healthy is 447 while true negatives for Unhealthy is 8240 and finally false negatives for Unhealthy is 1371 observations. It is noted that the rationale for the decisions of large sample size for the unhealthy at the instances of the high false negative rate generated is to allow a disproportionately large sample size for unhealthy instances and a high false negative rate so that detection of the disease in the cassava plant which is the aim of the work will be clearer and stated. This implies that the model should be supplied with much more samples of the diseased cassava leaf images so that better patterns for diseases that appear on the leaf will be discovered. It is also a better decision, in terms of potential yield loss, to classify healthy cassava as being unhealthy than to leave an unhealthy cassava plant without treatment because of the wrong classification of the unhealthy plant as being healthy.
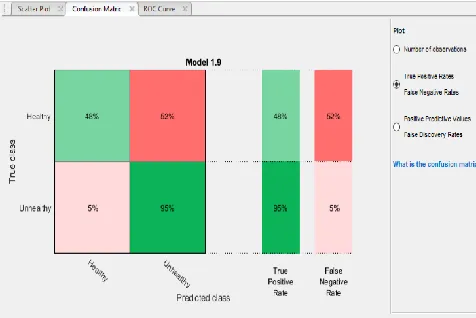
Fig. 14. Health classification model (Cubic SVM) confusion matrix of true positive and false negative rates.
Figure 14 shows the true positive rates and the false negative rates for both healthy and unhealthy predictions using the (Cubic SVM )
Fig. 15. Health Classification Model (Cubic SVM) Confusion Matrix of Positive
This describes the positive predicted value and the false discovery rate for both healthy and unhealthy predictions using the (Cubic SVM ).
Fig. 16. Health Classification Model (Cubic SVM) ROC Curve
This describes the area under the receiver operating characteristics curve (AUC ROC) which is 0.85 which implies that with an 85% as the value from the Cubic SVM model, the system can differentiate between a healthy class and an
unhealthy class.
4.2 Disease Classification Model Development
using (Coarse Gaussian SVM) model
Fig. 17. Disease Classification Algorithm s and their Respective Accuracies
In the model development process, 23 machine learning algorithms were trained in MATLAB and the most accurate model, which was a Coarse Gaussian Support Vector M achine (SVM ) was exported in figure 17 above.
Fig. 18. Disease Classification Model (Coarse Gaussian SVM) Details
This displays that the Coarse Gaussian Support Vector M achine model had an accuracy of 61.3% when 5-fold cross-validation and a prediction speed of about 560 objects/second was used.
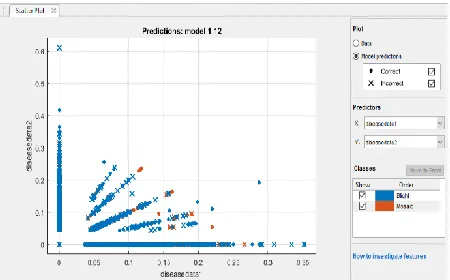
Fig. 19. Disease Classification Model (Coarse Gaussian SVM) Scatter Plot
The scatter plot depicts the correct and incorrect predictions, also reveals that the majority of the correct predictions fell directly on the vertical or horizontal line perpendicular to the origin (i.e. when the x-axis predictor and the y -axis predictor are alternately equal to zero) and the others fell in a straight line with different slop es.
Fig. 20. Disease Classification Model of Confusion Matrix for the
Num ber of observations
From the results obtained from the number of observations for each class, it shows that both the false negatives and false positives values are high due to the recurrence of images of leaves with both diseases (Blight and M osaic) in the dataset. Also have the values of the observations to be true positives for Blight is 3624 while false positives for Blight is 2237 then true negatives for M osaic is 2668 and finally false negatives for the unhealthy is 1679.
Fig. 21. Disease Classification Model of Confusion Matrix for True Positive and False Negative Rates
Fig. 22. Disease Classification Model of Confusion Matrix for Positive Predicted Values and False Discovery Rates.
The positive predicted value and the false discovery rate for both healthy and unhealthy predictions is shown from the screenshot of the result.
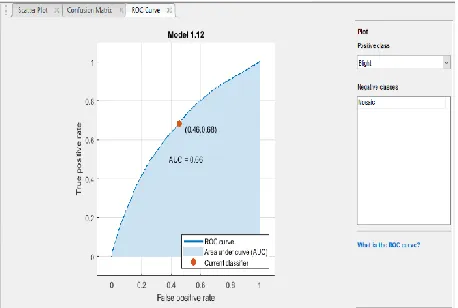
Fig. 23. Disease Classification Model (Coarse Gaussian SVM) ROC Curve
The area under the receiver operating characteristics curve (AUC ROC) is 0.66 and with the 66% obtained the model can differentiate between an instance of cassava mosaic disease and cassava blight disease.
3.2 The General Workings of the System
The Cassava Disease Detection model has been deployed on a desktop application. The graphical user interface of the application was developed using the M ATLAB application designer package. The Cassava Disease Detection Software has the following screenshot results.
The Home Page
Fig. 24. The Hom e Page
The home page contains a splash screen introducing the application and an option to proceed to the disease detection page. The purpose of this page is to add aesthetic value that
makes the application both branded and user-friendly
The Disease Detection Page
Fig. 25. Disease Detection Default Page
Fig. 26. Disease Detection Load Im ages Interface
Fig. 27: Disease Detection Page Feature Extraction Process in MATLAB
The features of the images selected for validation are extracted before the prediction is done based on these features. The result of the feature extraction of a sample validation image is shown in figure 27.
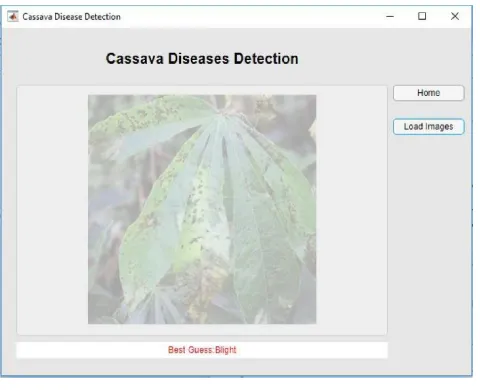
Fig. 28. Disease Detection Page Sam ple Prediction
When the folder containing the validation data is selected and the image features extracted, the images therein and their respective predictions are shown as illustrated in figure 28.
5. CONCLUSION
In recent times, researchers have made a number of efforts towards the development of an intelligent system for the detection of diseases in all human and agricultural sphere, but the proposed system is developed only for the training of machine learning model that will be used to detect cassava disease. This study have demonstrated that with the development of a cubic support vector machine model having an accuracy of 83.9%, the leaf image will predict the status whether it is healthy or unhealthy and also with a Coarse Gaussian Support Vector M achine with an accuracy of 61.6% that was developed will classify the disease as either Blight or M osaic. Hence, the purpose of this research which is to develop a trained machine learning system that detects the Cassava M osaic Disease (CM D) and the Cassava Bacterial Blight Disease (CBBD) when compared with manual disease detection method for cassava diseases. This can also be deployed on other platforms using a web server, an unmanned aerial vehicle/drone, etc.
REFERENCES
[1] Al-Abri, E. S. 2016. M odelling Atmospheric Ozone
Concentration Using M achine Learning Algorithms.
Retrieved from
https://pdfs.semanticscholar.org/aea1/a78fadcb37b5c af6f11ac22559d3b01a153f.pdf.
[2] Alexandratos, N. and Bruinsma, J. 2012. World
Agriculture towards 2030/2050: the 2012 revision.
WORLD AGRICULTURE. Retrieved from
www.fao.org/economic/esa.
[3] Antoine Fanou, A., Amégnikin Zinsou, V. and
Wydra, K. 2016. Cassava Bacterial Blight: A Devastating Disease of Cassava Provisional chapter Cassava Bacterial Blight: A Devastating Disease of Cassava. http://doi.org/10.5772/intechopen.71527. [4] Bisimwa, E., Walangululu, J. and Bragard, C. 2015.
Cassava M osaic Disease Yield Loss Assessment under Various Altitude Agroecosystems in the Sud-Kivu Region, Democratic Republic of Congo.
TROPICULTURA (Vol. 33). Retrieved from
www.vsni.co.uk .
[5] Cabi. 2018. Cassava mosaic disease (African cassava
mosaic). Retrieved November 3, 2018, from https://www.cabi.org/isc/datasheet/2747.
[6] Central Intelligence Agency. 2018. The World
Factbook. Retrieved October 8, 2018, from
https://www.cia.gov/library/publications/the-world-factbook/index.html.
[7] FAO. 2013. Save and grow: Cassava. Retrieved from
http://www.fao.org/3/a-i3278e.pdf.
[8] Ferentinos, K. P. (2018). Deep learning models for plant disease detection and diagnosis. Computers and Electronics in Agriculture, 145, 311-318.
[9] Hurwitz, J. and Kirsch, D. 2018. M achine Learning
IBM Limited Edition. Retrieved from
http://www.wiley.com/go/permissions.
[10]Lee, S. H., Chan, C. S., M ayo, S. J. and Remagnino,
features for plant classification. Pattern Recognition, 71, 1-13.
[11]Leskovec, J., & Rajaraman, A. 2010. CS345a: Data M ining Clustering Algorithms. Retrieved from https://web.stanford.edu/class/cs345a/slides/12-clustering.pdf.
[12]M ohammed, M ., Khan, M . and Bashier, E. 2016.
M achine learning: algorithms and applications.
Retrieved from
https://www.taylorfrancis.com/books/9781498705394 [13]O’Hara, S., & Draper, B. A. (2011). Introduction to
the Bag of Features Paradigm for Image
Classification and Retrieval. Retrieved from
http://arxiv.org/abs/1101.3354.
[14]Ramcharan, A., Baranowski, K., M cCloskey, P.,
Ahmed, B., Legg, J. and Hughes, D. P. 2017.Deep
Learning for Image-Based Cassava Disease
Detection. Frontiers in Plant Science, 8, 1852. http://doi.org/10.3389/fpls.2017.01852.
[15]Shalev-Shwartz, S., and Ben-David, S. 2014.
Understanding machine learning: From theory to
algorithms. Retrieved from
https://scholar.google.com/scholar?hl=en&as_sdt=0% 2C5&q=Understanding+M achine+Learning%3A+Fro m+Theory+to+Algorithm&btnG= United Nations, Department of Economic and Social Affairs, Population Division, (2017). World Population Prospects: The 2017 Revision, Key Findings and Advance Tables. ESA/P/WP/248. Retrieved from https://population.un.org/wpp/Publications/Files/WPP 2017_KeyFindings.pdf.
[16]Vasileska, A., Sciences, G. R.-P.-S. and B., 2012, undefined. (2012). Global and regional food consumption patterns and trends. Elsevier.Retrieved from