Original Research Article
Health profile of school children of two schools in Palghar
district, western Maharashtra, India
Meena Kakeri
1, Prashant V. Howal
2*, Yasmeen F. Chaudhari
3INTRODUCTION
Healthy childhood is the basis for healthy and productive adult life. School is a place where apart from formal education children also learn behavioral, lifestyle and moral values.1 Malnutrition a public health problem increases the vulnerability of child to a variety of diseases in later life.2 Majority of available health services, including school health services are delivered through a network of primary health care centers. The school health programme has low priority among national health programmes.3 The medical and health related facilities are very rarely available to the people in tribal area.4 Extensive surveys have been carried out in different parts of the country and the finding shows that sickness and morbidity rates in Indian schools are among the highest in the world.5 Poor health and sickness absenteeism may
result in school dropouts. The dropout rate is more among the female children as compared to male children. Palghar district is predominantly tribal district which has recently witnessed tribal child malnutrition.6 With this background the present comparative study was conducted to explore the nutritional status, morbidity pattern among government school and another private school in tribal district of Palghar, Western Maharashtra, India.
METHODS
A cross-sectional study was conducted during the period of March 2018 to April 2018, amongst 400 primary school children (Government school=200 and private school=200) of Palghar district, Western Maharashtra. The school were situated in the catchment area of rural health unit of a medical college. A multistage stratified
ABSTRACT
Background: Healthy childhood is basis for healthy and productive adult life. Mortality in school age children is low but morbidity and physical defects constitute major problems. With this background the present comparative study was conducted to explore the nutritional and morbidity patterns among government run primary school children and private school children in Palghar district, Maharashtra.
Methods: A descriptive cross-sectional study was conducted during March 2018 in both government school and other private school. Total 400 children studying in class 1 to 4 were included. A pre-designed and pretested questionnaire was used during the interview and clinical examination was carried out to study nutritional status and morbidity pattern among the school children.
Results: Out of 400 children, 61 (15.25%) were underweight, 82 (20.5%) were stunted, and 8 (2.0%) were obese. Dental caries was commonest morbidity (55.25%). Two study subjects (1.0%) had suspect cardiac problems.
Conclusions: Under-nutrition and morbidities are prevalent in present study. Periodic complete health evaluation should be planned for early diagnosis of nutritional and morbid health problems.
Keywords: Primary school, Health profile, Nutritional status, Morbidity
1
Professor, 2Assistant Professor, 3Junior Resident, Department of Community Medicine, Grant Government Medical College, Mumbai, Maharashtra, India
Received: 21 September 2018
Accepted: 08 October 2018
*Correspondence:
Dr. Prashant V. Howal,
E-mail: [email protected]
Copyright: © the author(s), publisher and licensee Medip Academy. This is an open-access article distributed under the terms of the Creative Commons Attribution Non-Commercial License, which permits unrestricted non-commercial use, distribution, and reproduction in any medium, provided the original work is properly cited.
random sampling method was used to select the school. In first stage, the schools were divided into two strata, government schools and private schools. Out of each stratum one private and one government school were selected randomly. Written permission was taken from the school authorities prior to the beginning of study. Children enrolled in class 1-4 were included. Convenient sampling was used and all children present on the day of school visit were included in the study. Instrument used for interview was predesigned questionnaire, to collect data on socio-demographic details, clinical history and physical examination for provisional diagnosis. Visual acuity was measured using Snellen’s chart, anthropometric measurements and physical examination was performed in the room made available in the school premise. Height was measured to the nearest 0.5cm. Weighing scale was used to measure weight to the nearest 1 kg. BMI was calculated using the formula Body mass index = (Weight in kg/Height in metre).2
Grade of malnutrition was done using WHO reference tables as mentioned below:3
WHO ‘Z’ score chart: They were used to categorize: weight for age (WAZ), height for age (HAZ) and BMI for age. Scores were categorized into <–3 SD, – 2 to –3 SD, normal and >2 SD.
Weight for age: According to WHO 2007 Z score charts: WAZ <–3 SD (standard deviation) implies severe underweight, –2 to –3 SD implies mild to
moderate underweight and >-2 SD implies normal/ healthy status.
Height for age: In case of HAZ, <-3 SD implies severe stunting, –2 to –3 SD implies mild to moderate stunting and >–2 SD implies normal status.
BMI for age: In case of BMI: <–3 SD implies severe thinness –2 to –3 SD implies mild to moderate thinness, –2 SD was normal and >2 SD implies obesity.
Data analysis
Data was entered and analysed with Microsoft excel spread sheet. WHO Anthro-plus software was also used. Chi square test was used as test of significance. For all statistical test applied, p<0.05 was considered as statistically significant.
RESULTS
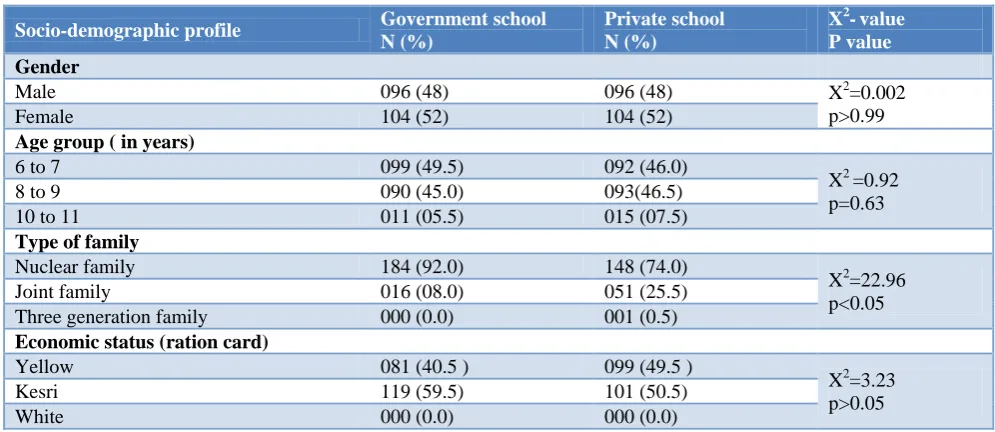
It was observed from Table 1 that, 81 (40.5%) and 99 (49.5%) children belonged to below poverty line (yellow ration card) government and private school respectively. Similarly, 119 (59.5%) and 101 (50.5%) children belonged to above poverty line from government and private school respectively. In government school children 184 (92%) of belonged to nuclear family and 16 (8%) belonged to joint family, while 148 (74%) children in private school belonged to nuclear family, 51 (25.5%) belonged to joint family.
Table 1: Socio-demographic profile of the study population (n=200).
Socio-demographic profile Government school N (%)
Private school N (%)
X2-value P value Gender
Male 096 (48) 096 (48) X2=0.002
p>0.99
Female 104 (52) 104 (52)
Age group ( in years)
6 to 7 099 (49.5) 092 (46.0)
X2 =0.92 p=0.63
8 to 9 090 (45.0) 093(46.5)
10 to 11 011 (05.5) 015 (07.5)
Type of family
Nuclear family 184 (92.0) 148 (74.0)
X2=22.96 p<0.05
Joint family 016 (08.0) 051 (25.5)
Three generation family 000 (0.0) 001 (0.5)
Economic status (ration card)
Yellow 081 (40.5 ) 099 (49.5 )
X2=3.23 p>0.05
Kesri 119 (59.5) 101 (50.5)
White 000 (0.0) 000 (0.0)
It was seen from Table 2 that according to WHO Z scores, the overall prevalence rate of mild to moderate underweight children was 61 (15.2%) severe underweight was 34 (8.5%). The prevalence rate of mild to moderate underweight was significantly higher among private school children 36 (18%) compared to 25 (12.5%) among government school children. Similarly, prevalence of
school children, while 11 (5.5%) private school children were severely stunted compared to only 4 (2.0%)of government school children. The prevalence of obesity
was also higher among private school children 7 (3.5%) as compared to 1 (0.5%) among government school children.
Table 2: Nutritional status of two school children as per the WHO criteria.
Nutritional status Govt. school Male No. (%)
Private school Male
No. (%)
Total (%)
Govt. school Female No. (%)
Private school Female No. (%)
Total (%)
Weight for age (underweight) #
Normal 085 (81.7) 073 (70.2) 158 (76.0) 80 (83.3) 67 (69.8) 147 (76.6) Mild to moderate
under weight 013 (12.5) 019 (18.3) 032 (15.4) 12 (12.5) 17 (17.7) 029 (15.1) Severe under weight 006 (05.8) 012 (11.5) 018 (08.6) 04 (04.2) 12 (12.5) 016 (08.3) Total 104 (100.0) 104 (100.0) 208 (100.0) 96 (100.0) 96 (100.0) 192 (100.0)
Height for age (stunting) @
Normal 84 (80.8) 83 (79.8) 167 (80.3) 76 (79.2) 75 (78.1) 151 (78.6) Mild to moderate
stunting 19 (18.3) 14 (13.5) 033(15.9) 15 (15.6) 11(11.5) 026 (13.5) Severe stunting 01 (00.9) 07 (06.7) 008 (03.8) 05 (05.2) 10 (10.4) 015 (07.8) Total 104 (100.0) 104 (100.0) 208 (100.0) 96 (100.0) 96 (100.0) 192 (100.0)
BMI for age (thinness) *
Normal 89 (85.6) 72 (69.2) 161 (77.4) 89 (92.7) 80 (83.3) 169 (88.0) Mild to moderate
thinness 12 (11.5) 19 (18.3) 031 (14.9) 05 (05.2) 11 (11.5) 016 (08.3) Severe thinness 03 (02.9) 08 (07.7) 011 (05.3) 01 (01.0) 03 (03.1) 004 (02.1) Obese 00 (00.0) 05 (04.8) 005 (02.40) 01 (01.0) 02 (02.1) 003 (01.6) Total 104 (100.0) 104 (100.0) 208 (100.0) 96 (100.0) 96 (100.0) 192 (100.0)
# X2 value=9.797, df=2, p<0.0074; @ X2 value=6.646, df-=2, p<0.036; *X2 value=13.41, df=3, p<0.003.
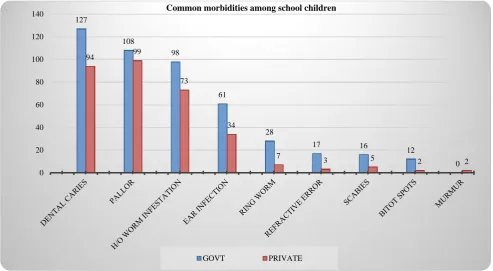
Figure 1: Morbidity pattern amongst two school.
As seen from Figure 1 that the prevalence of ring-worm was 28 (14.0%) among government school children while
in private school children it was 7 (3.5%). Refractive error among government school children was 17 (8.5%) and among private school children it is 3 (1.5%). Scabies
0 20 40 60 80 100 120 140
127
108
98
61
28
17 16 12
0
94 99
73
34
7
3 5 2 2
Common morbidities among school children
was found among 16 (8.0%) of government school children compared to 5 (2.5%) among private school children. Bitot’s spots were found in 12 (6.0%) of government school children and 2 (1.0%) in private school children. Cardiac murmur was found in 2 private school children (1.0%). Most common morbidity found was dental caries 127 (63.5%) among government school children and 94 (46.0%) among private school children followed by pallor 108 (54.0%) among government school children compared to 99 (49.5%) among private school children. Ninety eight (49.0%) of government school children had history of worm infestation compared to 73 (36.5%) children of private school. Ear infection was as high as 61 (30.5%) among government school children as compared to 34 (17.0%) among children of private school.
DISCUSSION
As per National family household survey NFHS-4 (2015-16), the prevalence of underweight, stunting and severe wasting in Maharashtra state among under five children was 40.0%, 38.4% and 9.4% respectively.8 Similarly for Thane district the prevalence of underweight, stunting and severe wasting among children less than 5 years was 32.0%, 31.8% and 6.4% respectively. The prevalence of underweight and stunting in our study was 15.2%, 20.5% respectively. This could be due to smaller sample size and older children i.e. above 5 years in our study. In study by Abraham et al in Pondicherry, the prevalence of stunting was 10.4%, including 0.1% of severely stunted children.1 Our study findings were similar to the findings in studies by Ashok et al and Saraswathi et al among children aged 13-17 years in Mysore city.2,9 A study done by Pise et al in Mumbai city revealed that the 8.9% of stunting and 14.4% of wasting among children.10
In present study, malnutrition was equally distributed among girls and boys. However, a study in urban area of Guntur on school children showed that malnutrition was significantly more in boys when compared with girls.11 There is a significant finding of malnutrition being higher in private school as compared to government school suggesting that focus should be given to private schools as they are not covered under national flagship programmes.
In present study, Dental caries was 127 (63.0%) and 94 (46.0%) in government and private school respectively followed by pallor 108 (54.0%) and 99 (49.5%). Similarly a study done by Pise et al in Mumbai city revealed that higher prevalence of dental caries (44.4%) was noticed among study subjects though almost equally distributed in both gender.10 The overall prevalence of anemia was 75.1% with 16.3% severe, 28.4% moderate and 30.4% mild anemia. Girls were affected more than boys (84.4% vs 62.7%). Another study conducted in Solapur, Maharashtra by Rajput et al the commonest morbidity found was dental caries (55.1%) followed by Pallor (15.6%) and cardiac murmur was found in 0.3% school children. A total of 15.5% children were thin (low
BMI for age). Similar findings were also seen in another study by Gokhale et al in tribal area.5
CONCLUSION
Key finding of the study are children suffer from more than one form of malnutrition, more among private school than government school. Periodic screening for health problems should be planned in collaboration with school authorities. Thus, considering the poor nutritional status and related morbidities an intervention focusing health education efforts based on local epidemiology and behavioral practices is needed. This study also highlighted the need for health education of children with regard to personal hygiene and common diseases along with provision of necessary materials like soaps and oils etc., under supervision by institutional staff will go a long way in controlling these infections.
ACKNOWLEDGEMENTS
Authors would like to thank principals of both the schools and school authorities for co-operating toward health appraisal, Dr. Pradnya Pawar, Junior Resident, and all the interns posted at rural health unit, Palghar for assisting in comprehensive health examination.
Funding: No funding sources Conflict of interest: None declared
Ethical approval: The study was approved by the Institutional Ethics Committee
REFERENCES
1. Abraham SB, Chauhan RC, Rajesh M, Purty AJ, Singh Z. Nutritional status and various morbidities among school children of a costal area in South India. Int J Res Med Sci. 2015;3:7718-22.
2. Ashok NC, Kavitha HS, Kulkarni P. A comparative study of nutritional status between government and private primary school children of Mysore city. Int J Health Allied Sci. 2014;3(3):164-69.
3. WHO information series on school health. Improving health through schools: national and international strategies. Available at http://www.who.int/school_youth_health/media/en/ 94.pdf?ua=1. Accessed on 9th June 2018.
4. Patange R. Socio-Economic Study of Tribal Households in Palghar District (MS) (Doctoral dissertation, DBSKKV, Dapoli). Available at http://krishikosh.egranth.ac.in/handle/1/5810028976 Accessed on 10th June 2018.
5. Gokhale CN, Borgaonkar CA, Shanbhag SS, Solanki MJ, Rasal MM. Morbidity pattern among primary school children in a tribal area of Maharashtra. Int J Community Med Public Health. 2018;5:165-69.
7. Panda P, Benjamin AI, Shavinder Singh, Zachariah P. Health status of school children in Ludhiana city. Indian J Community Med: 2000;25(4):150-5. 8. National Family Household Survey (NFHS-4)
(2015-16). Available at http://rchiips.org/NFHS/ pdf/NFHS4/MH_FactSheet.pdf. Accessed on 10th June 2018.
9. Saraswathi YS, Mohsen N, Gangadhar MR, Suttur SM. Prevalence of childhood obesity in school children from urban and rural areas, Mysore, Karnataka, India. J Life Sci. 2011;3:51-5.
10. Pise KH, Giri PA, Sankarnarayanan S. Nutritional status and morbidity profile of institutionalized children in an urban slum of Mumbai city. Asian J Med Res. 2012;1(3):74-8.
11. Madhavi KVP, Kumar BA. A study on morbidity pattern of school children aged 5-15 yrs in an urban area of Guntur. J Evol Med Dental Sci. 2013;2(34):6566-72.
12. Rajput RR, Mangulikar SK, Howal PV. Health profile of government aided private school children in urban slum of Solapur, Southern Maharashtra, India. Int J Res Med Sci. 2016;4:2728-33.