ownerShiP ConCentration
anD FirM ValUe
a Panel Data analysis on the impact of ownership
Concentration on Firm Value
This study examines the impact of ownership concentration on firm value. This study finds a negative and significant relationship between ownership concentration (measured by aggregate substantial shareholdings and the presence of controlling shareholders) and firm value. This suggests that large or controlling shareholders can extract the private benefits of control which in turn leads to lower firm value. The results support the rent extraction hypothesis, but not the agency relationship.
Keywords: ownership concentration, firm value, panel regression
Lukas Setia Atmaja
Prasetiya Mulya Business School [email protected]
control (Lamba and Stapledon, 2001; Nenova, 2003). Barclay and Holderness (1989) were the first to quantify private benefits of control for large shareholders. They found that on average, large blocks of stock typically traded at a premium of around 20 per cent to the post-trade market price. They interpret these premiums as suggesting that in most firms, the net private benefits of large block ownership are positive. In a study on the determinants of corporate ownership structure, Lamba and Stapledon (2001) reported a significant positive relationship between ownership structure and private benefits of control for Australia measured by the level of related party transactions (p. 26). In a cross-country study on the value of corporate voting rights and control, Nenova (2003) also reported significantly higher mean and median values of control-block votes for Australia compared to other common law countries (i.e., Canada, Hong Kong, South Africa, the U.K, and the U.S.), suggesting that controlling shareholders of Australian firms are able to extract private benefits of control from minority shareholders.
In contrast, other common law countries with strong systems of legal shareholder protection and high levels of ownership concentration such as the U.K., Canada, New Zealand and South Africa do not exhibit such high levels of private benefits (Nenova, 2003). It should be noted that legal protection of minority shareholders is not the only institutional variable that determines levels of private benefits of control (Dick and Zingales, 2001). Other variables such as market for corporate control and institutional investor
activism may also be associated with levels of private benefits of control. In addition, not all private benefits of control involve blockholders misappropriating assets at the expense of minority shareholders which is strictly constrained by Australian corporate laws. For example, some private benefits are intangible (e.g., prestige, preferences for power, family recognition, etc) (Lamba and Stapledon, 2001).
Using panel data over an eleven-year period from January 1994 to December 2004, this study finds a negative and significant relationship between ownership concentration (measured by aggregate substantial shareholdings and the presence of controlling shareholder) and firm value. This suggests that although Australia has a strong legal protection, large or controlling shareholders in Australian firms still can extract the private benefits of control which in turn leading to lower firm value.
Ownership Structure
The relationship between agency problems and ownership structure can be explained by Jensen and Meckling’s (1976) theory. Jensen and Meckling theorized that ownership structure may be chosen to minimise the sum of agency costs and diversification costs. Agency problems will be lower when the interests of agents (i.e., managers) and principals (i.e., shareholders) are more aligned through higher managerial share ownership. Accordingly, Jensen and Meckling implied that an owner’s direct involvement in the management of the firm would reduce the cost of mitigating information asymmetries
T
he seminal study of Berle and Means (1932) noted the prevalence of widely held corporations in the US and set the image of the modern corporation as one operated by managers responsible to the shareholders. Their notion of diffuse ownership has also had profound influence on modern financial thinking as can be seen in the seminal contributions of Jensen and Meckling (1976) and Grossman and Hart (1980). Much of the focus of extant studies is on conflict between diffuse shareholders and professional managers. In the mid-1980s, however, researchers began to realise that some U.S. public corporations had majority or large shareholders, many of whom were the managers or directors (e.g., Demsetz and Lehn, 1985; Holderness and Sheehan, 1988). Indeed, recent international evidence shows that the Berle and Means paradigm does not capture the reality of many corporations around the world. For example, La Porta et al. (1999) showed that concentrated and dispersed ownership varies greatly across countries. For example, while dispersed ownership is prevalent in the U.S. and the U.K., large shareholder controls are dominant in the countries of continental Europe.The presence of large shareholders with greater controlling interest may solve the free rider problem encountered by dispersed shareholders. Since large shareholders hold significant percentage of firm equity, they have an incentive to collect information and monitor management (Shleifer and Vishny, 1986) and also have enough voting power to force management to act in the interest of shareholders (La Porta et al., 1999).
Therefore, the classic owner-manager conflict described by Berle and Means (1932) or Jensen and Meckling (1976) should be lower in closely held firms. Financial researchers, however, perceive a second type of agency problem. Specifically, Fama and Jensen (1983) observed that combining ownership and control allows concentrated shareholders to exchange profits for private rents. Shleifer and Vishny (1997) argued that when large shareholders gain nearly full control of a corporation, they may extract private benefits at the expense of the minority shareholders. Therefore, ownership concentration could have a positive or negative impact on firm value. Prior studies that examine this issue have been inconclusive. A positive impact is reported by, for instance, Shleifer and Vishny (1986), Mikkelson and Ruback (1985), Holthausen et al. (1990), Barclay and Holderness (1991) and Minguez-Vera (2007), while a negative impact is reported by Dann and DeAngelo (1983), Pound (1988), Brickley et al. (1988), Burkart (1995), Barclay and Holderness (1989), Zwiebel (1995).
but not with non-controlling shareholder structures. Such schemes enable controlling shareholders to maintain a lock on control without having to bear the cost of owning a large fraction of the cash flow rights. In contrast, in non-controlling shareholder structures, where the owner is giving up a lock on control, creating such separation will not produce value to the owner.
Hypothesis. To sum up, the relationship between ownership concentration and firm value can be positive or negative. On the one hand, agency relationship argument predicts that ownership concentration may enhance firm value. On the other hand, rent extraction argument suggests that ownership concentration may destroy firm value. Since neither of these two alternative relationships can be ruled out, a two-tailed hypothesis is presented which tests relationship between ownership concentration and firm value in Australia. Therefore, the corresponding testable hypothesis is:
Hypothesis 1: Ownership concentration is significantly associated with firm value.
Data and Methodology
The research design includes annual panel data over an eleven-year period from January 1994 to December 2004. The sampling frame consists of a population of all non-financial companies listed on the Australian Stock Exchange (ASX) in 1994 (i.e., 1,144 firms). I exclude observations with incomplete ownership or accounting data. The final sample consists of 829 companies or 6,665 firm-year observations.
The accounting data is from Datastream and FinAnalysis databases, respectively. The ownership data was collected manually from company annual reports on the DatAnalysis and Connect-4 databases. All data collected from FinAnalysis were validated by conducting cross checks with CompanyAnalysis, another annual reports database. If any discrepancies were found, the company’s actual report (downloaded from DataAnalysis) was used to determine the correct figure.
Description and
Construction of ownership data
This study employs several measures of ownership concentration. We categorize firms into closely-held and widely-held based on whether a single shareholder controls at least 20% of equity. 20% of the voting rights is considered to be sufficient for effective control and is used in prior ownership studies (La Porta et al., 1999; Faccio et al., 2001). 20% is also the control threshold adopted in Australia’s takeover regulations.A closely-held firm is defined as a firm that has at least one shareholder controlling 20% or larger equity, whereas a widely-held firm is defined as a firm with no shareholder controlling at least 20% of equity. Dummy variable CLOSELY-HELD (equals 1 for closely-held firm and 0 for widely-closely-held firm) is used in the regression analysis to capture the impact of closely-held versus widely-held firms on dividend policy. The CLOSELY-HELD data is collected from “substantial shareholding” disclosures in annual reports. Under the Australian Corporations Act 2001, and the accompanying moral hazard. This
notion is based on two assumptions. First, owner management is an efficient substitute for the costly control mechanisms that non-owner managed firms use to control the agency costs of managerial discretion. Second, the separation of ownership and control is the source of agency costs (Alchian and Woodward, 1988).
The possibility that outside shareholders serve to monitor and limit management’s self-serving behaviours, hence reducing agency costs, is also suggested by Jensen and Meckling (1976). The effectiveness of these actions, however, depends upon the power and incentive of outside shareholders. In corporations with a dispersed ownership structure, shareholder control over managers is weak due to poor shareholder monitoring caused by the free-rider problem. Diffuse shareholders are not keen on monitoring because they bear all the monitoring costs but only share a small proportion of the benefits (Grossman and Hart, 1980). Even if outside shareholders can obtain sufficient information, the spread of ownership makes it difficult for them to take serious collective action. Outside shareholders would only engage in managerial monitoring efforts if they perceive that the monitoring benefits are higher than the costs (Shleifer and Vishny, 1986). The primary agency problem in this type of firm is conflict between shareholders and managers.
Therefore, ownership concentration may have a positive impact on firm value because the presence of large shareholders with
greater controlling interest may solve the free-rider problem encountered by dispersed shareholders. When larger shareholders are families, they are almost always directly involved in the firm’s management (e.g., Holderness and Sheehan, 1988). The classic owner-manager conflict should be lower in closely-held firms than in widely-held firms. Shleifer and Vishny (1986) are among a number of theoretical models that predict the positive impact of large shareholdings. These models are supported by early empirical studies that examine the impact of secondary market transactions involving large blocks of shares.
The literature, however, suggests that combining ownership and control allows large or concentrated shareholders to exchange profits for private rents (e.g., Fama and Jensen, 1983; Shleifer and Vishny, 1997). Indeed, in countries in which controlling shareholders are prevalent, such controllers often maintain control while retaining substantially less than a majority of the cash flow rights (i.e., deviation from the one-share-one-vote principle). This can be done through the use of a controlling-minority structure such as pyramid structures, cross-holdings and dual-class stocks (La Porta et al. 1999).
The subscripts i and t represent firm and year, respectively. The natural logarithm of Tobin’s Q is used to measure firm value. The actual definition of Tobin’s Q is market value of the firm divided by the replacement cost of assets. However, as these replacement costs (the denominator) are not available in Australia, Tobin’s Q is defined as the market value of equity plus the book value of all liabilities and preference shares scaled by total assets. This proxy is highly correlated with the actual definition of Tobin’s Q and has been widely used in U.S. studies (e.g.,
Loderer and Martin, 1997; Demsetz and Villalonga, 2001). In Australia, Craswell et al. (1997) also use the market-to-book (equity) ratio as a proxy for Tobin’s Q.
Ownership structure is our key variable and is addressed by two measures explained in Section 3.1. (i.e., CLOSELY-HELD and TOTAL-BLOCK). The model also includes some standard control variables expected to affect firm value such as firm size, leverage, business risk, industry dummies and year dummies. Firm size is measured by a natural
Variable
Closely-Held
Total-Block
Tobin’s Q Firm size Leverage
Business risk
Definition
Dummy variable; one if a firm has at least one shareholder controlling 20% or larger equity, zero otherwise
The aggregate ownership of shareholders holding at least 5% equity
Market to book value ratio Ln (total assets)
Book value total debt / total assets
Standard deviation of EBIT in the previous 5 years
Mean
0.4650*
0.4064
1.6290 17.3737 0.1791
9.0
Std.Dev.
-0.2439
2.6182 2.1851 0.3073
30.1
Min.
0
0
0.06 10.09 0
1.60
Max.
1
1
71.88 25.17 9.66
80
*This indicates proportion of firms, rather than the mean proportion for associated variables
Table 1 Descriptive statistics
the company must list all of its substantial shareholders (i.e. investors who own five percent or larger of equity). This includes both those held directly and through other relevant interests, (where they have the power to dispose or vote shares held by the corporation in which the individual controls at least 20%) (Burnett, 2001). For example, Oakton Limited’s annual report shows Paul Holyoake with a 38.86% shareholding. Thus, Oakton Ltd is categorized as a closely-held company. In contrast, the then, Coles Myer Ltd’s annual report lists two substantial shareholders: Myer Family Investment Pty Ltd and Maple Brown Abbot Ltd with 5.03% and 5% shares, respectively. Coles Myer Ltd is therefore classified as a widely-held firm.
Other ownership concentration measure includes the aggregate ownership of shareholders holding at least five percent of equity (hereafter, BLOCK). TOTAL-BLOCK and LARGEST-TOTAL-BLOCK data is collected from the “substantial shareholding” in annual reports and TOP20 is from its largest twenty shareholders list.
Ownership is traced back through layers where necessary (see La Porta et al., 1999). For example, if the controlling block holder of Firm A is a publicly listed firm (i.e. Firm B), the ownership structure of Firm B will be analyzed before A is classified. If Firm B has a family, or individual, controlling 20% or larger of equity, Firm A will also be classified as family-controlled. If Firm B is widely-held, however, then Firm A is considered non-family-controlled. For example, New Hampton Goldfields Ltd shows Normandy
Mining Ltd as the largest shareholder with 34.17%. Normandy Mining Ltd itself is listed but has no substantial shareholder holding 20%. As a result, New Hampton Goldfields Ltd is considered a non family-controlled firm.
Model and Measurement
of variables
Panel study methodology is utilised as it provides more robust information, more variability, less collinearity among variables, more degrees of freedom and more efficiency (Baltagi, 1995). It also helps to control for unobserved firm heterogeneity. Specifically, I use pooled and random effects regressions. In a pooled tobit regression, non-spherical disturbances (i.e., serial correlation and heteroskedasticity) are controlled using the Huber-White/Sandwich estimator (clustered) for variance (Anderson and Reeb, 2003). The random effects panel data regression treats firm specific unobserved characteristics as a random variable and, therefore, they were a part of the error term. The regression used to test the impact of ownership concentration on firm value takes the following form:
Tobin’s Q
it=
β
0+
β
iOwnership structure
it+ δ
1Firm Size
it+ δ
2Leverage
it+ δ
3Business Risk
it+ + δ
4-22(Industry
it) + δ
23-32(Year)
Columns 1 and 2 of Table 3 show the pooled regression estimation for the relationship between ownership concentration and Tobin’s Q. I use the Huber-White Sandwich estimator (cluster) for variance to calculate pooled regression standard errors. This estimator provides robust standard errors in the presence of violations of regression model assumptions such as heteroskedasticity and serial correlation (Wooldridge, 2002). The technique is appropriate when panel data have a
large number of subjects (i.e., firms), but a relatively small number of observations per subject.
In column 1 of Table 3, the coefficient on Closely-Held is negative and significant at the conventional level (coefficient = -0.224, p < 0.01). This suggests that closely-held firms, on average, have a lower Tobin’s Q than widely-held firms. In column 2 of Table 3, the coefficient on Total-Block is also negative and significant at the conventional level
Closely-held Total-Block Firm Size Leverage Business Risk Constant Industry dummy Year dummy Adjusted R2
Wald Chi-Square
Variable Pooled Regression Random Effects Regression
(Huber-White)
(1)
-0.224*** (-3.02)
--0.392*** (-7.14) 0.800***
(4.44) 0.000***
(3.87) 8.392***
(8.36) Included Included 0.1212
-(2)
--0.407**
(-1.97) -0.388***
(-7.03) 0.797***
(4.45) 0.000***
(3.71) 8.381***
(8.40) Included Included 0.1202
-(3)
-0.168** (-2.24)
--0.511***
(-21.21) 0.831*** (7.85) 0.000***
(5.57) 10.601***
(20.70) Included Included
-(4)
--0.273*
(-1.67) -0.509***
(-21.04) 0.826***
(7.80) 0.000***
(5.52) 10.619***
(20.64) Included Included
-679.22
The table reports results of regressions of ownership concentration on firm performance measured by Tobin’s Q (i.e., market value of assets divided by the book value of assets). Closely-held is a dummy variable equal to one if a firm has at least one shareholder controlling 20% or larger equity, zero otherwise. Total-Block is the aggregate ownership of shareholders holding at least 5% equity. Firm size is a natural logarithm of total assets. Leverage is book value of total debt divided by total assets. Business risk is the standard deviation of earnings before interest and tax in the previous 5 years. Industry dummy variables are based on two digit GICS codes.
t-values are shown in parentheses, *** , **, and * denote significance at the 1, 5 and 10 percent level respectively in two-tailed tests.
Table 3 The impact of ownership concentration on Tobin’s Q
logarithm of total assets. Leverage is defined as the book value of total debt divided by total assets. Business risk is measured by the standard deviation of earnings before interest and taxes in the previous 5 years. In addition, a two-way fixed effects model is used to assess variation in the dependent variable due to industry differences (Industry dummy vectors are based on two digit GICS codes ), while year dummies remove any secular effects among the independent variables.
Statistics Descriptive
and Univariate Analysis
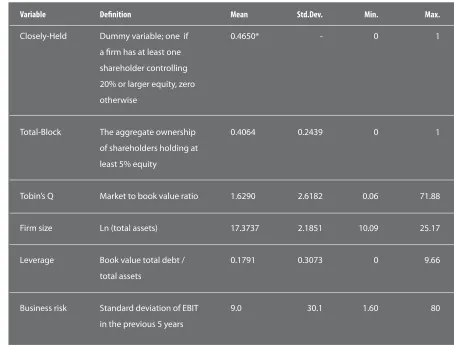
Table 1 presents descriptive information for the entire sample. It shows the means, standard deviation, and maximum and minimum values.
Closely-held firms represent 46.50% of sample firms. The mean for substantial shareholdings (i.e., shareholders with at least five percent equity stake) of 40.64% of firm-year observations, indicates that Australian firms have relatively concentrated
ownership. The mean for Tobin’s Q is 65.54%.
Table 2 presents the univariate tests for closely-held and widely-held firms.
Closely-held firms differ significantly from widely-held firms in several respects. Interestingly, the average Tobin’s Q of closely-held firms is statistically significantly lower than for widely-held ones. This suggests that closely-held firms underperform widely-held firms and is consistent with the rent extraction argument. Closely-held firms also are larger and utilize higher debt level.
Multivariate Analysis
The univariate testing indicates that closely-held firms significantly underperform widely-held firms. It is possible, however, the result may be attributed to other factors such as firm size, leverage, business risk, industry and year. Table 3 presents regression estimates of these determinants based on Equation 1 using Tobin’s Q as dependent variable.
Table 2 Univariate test: Closely-held and widely-held firms
Variable Closely-held firms Widely-held firms t-stat
Alchian, A.A and S. Woodward. 1988. “Review of Williamson’s economic institutions of
capitalism.” Journal of Economic Literature,
26, pp. 65-79.
Anderson, R.C. and D.M. Reeb. 2003. «Founding family ownership and firm performance:
Evidence from the S&P 500.» Journal of
Finance, 58, pp. 1301-1328.
Barclay, M.J. and Holderness, C.G. 1991, “Negotiated Block Trades and Corporate
Control”, Journal of Finance, Vol. 46, pp.
861-878.
Berle, A. A. and G.C. Means. 1932. The Modern
Corporation and Private Property. New York: Macmillan.
Baltagi, B.H. 1995. Econometric Analysis of Panel
Data. Chichester: John Wiley and Sons.
Barclay, M.J. and Holderness, C.G. 1989, “Private Benefits from Control of Public
Corporations”, Journal of Financial
Economics, 25, pp. 371-395.
Bebchuk, L. 1999. «A rent protection theory of corporate ownership and control.» Working Paper, Harvard University.
Brickley, J., Lease, R. and Smith, C. 1988, “Ownership Structure and Voting on
Antitakeover Amendments”, Journal of
Financial Economics, 20, pp. 267-291.
Burkart, M. 1995. “Initial Shareholdings and Overbidding in Takeover Contests”, Journal of Finance, 50, pp. 1491-1416.
Burnett, B. 2001. Australian Corporations Law.
North Ryde: CCH Australia.
Claessens, S., S. Djankov, J.P.H. Fan, and L. Lang. 2002. ‘‘Disentangling the incentive and entrenchment effects of large
shareholdings.’’ Journal of Finance, 57, pp.
2741-2771.
Craswell, A.T., S.L. Taylor, and R.A. Saywell. 1997. ‘‘Ownership structure and corporate
performance: Australian evidence.’’
Pacific-Basin Finance Journal, 5, pp. 301-323.
Dann, L.Y. and DeAngelo, H. 1983. “Standstill
Agreements, Privately Negotiated
Stock Repurchases, and the Market for
Corporate Control”, Journal of Financial
Economics, 11, pp. 275-301.
Demsetz, H. and B. Villalonga. 2001. ‘‘Ownership structure and corporate performance.’’ Journal of Corporate Finance, 7, pp. 209-233.
Dyck, A. and L. Zingales. 2004. ‘‘Private benefits of control: An international comparison.’’ Journal of Finance, 59, pp. 537-600.
Jensen, M. and W. Meckling. 1976. ‘‘Theory of the firm: Managerial behaviour, agency
costs, and ownership structure.’’ Journal of
Financial Economics, 3, pp. 305-60.
Faccio, M., L. Lang, and L. Young. 2001. ‘‘Dividends
and expropriation.’’ American Economic
Review, 91, pp. 54-78.
Fama, E. and M. Jensen. 1983. ‘‘Separation of
ownership and control.’’ Journal of Law
and Economics, 26, pp. 301-325.
Grossman, S. and O. Hart. 1980. ‘‘Takeover bids, the free-rider problem and the theory
of corporation.’’ Bell Journal of Economics
and Management Science, 11, pp. 42-64.
Holderness, C.G. and D.P. Sheehan. 1988. ‘‘The role of majority shareholders in publicly held corporations: An exploratory
analysis.’’ Journal of Financial Economics,
20, pp. 317-346.
Holthausen, R.W., Leftwich, R.W. and Mayers, D. 1990. “Large-Block Transactions, the Speed of Response, and Temporary and
References
(coefficient = -0.407, p < 0.05). This suggeststhat increase in substantial shareholdings leads to decrease in Tobin’s Q. The results do not support the argument that ownership concentration enhances firm’s governance. Instead, the results are consistent with the notion that large or controlling shareholder may collude with management to extract private benefits of control in expense of non-controlling shareholders.
Columns 3 and 4 of Table 3 show the random effects regression estimation for the relationship between ownership concentration and Tobin’s Q. In column 3 of Table 3, the coefficient on Closely-Held remains negative and significant at the conventional level (coefficient = -0.168, p < 0.01). While in column 4 of Table 3, the coefficient on Total-Block is negative but only significant at the 10 per cent level (coefficient = -0.168, p < 0.1). In general, random effects regressions results confirm the pooled regression results. Therefore, there is a supporting evidence for the hypothesis that ownership concentration is significantly associated with firm value. Specifically, I find a negative and significant relationship between ownership
concentration and firm value, which supports the rent extraction hypothesis.
Conclusion
This study has examined the effectiveness of the ownership concentration as an internal corporate control in the Australian capital market. Australia provides a unique research ground for this issue. Australia is a common law country with a relatively strong system of legal shareholder protection, but has a capital market characterized by high ownership concentration which exhibit unusually high private benefits of control.
the talent ProFit Chain
a Case Study of Bangladesh on talent Management and Productivity
as a new way of Calculating economic Profit
In many businesses today, economies of scale do not exist; rather there are economies of ideas and talents. Against this new reality, the present study proposes an interesting and inevitable phase of the economy of managing talents surpassing the economy of staging experience that is traversed ---from extracting commodities to making goods to delivering services. Manage talents facilitate innovations that induce added value and productivity in both demand and supply sides of the economy. It also introduces a new way of calculating economic profit incorporating a compact of talent management intertwined the elements of brand, purpose, opportunity and culture. In the end, the study reviews a case of agro-enterprise in Bangladesh that suggests that the firms which are talent-oriented they are more productive or more profitable in compare to other firms which are capital-oriented. Hence, the research concludes that manage talents are the latest phase of economy of 21st century’s
management which nurtures economies of talent rather than economies of scale in calculating and maximizing profit.
Keywords: Talent-profit chain, Manage talents, Economies of talent, Productivity
Mohammad Ashraf
University Utara Malaysia [email protected]
Abstract
Permanent Stock-Price Effects”, Journal of
Financial Economics, 26, pp. 71-95.
Lamba, A. and G. Stapledon. 2001. ‘‘The determinants of corporate ownership structure: Australian evidence.’’ Working Paper 20, Faculty of Law, University of Melbourne.
La Porta, R., F. Lopez-de-Silanes, and A. Shleifer. 1999. ‘‘Corporate ownership around the
world.’’ Journal of Finance, 54, pp. 471-517.
Loderer, C. and K. Martin. 1997. ‘‘Executive ownership and performance: Tracking
faint traces.’’ Journal of Financial
Economics, 45, pp. 223-255.
Mikkelson, W. and Ruback, R.S. 1985. “An Empirical Analysis of Interfirm Equity
Investment Process”, Journal of Financial
Economics,14, pp. 523-533.
Minguez-Vera, A. and J. F. Martin-Ugedo. 2007. ”Does Ownership Structure Affect Value? A Panel Data Analysis for the Spanish
Market.” International Review of Financial
Analysis, 16, pp. 81-98.
Nenova, T. 2003. ”The value of corporate voting rights and control: A cross-country
analysis.” Journal of Financial Economics,
68, pp. 325-351.
Pound, J. 1988. “Proxy Contests and the Efficiency
of Shareholder Oversight”, Journal of
Financial Economics, 20, pp. 229-255.
Shleifer, A. and R. Vishny. 1986. ”Large shareholders and corporate control.” Journal of Political Economy, 94, pp. 461-88.
Shleifer, A. and R. Vishny. 1997. ”A survey of
corporate governance.” Journal of Finance,
52, pp. 737-783.
Wooldridge, J.M. 2002. Econometric Analysis of
Cross Section and Panel Data. Cambridge, MA: MIT Press.
Zwiebel, J. 1995. “Block Investment and Partial
Benefits of Corporate Control”, Review of