Original Research Article
Association of overweight and obesity with dietary and physical activity
behaviour among school-aged children in North India:
a cross-sectional study
Quratul Ain Arifa
1, Dinesh Kumar
2, Nadeema Rafiq
3*, Tauseef Nabi
4INTRODUCTION
Obesity is generally defined as abnormal accumulation of fat in adipose tissue to the extent that health may be impaired. Childhood and adolescence have been proposed as critical period, as obesity beginning at this stage increases the risk of persistent obesity and its complications.1 Childhood obesity in developed countries has reached epidemic proportions and developing
countries are not far behind where it has affected all socioeconomic groups irrespective of age, gender and ethnicity. The proportion of school-going children affected almost doubled by 2010 compared to 1990s.2 WHO commission on ending childhood obesity reported an increasing number of overweight/obese infants and young children aged 0 to 5 years where vast majority of them are living in developing countries.3
ABSTRACT
Background: Childhood obesity has reached epidemic proportions in developed countries and developing countries
are not far behind. This has profound public health consequence as it increases risk of persistent obesity and its complications. Changes in social and physical environment over past years have adversely influenced eating and physical activity behaviour including attitudes and behaviour of parents. The objectives of the study were to assess and compare magnitude of overweight/obesity and its association with dietary and physical activity behaviour.
Methods: This cross sectional community based study was conducted in school going children of both sex aged 6-14 years in rural and urban areas of Jammu. Children were assessed for their dietary intake and dietary habits using new USDA multiple pass recall method. Physical activity was assessed using modified global physical activity questionnaire (version 2) and expressed in MET-min/day in different domains. Following anthropometric assessment BMI percentiles were obtained from WHO age and gender specific BMI charts.
Results: Of 230 children studied overall overweight/obesity observed was 8.2%. More females than males were overweight and obese. Overweight and obesity was more in urban than rural areas (males: 7.4% vs. 3%, females: 16.9% vs 6.6%). Excess calorie intake, consumption of fast foods, carbonated drinks, food from school canteen and low physical activity were significantly associated with overweight and obesity.
Conclusions: Unhealthy dietary practices and low physical activity significantly contribute to obesity in children and adolescents. Health and nutritional education to them and their parents along with facilities for participation in sports and physical education would help tackle the problem.
Keywords: Obesity, Dietary behaviour, Physical activity, Childhood, Adolescents
Department of Community Medicine, 1SKIMS, Srinagar, 2Govt. Medical College, Jammu, Jammu and Kashmir, India 3Department of Physiology, Govt. Medical College, Srinagar, Jammu and Kashmir, India
4Department of Endocrinology, SKIMS, Srinagar, Jammu and Kashmir, India
Received: 06 April 2018
Accepted: 09 May 2018
*Correspondence:
Dr. Nadeema Rafiq,
E-mail: [email protected]
Copyright: © the author(s), publisher and licensee Medip Academy. This is an open-access article distributed under the terms of the Creative Commons Attribution Non-Commercial License, which permits unrestricted non-commercial use, distribution, and reproduction in any medium, provided the original work is properly cited.
WHO global status report on non-communicable diseases(NCD) 2014 reports that leading causes of NCD deaths in 2012 were: cardiovascular diseases 46.2%, cancers 21.7%, respiratory diseases including asthma and COPD 10.7% and diabetes 4% and were responsible for 82% of NCD deaths.4 WHO has thus labelled childhood obesity with its array of comorbidities as one of the most serious public health challenges of 21st century.5 The problem is worst in south Asians, as they tend to have more body fat for the same body mass index and more adverse body fat patterning including abdominal adiposity.6 WHO-NCD country profiles 2014 estimated NCDs to account for 60% of all deaths in India across all age groups with considerable loss in potentially productive years of life.7
Apart from genetic causes changes in social and physical environment over the past 30 years have adversely influenced children‟s eating and physical activity behaviour. Parenting styles and family characteristics can influence child‟s dietary intake and activity levels.8 Increased consumption of junk food rich in calories with simple carbohydrates instead of complex carbohydrates and higher concentration of salt, sugar and fat has contributed significantly. Due to pressure for academic performance, less time is devoted to physical education in schools. The advent of TV, computers and video games has resulted in more opportunities of sedentary activities. Habits of “sit time and snacks” and product advertisements on TV influence children to make unhealthy food choices.
The present studies offers opportunities to find the magnitude and associated risk factors for obesity in school children of both rural and urban areas of Jammu and consequently help formulation of recommendations for promoting health and preventing risk factors.
METHODS
A cross-sectional study was conducted for a period of one year from November 2014 to November 2015 to find the extent and association of risk factors with obesity in school going children of both sex aged 6-14 years in rural and urban areas of Jammu. One zone out of eight administrative zones from block RS Pura (Zone Miran Sahib) a rural field practice area of Department of Community Medicine GMC Jammu and one out of Jammu city (Zone Jammu) representing urban unit of study was selected using simple random sampling procedure.
After seeking permission from ethical committee GMC Jammu, a list of all high schools of selected zones of block RS Pura and Jammu city was procured from the office of CEO Jammu. Six high schools each from rural as well as urban areas were selected randomly using simple random sampling procedure.
Heads of selected Institutions were contacted prior to the conduct of study and their support solicited. A day convenient to the school authorities was selected. On initial couple of visits, the investigator prepared class wise list of all students aged 6-14 years. Five students were requested for an interview on a day. After explaining the purpose of study, students were interviewed by the investigator using standardized instruments/tools. Each interview lasted 30-40 minutes. Parents were contacted telephonically, wherever needed for their consent and necessary information.
Information regarding dietary habits and dietary intake was collected using new USDA Multiple-Pass recall method which included five steps:9
1. In first step while developing rapport, children were encouraged to tell about foods they remembered eating the day before in any order they wish.
2. Second step involved probing their mind for forgotten foods.
3. Answers already given were readdressed in the context of eating occasion such as breakfast, lunch, dinner etc. as well as time of day in third step. 4. Fourth step included some leading questions. 5. Fifth step provided one last opportunity to remember
foods that were consumed.
Deficient, adequate and excess calorie intake/day was defined as recommended by ICMR RDA for Indians 2010.10 Students were then assessed for their physical activity using modified Global Physical Activity Questionnaire (Version 2) developed by WHO.11 Information was obtained in three settings, as well as sedentary behaviour which included:
1) Activity at school (vigorous and moderate) 2) Travel to and from school
3) Recreational activities (vigorous and moderate)
The physical activity questionnaire items collected recent physical activity history by recall over past seven days. Weekly minutes of physical activity of varying intensity were calculated separately by multiplying number of days/week by the duration of activity on an average day. Reported minutes per week in each category were weighted by a metabolic equivalent (MET) as per modified global physical activity questionnaire (Version 2) resulting in a physical activity estimate expressed in MET-minutes/week (computed by multiplying METs by min/week) and/or MET-min/day.11 Total MET-min per week was estimated by adding the MET-min per week of each category.
if the student had at least seven days of any combination of activities between 1680-3359 MET-minutes/week and low if the student did not met the conditions for high and moderate physical activity.
Lastly students were subjected to anthropometric measurements. Weight and height were measured using standard methodology as per WHO guidelines.13 BMI was calculated using formula;
BMI=Weight (kg)/Height (m)2, and BMI percentile obtained from WHO age and gender specific BMI charts.14
Overweight: BMI ≥85th and <95th percentile for children of same age and sex.
Obese: BMI ≥95th percentile for children of same age
and sex.
Statistical analysis
Data was analysed using CDC Epi Info (version: 7.2.2.6). Prevalence of overweight and obesity was calculated using BMI, where BMI percentiles were obtained from WHO age and gender specific BMI charts.14 Association of overweight and obesity with each variable of dietary and physical activity behaviour was done using chi-square tests and strength of their association was computed by using odds ratio (95% confidence interval). For all statistical tests p<0.05 was taken as significant level.
RESULTS
Equal proportion of children from government and private schools from both urban and rural areas were
surveyed where maximum number of children studied were in the age group of 12-14 yrs. Higher proportion of sample comprised of children from rural areas (46.3% versus 39.2% urban). The overall mean age of children studied was 10.6±2.4 yrs.
Dietary assessment of children showed either deficient or excess intake of calories. Discrepancy in calorie deficiency was more pronounced among males aged 6-8 years in urban and rural schools (38.4% vs. 91.6% respectively). Two-third females irrespective of urban/rural background were consuming calorie deficient diet. The situation was reverse in 9-11 year age groups where the differences were more pronounced among girls (35% urban vs. 68.4% rural). More urban males were consuming calorie deficient diet in this age group as compared to 6-8 year old children. Children in age group 12-14 demonstrated similar pattern as for 6-8 year age group but the differences were narrow and at higher proportions of calorie deficiency. Highest proportion of calorie excess was observed among urban males aged 6-8 years (61.5%) and urban females aged 9-11 years (65%).
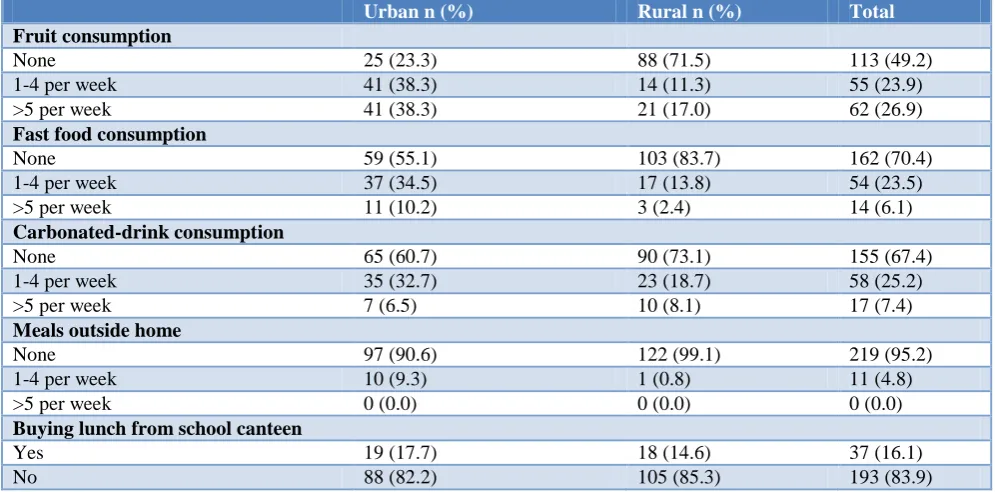
Table 1 depicts that fruit consumption is less in rural as compared to urban areas where more than one third of children consume fruits >5 times per week. However, majority (about 80%) from both areas were consuming vegetables during past 7 days. Those who consumed fast foods and carbonated drinks during past 7 days, higher proportion of them belonged to urban areas. About 10% children consumed meals outside home at fast food outlets; roadside vendors etc. or bought lunch from school canteen and more of them were from urban areas. Nearly one in seven children from both areas were buying lunch from school canteen. Skipping of breakfast was observed more among children of urban areas.
Table 1: Reported consumption of fruits, fast food, carbonated drinks, meals outside home and from school canteen during past 7 days.
Urban n (%) Rural n (%) Total
Fruit consumption
None 25 (23.3) 88 (71.5) 113 (49.2)
1-4 per week 41 (38.3) 14 (11.3) 55 (23.9)
>5 per week 41 (38.3) 21 (17.0) 62 (26.9)
Fast food consumption
None 59 (55.1) 103 (83.7) 162 (70.4)
1-4 per week 37 (34.5) 17 (13.8) 54 (23.5)
>5 per week 11 (10.2) 3 (2.4) 14 (6.1)
Carbonated-drink consumption
None 65 (60.7) 90 (73.1) 155 (67.4)
1-4 per week 35 (32.7) 23 (18.7) 58 (25.2)
>5 per week 7 (6.5) 10 (8.1) 17 (7.4)
Meals outside home
None 97 (90.6) 122 (99.1) 219 (95.2)
1-4 per week 10 (9.3) 1 (0.8) 11 (4.8)
>5 per week 0 (0.0) 0 (0.0) 0 (0.0)
Buying lunch from school canteen
Yes 19 (17.7) 18 (14.6) 37 (16.1)
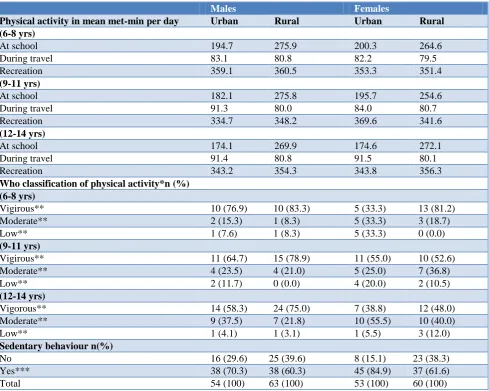
Table 2: Reported physical activity expressed in mean met-minutes per day in different domains and its classification as vigirous, moderate and low as per who recommendations along with sedentary behaviour on an
average day.
Males Females
Physical activity in mean met-min per day Urban Rural Urban Rural
(6-8 yrs)
At school 194.7 275.9 200.3 264.6
During travel 83.1 80.8 82.2 79.5
Recreation 359.1 360.5 353.3 351.4
(9-11 yrs)
At school 182.1 275.8 195.7 254.6
During travel 91.3 80.0 84.0 80.7
Recreation 334.7 348.2 369.6 341.6
(12-14 yrs)
At school 174.1 269.9 174.6 272.1
During travel 91.4 80.8 91.5 80.1
Recreation 343.2 354.3 343.8 356.3
Who classification of physical activity*n (%) (6-8 yrs)
Vigirous** 10 (76.9) 10 (83.3) 5 (33.3) 13 (81.2)
Moderate** 2 (15.3) 1 (8.3) 5 (33.3) 3 (18.7)
Low** 1 (7.6) 1 (8.3) 5 (33.3) 0 (0.0)
(9-11 yrs)
Vigirous** 11 (64.7) 15 (78.9) 11 (55.0) 10 (52.6)
Moderate** 4 (23.5) 4 (21.0) 5 (25.0) 7 (36.8)
Low** 2 (11.7) 0 (0.0) 4 (20.0) 2 (10.5)
(12-14 yrs)
Vigorous** 14 (58.3) 24 (75.0) 7 (38.8) 12 (48.0)
Moderate** 9 (37.5) 7 (21.8) 10 (55.5) 10 (40.0)
Low** 1 (4.1) 1 (3.1) 1 (5.5) 3 (12.0)
Sedentary behaviour n(%)
No 16 (29.6) 25 (39.6) 8 (15.1) 23 (38.3)
Yes*** 38 (70.3) 38 (60.3) 45 (84.9) 37 (61.6)
Total 54 (100) 63 (100) 53 (100) 60 (100)
*WHO Recommendations of Physical Activity for age group 5-17 years; **Physical activity defined as Vigorous: If the student had at least seven days of any combination of activities accumulating at least 3360 MET-minutes/week; **Moderate if the student had at least seven days of any combination of activities between 1680-3359 MET-minutes/week;**Low if the student did not met the conditions for high and moderate physical activity; ***More than 5 hours per day.
It was observed that an average child regardless of age was engaged in physical activity for an average of 656.6 MET-min/day. The mean time spent in physical activity at school was 223 MET-min/day and was higher for rural children. No discernible sex wise differences were observed. The mean time spent in travel to and from school and in recreational activities was almost similar for both residence and gender wise.
As per WHO classification of physical activity, nearly two third children (62.1%) reported vigorous physical activity. Low physical activity was reported by 9.6% of all. More females were engaged in sedentary activities as compared to males with about half of them watching television for >2 hours per day.
Of 230 children surveyed and assessed for their nutritional status using BMI percentiles, overall
overweight/obesity observed was 8.2%. A higher proportion of urban males (7.4%) were overweight and obese as compared to rural males (3%). Similarly more urban females (16.9%) were overweight and obese than rural females (6.6%). Under nutrition was also observed, where about half of males of rural areas and 20.3% of urban areas were under nourished (<5th percentile) as compared to females (11.3% urban and 8.3% rural).
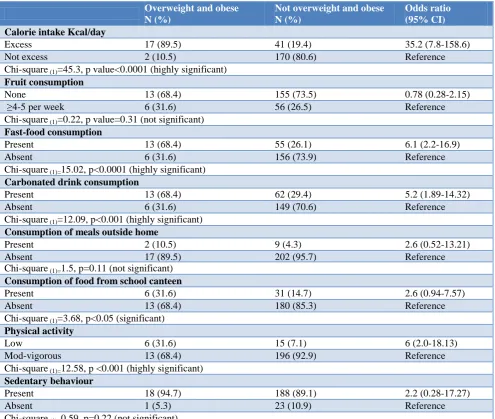
and obese children more than two third were consuming fast food and carbonated drinks and were nearly 6 times at higher risk [OR=6.1, 95% CI (2.2-16.9)] and [OR=5.2, 95% CI (1.89-14.32)]. The association with consumption
of fast foods was highly significant (Chi-Square(1)=15.02, p<0.0001). Association of similar significance was observed with consumption of carbonated drinks (Chi-square(1)=12.09, p<0.001).
Table 3: Relationship of overweight and obesity with calorie intake per day, consumption of fruits, fast foods/carbonated drinks, meals outside home/school canteen, physical activity/sedentry bahaviour.
Overweight and obese N (%)
Not overweight and obese N (%)
Odds ratio (95% CI)
Calorie intake Kcal/day
Excess 17 (89.5) 41 (19.4) 35.2 (7.8-158.6)
Not excess 2 (10.5) 170 (80.6) Reference
Chi-square (1)=45.3, p value<0.0001 (highly significant)
Fruit consumption
None 13 (68.4) 155 (73.5) 0.78 (0.28-2.15)
≥4-5 per week 6 (31.6) 56 (26.5) Reference
Chi-square (1)=0.22, p value=0.31 (not significant)
Fast-food consumption
Present 13 (68.4) 55 (26.1) 6.1 (2.2-16.9)
Absent 6 (31.6) 156 (73.9) Reference
Chi-square (1)=15.02, p<0.0001 (highly significant)
Carbonated drink consumption
Present 13 (68.4) 62 (29.4) 5.2 (1.89-14.32)
Absent 6 (31.6) 149 (70.6) Reference
Chi-square (1)=12.09, p<0.001 (highly significant)
Consumption of meals outside home
Present 2 (10.5) 9 (4.3) 2.6 (0.52-13.21)
Absent 17 (89.5) 202 (95.7) Reference
Chi-square (1)=1.5, p=0.11 (not significant)
Consumption of food from school canteen
Present 6 (31.6) 31 (14.7) 2.6 (0.94-7.57)
Absent 13 (68.4) 180 (85.3) Reference
Chi-square (1)=3.68, p<0.05 (significant)
Physical activity
Low 6 (31.6) 15 (7.1) 6 (2.0-18.13)
Mod-vigorous 13 (68.4) 196 (92.9) Reference
Chi-square (1)=12.58, p <0.001 (highly significant)
Sedentary behaviour
Present 18 (94.7) 188 (89.1) 2.2 (0.28-17.27)
Absent 1 (5.3) 23 (10.9) Reference
Chi-square (1)=0.59, p=0.22 (not significant)
About 10% of overweight and obese children consumed meals outside home. Less strong association was observed with regards to consumption of meals outside home [OR=2.6, CI (0.52-13.21)]. The association was also statistically not significant (Chi-Square(1)=1.5, p=0.11). Almost similar results were observed with consumption of food from school canteen [OR=2.6, CI (0.94-7.57)]. About one third among overweight and obese children was consuming food from school canteen and its association was significant (Chi-Square(1)=3.68, p<0.05).
About one third of those among overweight and obese were engaged in low physical activity and were 6 times at
higher risk. The association came to be highly significant (Chi-Square(1)=12.58, p<0.001). More than 90% among overweight and obese children were having sedentary behaviour and were 2.2 times at higher risk. However, the association was not significant statistically (Chi-Square(1)=0.59, p=0.22).
DISCUSSION
period of time. Initiatives to tackle the problem are being vigorously pursued worldwide including India. Govt. of India launched Rashtriya Kishore Swasthaya Karyakram (RKSK) in January 2014 wherein nutrition, physical activity and other behavioural aspects are given due emphasis.15 It is well recognized now that the phenomenon of overweight and obesity has been extending beyond urban settings, which is ominous, keeping in mind that about 21% of the population of India comprise of adolescents.16
The present study revealed that both under and over nutrition was prevalent among children studied which is not surprising as India is currently experiencing nutritional transition.17 This „double burden‟ indicates that systemic and structural challenges exist within our current global food and health systems which will affect how we approach the prevention of malnutrition. In acknowledgement thereof, childhood obesity rates have been taken as a nutrition indicator to help track the growing trend of the double burden.18
A number of studies conducted in recent years across various regions of Indiarevealed higher prevalence of overweight and obesity among adolescents, particularly among females.19-21 It is a known fact that adolescent females are physiologically programmed to the deposition of extra adipose tissues due to effect of the hormones during puberty. This to some extent explains relative preponderance of overweight and obesity among females. The other reasons for this phenomenon relate to increasing levels of low physical activity and consumption of fast foods including carbonated drinks. Shrinking urban rural differences may be explained by ever increasing adoption of urban eating behaviour by rural adolescents.22
An appraisal of results from Central Board of Secondary Examination-Global School Health Surveydata reported higher prevalence in adolescents which is alarming, as the study was restricted to mid adolescence when the effect of pubertal spurt is not as overwhelming as in early adolescence.23 Since our study aggregates prevalence across a higher age range, it seems low as compared to CBSE-GSHS results. The situation in subcontinent depicts similar picture. This could be explained on the basis of similar cultural, dietary and social practices.2
A closer look at inappropriate dietary practices reveal increased snacking, intake of high calorie density foods, larger portion sizes, foods of poor nutritional quality as main culprits for emerging epidemic of childhood obesity in developing countries.2,19,20,24 We also observed that obese children in our study were less active and were making unhealthy food choices by consuming fast food and carbonated drinks more often, a finding which is shared by other investigators as well.20,24 Improved food product labelling with more nutritional information on product packaging (ex: traffic light and tea-spoon labelling for sugar, salt and fat content) would serve as a preventive strategy to address the serious public health
concern of childhood obesity and help parents making healthier choices for their children as reported by Moretto et al.25
Low physical activity has been reported as significant risk factor for obesity by many investigators.19,20 The present study observed females engaged to a lesser extent in moderate-vigorous physical activity as compared to males, a finding shared by Swaminathan et al.26 This might well explain higher prevalence of obesity among females.
Television viewing, use of computers/video-games, availability and affordability of varied public transport has led to decreased physical activity. Due to unsafe roads children are not encouraged to walk or use bicycle to reach school. Instead motorized vehicles are popular and considered to be safe and quick means of transport. Lack of open spaces for recreational activities and parental time to supervise their children add to increasing obesigenic lifestyles. Rosiek et al reviewed effect of television on obesity.27 Watching television takes away from the time children spent in physical activity. Product advertisements encourage children to make unhealthy food choices, as an overt food theme is always present on television. Eating while watching television is a common practice among families. On an average, references to food on TV are made ten times an hour. It is seen that an average child watches television for four hours a day and every additional hour per week increases the risk of developing obesity in school children by three percent.27
Physical education at school is an important determinant of physical activity as a child spends one third of a day at school. Most investigators including us have reported that school authorities at most places have ensured that the children must attain recommended levels of physical activity while being in schools by making explicit provisions in their curricular structure. National policy on education and NCERT position paper on health and physical education emphasize the integration of sports education in school curriculum.28,29 Similar sentiments have been expressed by experts from WHO which support policies and programmes for adoption of healthy diets and physical activity in school setting through changes in environment, behaviour and education.30
CONCLUSION
Unhealthy dietary practices and low physical activity observed more in urban children significantly contribute to overweight and obesity in them. Health and nutritional education to children and their parents along with facilities for participation in sports and physical education would help tackle the problem.
Strengths and limitation
tried to overcome the limitations by using standardized tools/instruments.
Funding: No funding sources Conflict of interest: None declared
Ethical approval: The study was approved by the Institutional Ethics Committee
REFERENCES
1. Dietz WH. Critical periods in childhood for the development of obesity. Am J Clin Nutr 1994;59(5):955-9.
2. Mushtaq MU, Gull S, Abdullah HM, Shahid U, Shad MA, Akram J. Prevalence and socioeconomic correlates of overweight and obesity among Pakistani primary school children. BMC Public Health. 2011;11:724.
3. WHO. Interim Report of the Commission on Ending Childhood Obesity 2015. Geneva: World Health Organisation.
4. WHO. Global Status Report on Noncommunicable diseases 2014. Geneva: World Health Organization. 5. World Health Organization. Available at: http://www.who.int/dietphysicalactivity/childhood/ en/. Accessed on 3 March 2018.
6. Parthasarathy A, Menon PSN. IAP Textbook of paediatrics 4th edition. Volume 2. Jaypee Publications; 2009.
7. WHO. Noncomminicable Diseases Country Profiles 2014. Geneva: World Health Organisation.
8. Datar A, Nicosia N, Shier V. Maternal Work and Children‟s Diet, Activity, and Obesity. Soc Sci Med. 2014;107(1):196-204.
9. Conway JM, Ingwersen LA, Vinyard BT, Moshfegh AJ. Effectiveness of the US Department of Agriculture 5-step multiple-pass method in assessing food intake in obese and non-obese women. Am J Clin Nutr. 2003;77:1171–8.
10. Park K. Nutrition and health. In: Park‟s textbook of preventive and social medicine. 24th ed. Jabalpur: Bhanot Publishers; 2017;674.
11. WHO. Global Physical Activity Questionnaire Analysis Guide. Available at: http://www.who.int/ chp/steps. Accessed on 12 December 2017.
12. WHO. Global Recommendations on Physical Activity for Health. Geneva: World Health Organisation, 2010.
13. de Onis M, Blossner M. The World Health Organization global database on child growth and malnutrition: methodology and applications. Int J Epidemiol. 2003;32:518–26.
14. de Onis M,Onyango AW, Borghi E, Siyam A, Nishidaa C, Siekmanna J. Development of a WHO growth reference for school aged children and adolescents. Bulletin World Health Organization. 2007;85(9):660-7.
15. RKSK. Rashtriya Kishor Swasthya Karyakram. National Health Mission.Ministry of Health and Family Welfare, Government of India, 2014.
16. Census 2011. The Registrar General and Census Commissioner. Ministry of Home Affairs, Government of India. Available at: www.censusindia.gov.in. Accessed on 3 March 2018.
17. Vaz M, Yusuf S, Bharathi AV, Kurpad AV, Swaminathan S. Nutrition transition in India. SAJCN. 2005;18(2):198-201.
18. A world free from hunger and malnutrition. Food and Nutritional Security in the Post-2015 UN Development Agenda. Global Alliance for Improved Nutrition, 2015.
19. Kotian MS, Kumar GS, Kotian SS. Prevalence and Determinants of Overweight and Obesity among Adolescent School Children of South Karnataka, India. Indian J Community Med. 2010;35(1):176-8. 20. Goyal JP, Kumar N, Parmar I, Shah VB, Patel B. Determinants of Overweight and Obesity in Affluent Adolescent in Surat City, South Gujarat Region, India. Indian J Community Med. 2011;36(4):296-300.
21. Arora M, Nazar GP, Gupta VK, Perry CL, Reddy KS, Stigler MH. Association of breakfast intake with obesity, dietary and physical activity behaviour among urban school-aged adolescents in Delhi, India: results of a cross-sectional study. BMC Public Health. 2012;12:881.
22. Hoffmann K, Bryl W, Marcinkowski JT, Rzesos A, Wojtyla E, Pupek-Musialik D. Dietary behaviours of adolescents from urban and rural areas in the district of Szamotuly - a preliminary study. Ann Agric Environ Med. 2012;19(1):103-7.
23. CBSE-GSHS. Global School-Based Student Health Survey. India (CBSE) 2007. Fact Sheet. Available at: http://www.2007_India_ CBSE_fact_sheet.pdf. Accessed on 3 April 2018.
24. Kelishadi R, Ardalan G, Gheiratmand R, Gouya MM, Razaghi EM, Delavari A, et al. Association of physical activity and dietary behaviours in relation to the body mass index in a national sample of Iranian children and adolescents: CASPIAN Study. Bulletin WHO. 2007;85(1):19-26.
25. Moretto N, Kendall E, Whitty J, Byrnes J, Hills AP, Gordon L, et al. Yes, the Government Should Tax Soft Drinks: Findings from a Citizens‟ Jury in Australia. Int J Environ Res Public Health. 2014;11:2456-71.
26. Swaminathan S, Selvam S, Thomas T, Kurpad AV, Vaz M. Longitudinal trends in physical activity patterns in selected urban south Indian school children. Indian J Med Res. 2011;134:174-80. 27. Rosiek A, Maciejewska NF, Leksowski K,
Rosiek-Kryszewska A, Leksowski L. Effect of Television on Obesity and Excess of Weight and Consequences of Health. Int J Environ Res Public Health. 2015;12:9408-26.
29. NCERT. Position paper 3.6. National Focus Group on health and physical education. New Delhi: National Council for Educational Research and Training; 2006.
30. WHO. School Policy Framework. Implementation of the WHO Global Strategy on Diet, Physical Activity and Health. Geneva: World Health Organisation; 2008.
Cite this article as: Arifa QA, Kumar D, Rafiq N, Nabi T.Association of overweight and obesity with dietary and physical activity behaviour among school-aged children in North India: a cross-sectional study. Int J Community Med Public Health