Measuring the quality of service: a case of Chancellor College Library,
University of Malawi
Naomi Kachoka
1and Ruth Hoskins
2Information Studies Programme, University of KwaZulu-Natal [email protected]; [email protected]
Received: 10 October 2009 Accepted: 6 December 2009
This paper discusses the perceptions and expectations of undergraduate students of the quality of service at Chancellor College Library, University of Malawi. A LibQUAL+™ instrument was used to assess the students’ perceptions and expectations of the quality of service. The minimum expectation of service that the students would accept was also examined. Using a self-administered questionnaire and an interview schedule it was found that Chancellor College Library did not perform well in all the LibQUAL dimensions of service quality namely: affect of service, library as place and information control. Undergraduate students of the Chancellor College had higher expectations of service quality than the perceived quality of service both for desired expectations and minimum expectations leading to negative adequacy and superiority gaps.
Keywords: Library service quality; library assessment; LibQUAL+™; Quality management in libraries; university libraries
1 Introduction and problem statement
Measuring organisations’ effectiveness is crucial in most organisations and academic libraries are no exception in this regard. Library performance has been measured in several ways including, size of the collection (Saunders 2006:187) and quality of services (Nitecki 1996:182; Hernon and Altman 1996:315) or the programmes offered by the library. In the past several models have been used to assess quality in libraries such as Total Quality Management (TQM) (Jurow and Barnard 1993:2), the Excellence model and the Balanced Scorecard (Broady - Preston and Preston 1999:127). Recently, libraries are turning their assessment focus outward to their users, to ensure that a multi dimensional assessment of quality is achieved since the traditional methods no longer fulfil the goals to successfully meet users’ demand for information (Sahu 2006:187).
Quality is a basic philosophy and requirement of the library profession and all libraries are striving to deliver the highest quality of service (Sahu 2006:187). Nitecki and Franklin (1999:484) define service quality in terms of reducing the gap between customers’ expectations of excellent service and their perceptions of the service delivered. Thus service quality is the difference between users’ expectations and perceptions of users’ on performance (Sahu 2006:188). Most libraries are now using the LibQUAL+™ instrument which was adapted from SERVQUAL to measure service quality (Crawford 2006:74).
Service quality in most university libraries in developing countries has been poor since the 1980s (Paulos 2008:252; Nawe 2004:382). In Malawi, Chiweza (2000:138) observed that it has been difficult for academic libraries to purchase books and print journals. The devaluation of the Malawian currency and the cash budget system which does not allow for flows of huge sums of money on a monthly basis which is a prerequisite for purchasing books and journals abroad, is responsible for the situation. Smart (2005:261) concurs with Chiweza that African universities and research institutions suffer from increasing financial problems. The library in the life of the African university was marginalised leading to alternative sources of acquiring information. In most cases “donor support” replaced the library budget which led to most African universities failing to meet the basic needs of their users (Paulos 2008:252). Therefore, the users’ perceptions of the quality of service at African university libraries are important. In addition, users of the Chancellor College Library did not have any proper mechanisms to provide feedback regarding the quality of service at the Library.
Thus, the purpose of the study was to establish the perceptions of service quality of undergraduate students at Chancellor College Library, University of Malawi. The research questions that guided the study were as follows:
• What were the undergraduate students’ desired expectations of the quality of service? • What were the undergraduate students’ perceptions of the quality of service?
• What was the differences in perceived quality of service between third and fourth year students? • What was the gap that existed between user’s expectations and perceptions of a service? • What was the minimum level of service that undergraduate students would accept?
To support the purpose of the study the following related studies were reviewed.
2 Literature review
The review focuses on the definitions of service quality, the LibQUAL+™ instrument and related studies. 2.1 Service quality
As mentioned earlier, service quality is described in terms of reducing the gap between customers’ expectations for excellent service and their perceptions of service delivered (Parasuraman, Berry and Zeithaml 1985 in Nitecki and Franklin 1999:484). The concept of service quality has been used interchangeably with customer satisfaction. Satisfaction has been regarded as transaction specific whilst service quality is cumulative evaluation of multiple transactions over time (Roszkowski et al., 2005). Hernon (2002:54) also argues that judgements about satisfaction tend to be global and rely on information gained from open ended questions whilst service quality probes specific dimensions and attributes that customers (users) consider important.
Quinn (1997:361) contends that measuring service quality in libraries is important as policy makers question the role of libraries and libraries have to justify their value in times of budgetary pressure. Sahu (2006:187) adds that competition for resources; rising expectations of users; increasing complexity of information provision from a variety of new providers and increasing cost of information carriers have contributed to libraries having to justify their value and role.
Service quality is based on the Gap theory which was first developed by Parasuraman, Berry and Zeithamal in 1985 (Cook et al., 2003:38). The theory describes the differences between customers’ expected service and perceived service delivered. Though service quality is based on the precept that only customers (users) can judge the quality of service (Nagata et al., 2004), Quinn (1997:360) and Saunders (2007:24) argue that librarians, who have professional training are in many ways in a better position to assess the needs of users as well as judge the quality of service. Further, information audit and focus groups can also be used to assess the quality of library services.
In a library context service quality has been assessed using the expectations and perceptions of service. According to Zeithaml and Bitner (2000:50) these expectations fall into two categories, namely, the desired and minimum expectation categories of service. The desired expectation is what the customer hopes to receive from a service. The minimum expectation of a service is the lower level of expectation for acceptable service that a customer will accept. The levels of expectation establish what is called the Zone of Tolerance, which is the extent to which users perceived scores should desirably float. On the other hand the perceived level of service is what the user views as actual experiences of services (Roszkowski et al., 2005:426).
2.2 LibQUAL+™
LibQUAL+™ is a total market survey intended to help librarians understand user perceptions and thus improve service quality and better meet users information needs (Thompson, Kyrillidou and Cook 2008:203). The instrument was devel-oped by the Association of Research Libraries (ARL) from the SERVQUAL instrument which is used to assess service quality in the marketing sector. Thus the LibQUAL+™ survey instrument is used in libraries to measure users’ percep-tions of service quality and identify the gaps between the desired, perceived and minimum expectapercep-tions of service (Moon 2007:72). The instrument has undergone several revisions since it was introduced in 1999 and it now covers the following dimensions of service quality (Crawford 2006:73):
• Affect of service refers to the human side of the enterprise. It encompasses traits of empathy, accessibility and personal competence (Cook et al., 2003:39);
• Library as a place is the physical space provided by the library for example, seating and reading space; and
• Information control is an assessment of the adequacy of the collections themselves and the ability to access needed information on a timely basis regardless of the location of the user or medium of communication (Cook et al., 2003:39; Crawford 2006:73).
The LibQUAL+™ instrument also assesses quality by measuring the gaps that exist between user expectation and perception of service. The superiority gap is a gap between desired and perceived ratings of service quality whilst the ad-equacy gap is a gap between the minimum acceptable level of a service and perceived level of a service (Roszkowski et al., 2005:426). Roszkowski et al., (2005:428) argues that rarely do people rate the actual experience higher than the desired level. Thus it is practically impossible to fully satisfy customers based on the gap model. Nevertheless people tend to re-port being satisfied despite their expectations not being fully met.
2.3 Related research
business hours, employees who have knowledge to answer users’ questions and a library website enabling one to locate information on one’s own. In most studies, users indicated higher expectations for the dimension of information control (Cook et al., 2003; Knapp and Persson 2006; Peterson et al., 2004). According to Cook et al., (2003), continually rising cost and rapidly changing technology has led to libraries not doing well in the service areas of access to information and personal control, now referred to as information control.
The results of the study done by Dole (2002) revealed uniformly low or negative adequate adequacy gaps among undergraduate students. In a similar study by Hiller (2004) a few negative gaps were observed among academic staff and none among undergraduate students. In a study done by Cook et al., (2003) the libraries were doing well in the area of library as place with a service adequacy gap of 0.64 and affect of service with a service adequacy gap of 0.60. Contrary to most studies done in United States of America, the South African study done by Moon (2007) revealed that the library did well in the service dimension of information control and less well in the dimension of affect of service. In studies by Simba (2006) and Naidu (2009) wide gaps between user perceptions and expectation of service were observed. Simba (2006) observed that the library performed poorly in the following service areas: electronic journals, photocopiers, interlibrary loan, electronic databases, a quiet library environment and a library webpage with useful information. Library as place, library facilities (printing, photocopying and internet access), inadequate and out-dated book collections and a quiet library environment were identified as problematic areas by Naidu (2009).
Opaleke’s (2002) study observed that most libraries which were under the study operated below the recommended 6% of the institutionary budget. The study also revealed that there was inadequate seating which may have led to adverse effects such as noise, theft, mutilation and other damages to collections. In addition, lack of basic services such as binding, photocopying and typing services led to overuse of reading material, mutilation and theft. Opaleke (2002) concludes that most libraries do not measure up to the expectations of their users.
3 Methodology
The study was done at Chancellor College Library, University of Malawi. The study population was a group of 1,143 students in their third and fourth year. Given the size of the population and the fact that the survey was not distributed online, it was decided to sample the population. Random stratified sampling was adopted which resulted in a sample population of 285 students. Of the 285 students sampled, 151 students were in their third year and 134 were in their fourth year. Of the 285 students who participated in the survey, 186 completed the questionnaire, yielding a response rate of 65.26%.
The data were collected using a self-administered printed questionnaire which adapted the LibQUAL+™ instrument. The questionnaire aimed at collecting information about the undergraduate students’ perceptions and expectations of quality of service and comments on library service problems. The questionnaire was modified to include questions on access to photocopying and printing facilities and access to the Online Public Access Catalogue (OPAC). The College Librarian was also interviewed using the interview schedule. The research questionnaire was pre-tested on 10 third year students at the University of Malawi, Polytechnic College before it was distributed to the main population.
The core questions of the questionnaire were on affect of service, library as a place and information control dimensions. The three levels of service quality: minimum service level, expected or desired and perceived service level were arranged in three columns and placed horizontally against the questionnaire. The format was adopted from the Parasuraman, Zeithaml and Berry - PZB’s three column format (Nagata 2004:56). The respondents were asked to evalu-ate each attribute from one (very low), two (low), three (somewhat low), four (middle), five (somewhat high), six (high) to seven (very high), corresponding to a seven-point likert scale. The questionnaire also asked questions on library usage patterns, general satisfaction with library services, user demographics and an open question which solicitated information on library service problems.
4 Results and discussion
This section presents the major findings which are discussed in terms of the research objectives of the study. 4.1 Demographics of the population
4.2 Library usage patterns
Library usage patterns included, frequency of library use, frequency of access to electronic resources and frequency of access to non library gateways such as Yahoo, Google and other non- library gateways
4.2.1Frequency of library use
This study has shown that the Chancellor College main library was vital to users who were the respondents in the study. A majority of respondents, 156 (83.9%), reported using the Library on a daily or a weekly basis. No major differences in usage were observed across year of study.
4.2.2 Frequency of access to electronic resources
A minority of respondents, 27 (14.5%), accessed electronic resources on a daily basis and 87 (46.8%), respondents accessed the electronic resources on a weekly basis. Slight differences were observed across the year of study.
4.2.3 Frequency of access to non-library gateways
Only 49 (26.3%), respondents accessed the library gateways on a daily basis and 85 (45.7%), accessed the non-library gateways on a weekly basis while 52 (28%), respondents either accessed the non-non-library gateways occasionally or not at all.
Low usage of electronic resources was observed despite the efforts by library management to increase the number of library computers and student training on computer literacy and searching the internet as indicated by the College Librarian during the interview. Low access to the computers could be attributed to a lack of computers as seen from users’ comments. Other attributes for low usage of computers could be: internet access was expensive, slow internet access, electronic resources being inadequate as reported in Table 2.
4.3 The expectations and perceptions of service quality of undergraduate students at the Chancellor College Library (CCL)
This includes a discussion of the students’ desired and minimum expectations of the quality of service and the gap that exists between their expectations and perceptions of service quality.
4.3.1 The desired and minimum expectations of quality of service
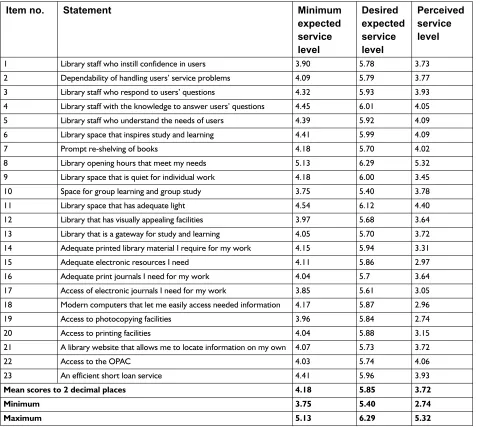
The overall desired expectation of a service was 5.85 (Table 1). Affect of service had the highest mean score of 5.89, followed by library as place with a mean score of 5.82 and information control a mean score of 5.82. The mean score for minimum expectations of service was 4.18. The results for minimum expectation of service followed a similar trend for desired expectations. The highest minimum expectation was observed for affect of service (4.23) followed by information control (4.18) and library as place (4.15). The results indicate that the minimum expectations of service were not that high.
The results in Table 1 show that respondents considered the following areas of service as important: library opening hours (6.29) as the highest expectation followed by library space that has adequate light (6.12), library staff that have knowledge to answer users’ questions (6.01), library space that is quiet for individual work (6.00), library space that inspires study and learning (5.99), an efficient loan service (5.96) and adequate printed material (5.94). These results were consistent with the study done by (Lessin 2004). In his study it was revealed that the aggregate scores of the five libraries involved in the benchmarking ranked the top most important items as: convenient library hours, employees who have knowledge to answer user questions and a library website that can easily allow one to access information on one’s own.
Comparisons of desired expectations of service across years of study revealed similar expectations. Both individual groups ranked the attribute library opening hours that meet my needs as most important. The other attributes which appeared in the top 10 for both individual groups included: library space that has adequate light, library staff who respond to users’ questions, library staff with knowledge to answer users’ questions and an efficient short loan service.
4.3.2 The undergraduate students’ perceptions of service
Chancellor College respondents’ perception of service was rated with a mean score of 3.72 (Table 1). The results reflected that CCL performed poorly in all services. The highest mean score of perceived service was for affect of service (3.91) followed by library as place (3.85). Information control came last with a perceived score of 3.57.
The perceived level of service for the respondents revealed that there were very minor differences in the way third year and fourth year students rated the attributes. Both user groups ranked library opening hours and adequate lights as attributes with high perception scores. Lowest perceived scores were observed in the following service areas by both groups: access to photocopying facilities, modern computers that let me easily access needed information, adequate electronic resources, adequate print library material and access to print facilities.
As mentioned earlier, mean scores for all items were calculated to derive minimum expected, desired and perceived levels of service that undergraduate students could accept. The overall minimum level of service that undergraduate students could accept was 4.18, the desired level of service was 5.85 and the perceived score was 3.72 (Table 1). The results reflect that users’ expectations of service were above the actual service perceptions. The lower perceived scores as compared to desired expectations of service are consistent with the scores of other studies such as Nimsomboon and Nagata (2003). This indicates that the users’ expectations were not met and the CCL performed poorly in all its services.
Table 1 Mean scores for each item (N=186)
1 Library staff who instill confidence in users 3.90 5.78 3.73
2 Dependability of handling users’ service problems 4.09 5.79 3.77
3 Library staff who respond to users’ questions 4.32 5.93 3.93
4 Library staff with the knowledge to answer users’ questions 4.45 6.01 4.05
5 Library staff who understand the needs of users 4.39 5.92 4.09
6 Library space that inspires study and learning 4.41 5.99 4.09
7 Prompt re-shelving of books 4.18 5.70 4.02
8 Library opening hours that meet my needs 5.13 6.29 5.32
9 Library space that is quiet for individual work 4.18 6.00 3.45
10 Space for group learning and group study 3.75 5.40 3.78
11 Library space that has adequate light 4.54 6.12 4.40
12 Library that has visually appealing facilities 3.97 5.68 3.64
13 Library that is a gateway for study and learning 4.05 5.70 3.72 14 Adequate printed library material I require for my work 4.15 5.94 3.31
15 Adequate electronic resources I need 4.11 5.86 2.97
16 Adequate print journals I need for my work 4.04 5.7 3.64
17 Access of electronic journals I need for my work 3.85 5.61 3.05 18 Modern computers that let me easily access needed information 4.17 5.87 2.96
19 Access to photocopying facilities 3.96 5.84 2.74
20 Access to printing facilities 4.04 5.88 3.15
21 A library website that allows me to locate information on my own 4.07 5.73 3.72
22 Access to the OPAC 4.03 5.74 4.06
23 An efficient short loan service 4.41 5.96 3.93
Mean scores to 2 decimal places 4.18 5.85 3.72
Minimum 3.75 5.40 2.74
Maximum 5.13 6.29 5.32
4.4 The gap that exists between users’ expectations and perceptions of service quality
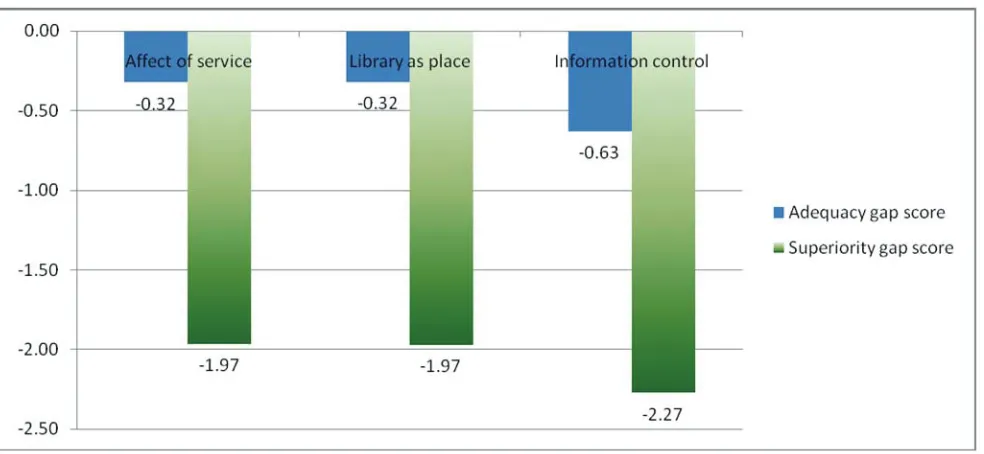
The findings revealed that all parameters of service quality had negative adequacy gaps as well as large negative superiority gaps which were below a difference of one as can be seen in Figure 1.
4.4.1 Adequacy gap scores
CCL had an adequacy gap score of 0.42. Both affect of service and library as place had a smaller adequacy gap score of -0.32 as compared to information control which had a score of -0.63. The results indicate that the Library had failed to meet the minimum expectation of service. The results were also confirmed by the Zone of Tolerance (Figure 2), where all items except for three items floated below the Zone of Tolerance. Only three attributes had very small adequacy gap
Item no. Statement Minimum
expected service level
Desired expected service level
scores namely: convenient library opening hours (0.14), access to the OPAC and space for group learning (0.01).Wide adequacy gap scores were observed in the following areas: access to photocopying facilities 1.23), modern computers (-1.23), adequate electronic resources I need (-1.15), access to printing facilities (-0.91), adequate printed library material (-0.89), access to electronic journals (-0.84) and space that is quiet for individual work (-0.73).The area of information control which focuses on the adequacy of collections and access to information was the most affected. The results are consistent with the studies done by Simba (2006) and Naidu (2009).
Figure 1 Summary of adequacy and superiority gaps at CCL
4.4.2 Superiority gaps
Wide superiority gap scores of more than a difference of one were observed at CCL. Students of CCL ranked affect of service and library as place with a gap score of -1.97 and information control with a negative adequacy gap of -2.27. The large negative superiority gaps in all service areas indicate that the CCL is far from meeting its users’ desired expectations. For the dimension of affect of service the lowest score was observed for library staff who instill confidence in users (-2.05) and dependability of handling users service problems (-2.01). The lowest score for library as place dimension were observed for the attributes of library that is quiet for individual study (-2.55) and library that has visually appealing facilities (-2.04). Lowest rankings for affect of service dimension were observed for the attribute of library staff who instill confidence in users (-2.05) and dependability of handling users’ service problems (-2.01). The dimension of information control had very wide gaps as seen in Figure 1. The lowest being access to photocopy facilities (-3.1) followed by modern computers that let me easily access information (-2.91), adequate electronic resources (-2.73), adequate library material I require for my work (-2.58) and adequate print journals (-2.03). These results are consistent with Cook et al., (2003) which found that libraries are not doing well in the service area of information control. The results show the need for immediate attention in those areas with very wide gap scores.
4.5 The Zone of Tolerance for Chancellor College Library services
Figure 2 Zone of Tolerance for CCL services
Table 2 Library service problems (N=186)
Comment Theme Count Percentage of
respondents
1 Books are not up-to-date /weed outdated books 43 23.1%
2 Books are not sufficient 42 22.6%
3 Some staff are impolite, intimidating, unwilling to help students 35 18.8%
4 The photocopier machine is always down 29 15.6%
5 Need for more computers 26 14.0%
6 Internet very expensive 24 12.9%
7 Library too noisy 24 12.9%
8 Inadequate space for study 14 7.5%
9 Long queues 13 7.0%
10 Internet slow or down 13 7.0%
11 More printing facilities and improved access 12 6.5%
12 Electronic resources inadequate 11 5.9%
13 Damaged books stay too long at the bindery 10 5.4%
14 There are just more irrelevant books 10 5.4%
15 Computers are old 9 4.8%
16 Need for staff training in public relations and customer care and need for staff motivation 8 4.3%
17 Broken windows 7 3.8%
18 More lights in the library 6 3.2%
19 Mutilation - tearing of pages in books 6 3.2%
20 Temperature in library (too cold or too hot) 6 3.2%
4.6 Library service problems
Users made comments to an open ended, multiple response question which was thematically analyzed. The most critical areas commented on by the students are seen in Table 2 above. The users’ comments were consistent with the findings from the quantitative data. Users made more comments on issues which related to the adequacy of the collection and resources and access to information which related to the information control dimension. A majority of users also complained of poor relations with staff as can be seen from Table 2. A number of complaints were made in regard to library as place which also needs to be looked into by Chancellor College Library management. The results indicate the need for more funding which was also confirmed by the College Librarian during the interview.
4.6.1 Overall satisfaction
The study also gathered expressions of the users’ general satisfaction with the library. Using a five-point Likert scale from strongly agree to strongly disagree users responded to the following statements:
4.6.2 The library provides me with the skill I need for my study
More than half of the users, 97 (52.2%), were satisfied with the information skills that the library provided. The remaining group of respondents were divided with 47 (25.3 %), undecided and 39 (21%), indicating they were dissatisfaction. 4.6.3 In general, I am satisfied with the way I am treated by staff at the library
In regard to the treatment received from the library staff, 77 (41.4%), were dissatisfied whilst a minority of respondents, 55 (29.6%) were satisfied. Surprisingly, 52 (28%), were undecided.
4.6.4 In general, I am satisfied with the library support for my learning and research needs
The respondents were however divided on the response to the question of the library support for learning and research needs with74 (39.8%), disagreeing with the statement and 65 (34.9%) indicating they were satisfied. A number of respondents, 44 (23.7%), were neutral.
4.6.5Rating the overall quality of the service provided by the library
Surprisingly, 83 (44.6%), of the respondents agreed that the services were good and a relatively smaller number, 70 (37.6%), indicated that they were dissatisfied with the services while 27 (14.5%), of the respondents were undecided. The marginal differences in the number which were satisfied and dissatisfied with the services revealed that the quality of service at the CCL was not absolutely good, therefore there is a need for improvement. However, Roszkowski et al., (2005) argued that it is practically impossible to fully satisfy customers’ needs based on the gap model since users tend to report being satisfied despite their expectations not being fully met.
5 Conclusions and recommendations
The results of the study show that there is a wide gap between user perceptions and expectations of service quality rendered to users of CCL. No major variations within the groups of users were revealed. The study showed that the undergraduate students had higher expectations of library service quality. They expected convenient library opening hours, adequate lighting and library staff that had knowledge to answer users’ queries.
With regard to the minimum expectations that undergraduate students would accept, the study indicated that users expected good quality service and their minimum expectations were not very high. However, their perceptions were exceeded by both the minimum expectations and desired expectations indicating a poor service in all service dimensions especially the dimension of information control. The results therefore resulted in negative adequacy gaps and very wide superiority gaps. These results imply that the following services at the CCL needed immediate attention: access to photocopy facilities, modern computers that let me easily access information, adequate electronic resources, adequate library material I require for my work, and reduced levels of noise.
The study recommends that:
• The parent body should increase the budget allocation to 6% (Opaleke 2002) or more which will enable the library to acquire print material, modern computers, photocopiers and printers.
• The CCL management should consider reviewing its policies such as the information access policy in view of the changes that have been made following the introduction of electronic information.
• The Library should be fully automated to improve service quality in most aspects like timely access to library materials, to eliminate routine tasks and perform efficiently the routine tasks such as the check-in and check-out, overdue notices and inventory which are tedious and time consuming.
• The records should be captured on the OPAC to facilitate easy access to information.
• The internet access should be improved by making it affordable and users should be encouraged to use electronic resources as an alternative to print resources.
staff to improve student and staff relations. • The outdated collection should be weeded.
• In regard to reduced level of noise, in the short term users should be encouraged to be silent as well as switching off their cell phones on entering the library. In the long term, the institution should consider building small branch libraries and a place where students can retire when they are not attending classes.
References
Broady-Preston, J. & Preston, H. 1999. Demonstrating quality in academic libraries. New Library World, 100(1148):124-129. Chiweza, D.S. 2000. Brief communication: the impact of national currency devaluation, cash budget system and information
technology on document supply in the University of Malawi: the case of Chancellor College Library. Interlending and Document Supply, 28(3):137-139.
Cook, C., Heath, F., Thompson, B. & Webster, D. 2003. LibQUAL+™: preliminary results from 2002. Performance Measurement and Metrics, 4(1):38-47.
Crawford, J. 2006. The culture of evaluation in library and information services. Oxford: Chandos Publishing. Dole, W. 2002. LibQUAL+™ and the small academic libraries. Performance Measurement and Metrics, 3(2):85-95. Hernon, P. 2002. Outcomes are key but not the whole story. The Journal of Academic Librarianship,28(1):54-55. Hernon, P. and Altman, E. 1996. Service quality in academic libraries. Norwood, N.J.: Ablex Publishing.
Hiller, S. 2004. Another tool in the assessment tool box: integrating LibQUAL+™ into the University of Washington libraries assessment program. In Heath, F.M., Kyrillidou, M & Askew, C.A. (eds). Libraries act on their LibQUAL+™ findings from data to action. Binghamton, NY.: Haworth Press.
Jurrow, S. & Barnard, S.B. (eds). 1993. Integrating total quality management in a library setting. 2nd ed. London: Haworth Press. Knapp, A.E. 2004. We asked them what they thought now what do we do: the use of LibQUAL+™ data to redesign public
services at the University of Pittsburgh. In Heath, F.M., M. Kyrillidou & Askew, C.A. (eds). Libraries act on their LibQUAL+™ findings from data to action. Binghamton, NY.: Haworth Press.
Moon, A. 2007. LibQUAL+™ at Rhodes University library: an overview of the first South African implementation. Performance measurement and metrics, 8(2):72–87.
Nagata, H., Sato, Y., Gerrard, S. & Kytomaki, P. 2004. The dimensions that construct the evaluation of service quality in academic libraries. Performance Measurement and Metrics,5(2): 53-65.
Naidu, Y. 2009. User perceptions of service quality and the level of user satisfaction at the Mangosuthu University of Technology Library, Umlazi, Durban. MIS thesis. Pietermaritzburg: University of KwaZulu-Natal.
Nawe, J. 2004. Strategising financing of public university libraries in East Africa. Library Management,25(8/9):381-385.
Nimsomboon, N. & Nagata, H. 2003. Assessment of library service quality at Thammasat University Library System. Thammasat University. [Online] www.kc.tsukuba.ac.jp. Accessed 06/03/2009.
Nitecki, D.A. 1996. Changing the concept and measure of service quality in academic libraries. The Journal of Academic Librarianship, 22(3):181-190.
Nitecki, D.A. & Franklin, B. 1999. Perspectives on new measures for research libraries. The Journal of Academic Librarianship, 25(6):484-487.
Opaleke, J.S. 2002. Impediments to qualitative services in academic libraries in Nigeria: an examination of libraries in four institutions in Kwara State. Library Review, 51(2): 100-106.
Parasuraman, A., Berry, L.L. & Zeithaml, V.A. 1985. A conceptual model of service quality and its implications for future research. Journal of Marketing, 49(Fall): 41-50.
Paulos, A. 2008. Library resources, knowledge production, and Africa in the 21st century. The International Information and Library Review,40:251-256.
Peterson, R., Murphy, B., Holmgren, S. & Thibodeau, P.L. 2004. The LibQUAL+™ challenge: an academic medical center’s per-spective, Duke University. In Heath, F.M., Kyrillidou, M. & Askew, C.A. (eds). Libraries act on their LibQUAL+™ findings from data to action. Binghamton, NY.: Haworth Press.
Quinn, B. 1997. Adapting service quality concepts to academic libraries. The Journal of Academic Librarianship, 23(5): 355-444. Roszkowski, M.J., Baky, J.S. & Jones, B.D. 2005. So which score on the LibQUAL+™ tells me if library user is satisfied? Library
and Information Science Research, 27(4):424-439.
Sahu, A.K. 2006. Perceptionsof service quality in an academic library: a case study. Journal of Services Research, 6(1):187-204. Saunders, E.S. 2007. The LibQUAL+ phenomenon: who judges the quality? Reference and User Services Quarterly, 47(1):21-24. Simba, C. 2006. User perceptions of the quality of service at Iringa University College library, Tumaini University. MIS thesis.
Pietermaritzburg: University of KwaZulu-Natal.
Smart, P. 2005. African Journals On Line (AJOL). Serials Review, 31(4):261-265.
Thompson, B., Kyrillidou, M. & Cook, C. 2008. How to evaluate the integrity of library service quality assessment data: intercontinental LibQUAL+® analyses used as concrete heuristic examples. Performance Measurement and Metrics, 9(3):202 -215.
Vuwa Phiri, D.B. 2009. Personal interview about Chancellor College Library services. Zomba.