_____________________________________________________________________________________________________
*Corresponding author: E-mail: [email protected];
Comparative Analysis of Determination Methods of
Glyphosate Degradation by Trichoderma asperellum
Strain JK-28: A Multivariate Statistical Approach
Atim Asitok
1*and Maurice Ekpenyong
11Department of Microbiology, Environmental Microbiology and Biotechnology Unit, Faculty of
Biological Sciences, University of Calabar, P.M.B.1115, Calabar, Nigeria.
Authors’ contributions
This work was carried out in collaboration between both authors. Author AA proposed the research, designed the protocol and conducted the experiments while author ME conducted the statistical analyses and drafted the first manuscript. Both authors prepared the final manuscript for submission.
Article Information
DOI: 10.9734/JAERI/2019/v19i130070 Editor(s): (1) Dr. Nhamo Nhamo, Associate Professor, Marondera University of Agricultural Sciences and Technology, Zimbabwe. Reviewers: (1) Lokuhewage Asha Udayamali Meegolle, Japan. (2) Moses Mwajar Ngeiywa, University of Eldoret, Kenya. (3) V. Vasanthabharathi, M. S. Swaminathan Research Foundation, Chennai. Complete Peer review History:http://www.sdiarticle3.com/review-history/49514
Received 28 March 2019 Accepted 12 June 2019 Published 20 June 2019
ABSTRACT
Aims: This study aimed at demonstrating the ability of a mold species, isolated from a rice farm agricultural soil, chronically treated with glyphosate herbicide, to degrade glyphosate and to compare different evaluation methods of biodegradation.
Study Design: A completely randomized design of a factorial experiment was used.
Place and Duration of Study: The study was conducted at the Department of Microbiology, University of Calabar, Nigeria between February and April.
Methodology: Molds were isolated from nine rice agricultural soil samples using potato dextrose agar. The molds were screened for glyphosate degradation using different media to determine their requirement for supplementation or not at all. A completely randomized design of a factorial experiment involving 3 factors at 3 levels each, with three replications, was adopted for glyphosate degradation studies. Degradation was monitored by dehydrogenase activity, carbon dioxide evolution, pH changes, fungal dry weight and residual glyphosate determination. A comparative evaluation of the different methods was made using multivariate statistics.
Results: The mold, identified as Trichoderma asperellum strain JK-28, was incapable of using glyphosate as sole sources of phosphorus and nitrogen and so required nutrient supplementation. Largest significant correlation between dependent variables (P < .001; r = - 779) occurred between dehydrogenase activity and fungal dry weight while the lowest was between residual glyphosate and fungal dry weight. Residual glyphosate and pH had negative correlations with other dependent variables. Principal component analysis extracted only one component with a cumulative variance of 70%. Multivariate analysis of variance (three-way MANOVA) of data, interpreted from the Pillai’s Trace test, was significant at P <.001 for the main, two- and three-way interactions.
Conclusion: Trichoderma asperellum strain JK-28 could degrade glyphosate using it as sole carbon source but with nutrient supplementation. Residual glyphosate determination is recommended as most reliable method for evaluating organic pollutant biodegradation.
Keywords: Trichoderma asperellum strain JK-28; glyphosate; degradation; correlation analysis; principal component analysis; three-way MANOVA.
1. INTRODUCTION
Glyphosate is a broad spectrum, non-selective herbicide used in the control and/or killing of grasses, herbaceous plants, including deep rooted perennial weeds, brush, some broad-leaf trees and some shrubs [1]. It can be used in no-till agriculture, to prepare fields before planting, during crop development and after crop harvest. Its mode of action is the inhibition of 5-enolpyruvylshikimate-3-phosphate synthase, resulting in the depletion of essential aromatic amino acids needed for plant survival [2]. On application, glyphosate remains unchanged in the soil for varying lengths of time, as a result of its adsorption on clay particles and organic matter present in the soil [3]. There is increasing report of glyphosate seeping into and contaminating groundwater, even polluting it, at high concentrations. Attendant health and environmental effects of the herbicide contamination which therefore necessitates decontamination (remediation) are extensively discussed in Cox [4].
A recommended technique for environmental (soil or groundwater) remediation is the use of microorganisms. This is because the removal of glyphosate from the environment is usually by microbiological processes as chemical processes of degradation are ineffective because of the presence of highly stable carbon-phosphorus bonds present in the compound [5]. Studies of glyphosate-degrading bacteria have involved isolation of pure bacterial and fungal strains with novel degradation capabilities for potential uses in biotechnological industry and bioremediation of polluted soils and water [6]. Reports also show that glyphosate inhibit microbial activities in the soil in its attempt at killing weeds thus compromising soil fertility [7]. However,
microorganisms significantly degrade glyphosate by breaking the carbon-phosphorus (C-P) bonds and releasing sarcosine as the major degradation product. The ability of microorganisms to utilize organophosphorus compounds as sole phosphorus source is well documented [6,8]. The first evidence of the biological cleavage of the C-P bond was obtained with E. coli as the bacterium utilized methyl-phosphonic or ethyl-phosphonic acids as sole sources of phosphorus. It is possible that after depletion of easily assimilated phosphorus sources in the environment, only the phosphites and phosphonates are left for microorganisms as sources of phosphorus.
In the present study, we demonstrate the ability of a rarely encountered mold, isolated from a rice field, to degrade glyphosate present in the frequently used herbicide ‘Round-up’ and compared, using multivariate statistics, the reliability of five major evaluation methods often employed in organic biodegradation measurements in laboratory and field experiments .
2. METHODOLOGY
2.1 Sample Collection and Selection of Glyphosate-degrading Molds Using Different Media
according to nutrient tested since glyphosate is reported to serve as sole sources of carbon, nitrogen and phosphorus [6,9]. All minimal media were supplemented with 1 mL of trace mineral solution containing (g/L): ZnSO4.7H2O 0.005;
MnSO4.4H2O 0.005; H3BO3 0.005; CuSO4.5H2O
0.005; CoCl2.6H2O 0.005; MoNa2O4.2H2O 0.005
and NiCl2.6H2O 0.005 [10]. The minimal medium,
supplemented with 5000 µg/L glyphosate-based herbicide ‘Round-up’ was used throughout the study. Duplicate plates were prepared and incubated at room temperature for 14 days. Only the mold culture with the fastest and densest growth on any of the media was used for further studies.
Medium 1: Minimal medium containing 5,000 µg/L glyphosate as sole sources of carbon, nitrogen and phosphorus and supplemented with 1 mL of trace mineral solution with pH adjusted to 5.8 and solidified with 1.5% agar-agar, was dispensed in 49 mL volumes into 250-mL Erlenmeyer flasks and sterilized by autoclaving at 121ºC for 15 min.
Medium 2: Minimal medium containing 5,000 µg/L of glyphosate and supplemented with 1% (w/v) ammonium chloride (NH4Cl), 1% (w/v)
dipotassium hydrogen phosphate (K2HPO4), 1%
(w/v) potassium orthophosphate (KH2PO4) and 1
mL of trace mineral solution with pH adjusted to 5.8, and solidified with 1.5% agar-agar, was dispensed in 49 mL volumes into 250 mL Erlenmeyer flasks and sterilized by autoclaving at 121ºC for 15 min. Here, glyphosate only served as sole carbon source with nitrogen and phosphorus sources boosted by ammonium and phosphate supplementations respectively.
Medium 3: Minimal medium containing 5,000 µg/L of glyphosate and supplemented with 1% (w/v) dipotassium hydrogen phosphate (K2HPO4), 1% (w/v) potassium orthophosphate
(KH2PO4) and supplemented with 1 mL of trace
mineral solution with pH adjusted to 5.8, and solidified with 1.5% agar-agar, was dispensed in 49 mL volumes into 250 mL Erlenmeyer flasks and sterilized by autoclaving at 121ºC for 15 min. The glyphosate served as sole source of carbon and nitrogen but not of phosphorus as it received a boost from phosphate supplementation.
Medium 4: Minimal medium containing 5,000 µg/L of glyphosate and supplemented with 1% (w/v) ammonium chloride (NH4Cl) and 1 mL of
trace mineral solution with pH adjusted to 5.8, and solidified with 1.5% agar-agar, was dispensed in 49 mL volumes into 250 mL
Erlenmeyer flask and sterilized by autoclaving at 121ºC for 15 min. The glyphosate served as sole sources of carbon and phosphorus but not of nitrogen as it received a boost from ammonium chloride supplementation.
2.2 Morphological and Molecular
Identification of
Glyphosate-degrading Mold
The mold species with the densest growth on the glyphosate medium was identified morphologically using surface and reverse colouration, spore and mycelium patterns, microscopy for conidia and conidiophores after staining with lacto-phenol cotton blue and molecular characterization by ITS sequencing using universal ITS primers (ITS1-F and ITS4) for quantitative PCR and heterogeneity analysis as described in Manter and Vivanco [11].
2.3 Glyphosate Degradation Studies with Strain JK-28
Minimal medium 2 was selected for degradation studies by the mold and was dispensed in 50 mL volumes into 250 mL Erlenmeyer flasks in triplicates. Flasks and contents were sterilized by autoclaving at 121ºC for 15 min. Upon cooling, degradation study flasks were inoculated with an earlier prepared spore suspension of strain JK-28 at 2% (v/v) spore concentration of108 spores/mL. Briefly, spore suspension was prepared by allowing the mold to grow for 72 h on potato dextrose agar (PDA) slants in Roux bottles for 96 h. Spores were harvested by addition of 5 mL sterile phosphate buffer to mold growth, followed by gentle up and down, side to side swirling of the bottle. Dislodged spores were transferred to a sterile receptacle and dilutions prepared using phosphate buffer.
2.3.1 Preparation of glyphosate standard curve
A stock solution of analytical grade glyphosate containing 1000 µg/mL was prepared by dissolving 0.1 g of glyphosate in 20 mL distilled water and then making up to the 100 mL mark in a volumetric flask. Additionally, 1000 µg/mL of ammoniacal copper nitrate [Cu(NO3)2] solution
was prepared by dissolving 0.1 g of the compound in 20 mL distilled water and diluting to 100 mL with ammonia solution. Finally, a 1% solution of carbon disulphide (CS2) was prepared
by mixing 0.5 mL CS2 in chloroform and diluting
20 µg/mL) were added to a series of 100 mL separating funnels. To each flask was added 5 mL of 1% v/v CS2 solution and the mixture
shaken until formation of dithiocarbamic acid. Afterwards, 1 mL of ammoniacal solution of Cu (II) (100 µg/mL) was added to the mixture for complexation with dithiocarbamic acid. The mixture was again shaken vigorously for 3 min and left for separation of two phases. The yellow-coloured chloroform layer containing the complex was separated in a 10 mL flask and diluted with ethanol. The absorbance of the complex was read off at 435 nm wavelength using a UV-Vis Spectrophotometer.
2.3.2 Experimental design and degradation studies
Independent variables considered in the degradation studies were glyphosate concentration, nature of ammonium-nitrogen and fermentation time. Three levels of the herbicide ‘Round-up’ concentrations used included 5,000, 7,500 and 10,000 µg/L which corresponded to 2050, 3075 and 4100 µg/mL of glyphosate respectively; the three ammonium- or amino-nitrogen sources included ammonium chloride, urea and L-asparagine at 1% (w/v); and three levels of time investigated included 10, 20 and 30 days. The experiment was set up in 250 mL Erlenmeyer flasks provided with outlets to trap CO2. Degradation flasks were incubated at room
temperature (28 ± 2ºC) for 30 days on a rotary shaker agitating at 130 rpm. At 10-day intervals, 10 mL of flask contents were withdrawn for determination of dehydrogenase activity, fungal dry weight, residual glyphosate, amount of carbon dioxide evolved and pH.
2.3.2.1 Measurement of dehydrogenase activity
Dehydrogenase activity was determined as described by Casida et al. [13]. The activity was based on the reduction of the water-soluble 2, 3, 5 triphenyltetrazolium chloride (TTC) substrate to the reddish-colored water-insoluble formazan products whose intensities were measured spectrophotometrically at a wavelength of 485 nm with methanol as blank [14]. The results of the periodic samples were compared with triphenyl formazan standards.
2.3.2.2 Determination of fungal biomass by dry weight
The mold strain JK-28 was grown on potato dextrose agar belly-slant in Roux bottle for 168 h
at room temperature (28 ± 2ºC) to obtain spores. Fungal spores were harvested and suspension
prepared in sterile phosphate buffer solution containing 0.05% Tween 80 [15]. The stock suspension was diluted through a
series of ten triplicate ten-fold dilutions. Optical density (OD600) of each dilution was determined
by means of a spectrophotometer. One milliliter (1 mL) of each spore dilution was also
plated onto potato dextrose agar (PDA) and plates incubated at room temperature for 72
h. Counts were taken by means of a Neubauer counting chamber and reported as
spore forming units per milliliter (sfu/mL). The result was used to prepare a standard curve
to establish a relationship between OD600
and spore count. Mycelium from each triplicate plate was separated by melting agar, diluting and filtering through Whatman No.1 filter paper.
The mycelial pellet was repeatedly washed with distilled water and dried at 70ºC overnight.
Dry weight of the fungus was calculated by subtracting the weight of filter paper from the combined weight of filter paper and
mycelium using the equation;
= − . 1
where, MDW is the mean fungal dry weight (g),
wf is combined weight of filter paper
and fungal mycelium (g) and w0 is weight of filter
paper alone (g).
Once again, a standard curve was prepared by regressing mean dry weight on absorbance at a wavelength of 600
nm. Fungal biomass was determined by dry weight using the regression equation of the standard curve;
= 1.6144 – 1.7393 . 2
2.3.2.3 Determination of residual glyphosate
Residual glyphosate was determined by the spectrophotometric method described in Jan et
al. [12], using sterile filtrate obtained from a two-stage filtration of flask contents using first Whatman No.1 and next 0.22 µM membrane filter (Millipore). The procedure is as
described in section 2.4.2. The mean absorbance reading was inserted into the regression equation obtained from residual glyphosate calibration curve;
2.3.2.4 Measurement of glyphosate degradation by carbon dioxide evolution
Amount of carbon dioxide evolved during glyphosate degradation was determined using the titrimetric method described in Ekpenyong and Antai [16] and Asitok et al. [17] using the equation
− 2 ( ) = ( − ) . 4
where C-CO2 is the amount of carbon (IV) oxide
evolved; B, the volume (milliliters) of acid used to titrate the alkali in carbon (IV) oxide collectors to end point in the control; V, the volume (milliliters) of acid used to titrate the alkali in the carbon (IV) oxide collectors to end point in the treatments; N, normality of acid (HCl); E, equivalent weight; if data are expressed as carbon (IV) oxide, E = 22, but if expressed as carbon, then E = 6.
2.3.2.5 pH determination
pH measurements of all test samples were made using Orion 710A pH Meter equipped with glass electrode after calibration with appropriate buffers.
2.4 Statistical Analyses
Correlation analysis (CA) among dehydrogenase activity (DHA), amount of carbon dioxide evolved (CDE), fungal dry weight (FDW), residual glyphosate (RGP) and pH, principal component analysis (PCA) and multivariate analysis of variance (MANOVA) of data, were all conducted using SPSS ver. 20 (IBM, USA).
3. RESULTS AND DISCUSSION
Medium 2 was selected for glyphosate degradation studies because residual glyphosate was least in it suggesting that the mold could only use glyphosate as sole source of carbon and not as sole sources of nitrogen and phosphorus. A total of five molds demonstrated abilities to degrade the glyphosate-based herbicide (Round-up) within the study time. One particular strain, JK-28, was outstanding and was employed in further degradation studies. The white mycelial mold possessed velutinous colonial growth. Conidia were green and started off from the center to spread en masse with the reverse of the plate remaining un-coloured or white [18]. Microscopy revealed globose conidia with terminal chlamydospores and flask-shaped phialides. Molecular sequencing using universal
ITS primers (ITS1-F and ITS4), NCBI BLAST and phylogenetic analysis using MEGA 4.0 revealed that the mold shared 100% sequence homology with Trichoderma asperellum GDFS1009 (Accession Number: KF367522) earlier isolated by Wu et al. [18] and studied for its biocontrol efficacy. The mold was therefore identified as Trichoderma asperellum strain JK-28, maintained in sterile soil and deposited with University of Calabar Collection of Microorganisms (UCCM).
Fig. 1 is the calibration curve for the determination of residual glyphosate concentration. The regression model equation, Eqn. 2, was significant at P < .001, with an adjusted R2 of 0.9925 suggesting that 99.25% of the variations in the outcome variable was due to the independent variable and so could be used to determine residual glyphosate concentrations from test samples. Fig. 2 presents the standard curve used for the determination of fungal dry weight from spore concentration. The model equation, Eqn. 2 was significant at P < 0.001, with an adjusted R2 of 0.9682 suggesting that the model equation could explain 96.82% of the variations about the data. The model equation was therefore used to determine fungal dry weight during glyphosate degradation studies.
Multivariate statistics are a robust statistical tool with potential to identify, classify, quantify and interpret interrelationships that exist between and among experimental variables [19,20]. In this study, we adopted correlation analysis (CA), three-way multivariate analysis of variance (MANOVA) and principal component analysis (PCA) to explain the nature of relationships that existed between and among the dependent variables (DVs) and the main and interactive effects of independent variables (IVs) that controlled the values of the DVs.
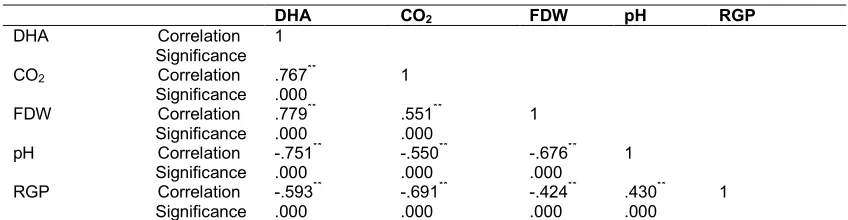
dehydrogenase activity (DHA). Coefficients of these correlates were: DHA/fungal dry weight (FDW), r = .779, DHA/CO2 evolved (CDE), r =
.767 and DHA/pH, r = -.751.The relationship between DHA and FDW was a strong positive correlation suggesting that FDW increased as dehydrogenase activity increased. Since biological oxidations of organic compounds are mostly, if not entirely, dehydrogenase-mediated reactions [21], DHA, a measure of respiratory metabolism, correlated strongly and positively with microbial biomass-FDW [22]. As microbial oxidations progress, acidic degradation intermediates accumulate in systems causing decreases in pH which relate negatively but strongly with DHA and with FDW [23].
One of the major end products of complete respiratory metabolism is carbon dioxide (CO2)
which volume indicates the amount of
mineralized carbon from the organic compound. The higher the respiratory metabolism, the more the amount of CO2 evolved, and if properly
trapped, then quantified. Expectations were that there will be a strong positive relationship between DHA and amount of CO2 evolved, which
was the case in this study. Assessment of glyphosate degradation using carbon dioxide evolution method had earlier been reported by Principal component analysis (PCA) is a mathematical dimension-reduction procedure that transforms a large number of weakly to moderately correlated variables into a smaller number of uncorrelated variables called principal components. A correlation matrix that shows only a few correlations above .30 suggests discontinuation of the analysis [24]. Our correlation analysis results showed that all the correlations were above .30 suggesting that PCA could be conducted on the data. Our results
Fig. 1. Calibration curve for the determination of residual glyphosate
Table 1. Pearson’s bivariate correlation analysis of dependent variables of glyphosate degradation by Trichoderma asperellum strain JK-28
DHA CO2 FDW pH RGP
DHA Correlation 1
Significance
CO2 Correlation .767** 1
Significance .000
FDW Correlation .779** .551** 1
Significance .000 .000
pH Correlation -.751** -.550** -.676** 1
Significance .000 .000 .000
RGP Correlation -.593** -.691** -.424** .430** 1
Significance .000 .000 .000 .000
**. Correlation is significant at the 0.01 level (2-tailed); DHA – Dehydrogenase activity; CO2 – Amount of carbon dioxide
Fig. 2. Calibration curve for the determination of fungal dry weight
revealed a Kaiser-Meyer-Olkin measure of sampling adequacy (KMO) of .812 and a significant (P < .0005) Bartlett’s test of Sphericity suggesting that the null hypothesis which assumed an identity matrix in the data should be rejected and a PCA accordingly performed.
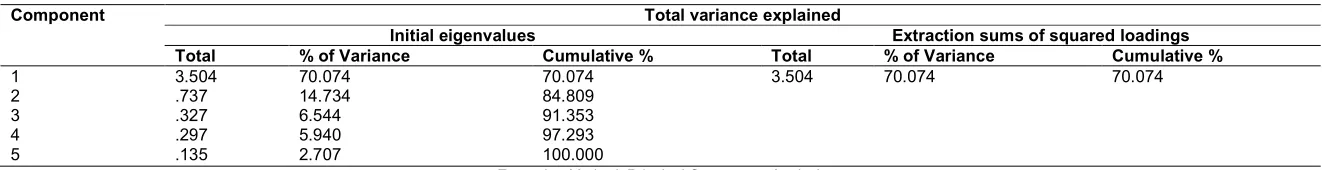
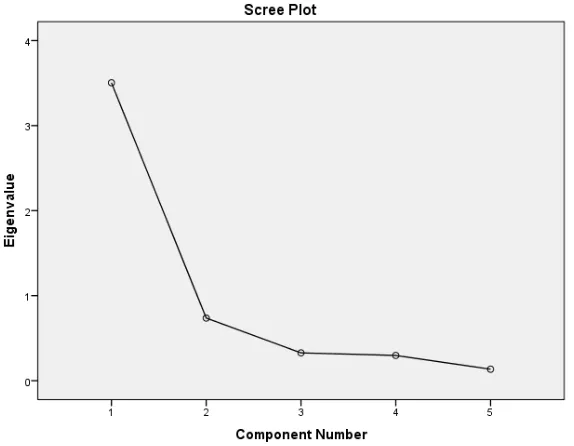
Only one principal component, with initial eigenvalues ≥1.0, was extracted suggesting that the PCA constructed one principal component from the survey items based on eigenvalues. An eigenvalue is a ratio of the shared variance to the unique variance accounted for in the construct of interest by each factor obtained from the extraction by principal component(s). Eigenvalues of 1.0 or greater are an arbitrary criterion accepted to help decide if a factor should be further interpreted or not. Table 2 presents the extracted components and their eigenvalues that guided the extraction. Extraction of one component with a cumulative explained variance of 70.07% suggested that one factor solution was sufficient to study the degradation of glyphosate by the mold. Put another way, any one of the dependent variables would have sufficed for the evaluation of glyphosate degradation. The only difference would be in the sensitivity of the variable which could be given by their R2 values. Fig. 3 presents the number of extracted components as a Scree plot to show the elbow (break) point of the plot confirming the only one extracted principal component.
A three-way multivariate analysis of variance (3-way MANOVA) was conducted on data to evaluate the main effects of glyphosate
concentration, nitrogen source and duration of exposure on the five moderately correlated dependent variables (DVs). The assumption of homogeneity test for equality of error variance was met, as presented in Table 3. The Table shows that Levene’s test of equality of error variance was not significant for any of the five DVs and this permitted the interpretation of the multivariate test results.
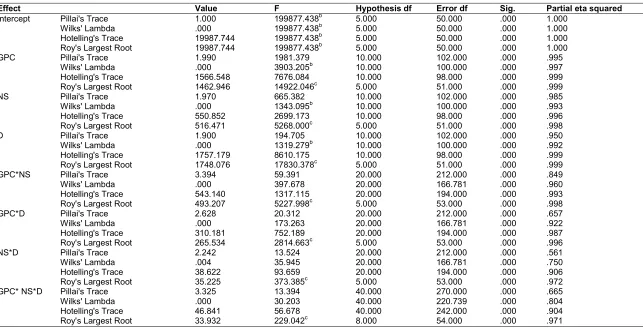
Table 4 presents the four different multivariate tests conducted to explain the main, two-way and three-way interactive effects of the IVs on the combined DVs. The Table shows that all four multivariate tests were significant (P < .001) for both main and interactive effects. Because the Box M test of homogeneity of equality of covariance was violated, we report and interpret the Pillai’s Trace which is the most robust of the four multivariate tests and is able to maneuver through the violated assumption instead of the frequently interpreted Wilks’ Lambda test. The Table shows that there was a statistically significant interactive effect between glyphosate concentration and nitrogen source on the combined DVs: GlyphoConc*NitroSour, F (20, 212) = 59.39, P < .001; Pillai’s Trace = 3.39, partial ƞ2 = .849.
8
Table 2. Total explainable variance of a principal component analysis showing one extracted component
Component Total variance explained
Initial eigenvalues Extraction sums of squared loadings
Total % of Variance Cumulative % Total % of Variance Cumulative %
1 3.504 70.074 70.074 3.504 70.074 70.074
2 .737 14.734 84.809
3 .327 6.544 91.353
4 .297 5.940 97.293
5 .135 2.707 100.000
Table 3. Levene's test of equality of error variancesa of dependent variables
F df1 df2 Sig.
Dehydrogenase activity 1.092 26 54 .382
Amount of carbon dioxide evolved .469 26 54 .981
Mean fungal dry weight 1.063 26 54 .413
pH 1.113 26 54 .361
Residual glyphosate concentration 1.030 26 54 .449
Tests the null hypothesis that the error variance of the dependent variable is equal across groups
a. Design: Intercept + GlyphoConc + NitroSour + Duration + GlyphoConc * NitroSour + GlyphoConc * Duration + NitroSour * Duration + GlyphoConc * NitroSour * Duration
Fig. 3. Scree plot of a principal component analysis showing one extracted component
partial ƞ2 = .561 respectively. Finally, the interactive effect of the three IVs on the combined DVs was also significant: GlyphoConc*NitroSour*Duration, F (40, 270) = 13.39, P = .001; Pillai’s Trace = 3.32, partial ƞ2 = .665. These results indicate that biodegradation of glyphosate by Trichoderma asperellum strain JK-28 was affected significantly by glyphosate concentration which was, in itself, influenced by the nature of nitrogen source in the system and the duration of exposure to the fungus.
Since the Partial Eta Squared (ƞ2) value has the same connotation as R2 in regression statistics, these results indicate that the interaction between glyphosate concentration and the nitrogen sources could explain about 85% of the variations that were observed about glyphosate degradation using the combined dependent variables. Other two-way interactions yielded lower explainable values but the three-way interaction was responsible for 66.5% of the
variations observed in the five dependent variables in combination during the herbicide degradation.
The main effects of the IVs were even more influential on the extent of glyphosate degradation. The Table shows that glyphosate
concentration, on its own, was responsible for 99.5% of the variations observed in the
response variables. Concentration of an organic substrate could influence the nature of
metabolism that prevails in the organism at any
given point in time. A typical example is the glucose (Crab-tree) effect in Saccharomyces
cerevisiae and other yeasts. Nature of nitrogen source and duration of degradation
studies were able to explain 98.5% and 95% respectively, of the variations about the combined DVs.
10
Table 4. Multivariate testa results of a three-way multivariate analysis of variance
Effect Value F Hypothesis df Error df Sig. Partial eta squared
Intercept Pillai's Trace 1.000 199877.438b 5.000 50.000 .000 1.000
Wilks' Lambda .000 199877.438b 5.000 50.000 .000 1.000
Hotelling's Trace 19987.744 199877.438b 5.000 50.000 .000 1.000
Roy's Largest Root 19987.744 199877.438b 5.000 50.000 .000 1.000
GPC Pillai's Trace 1.990 1981.379 10.000 102.000 .000 .995
Wilks' Lambda .000 3903.205b 10.000 100.000 .000 .997
Hotelling's Trace 1566.548 7676.084 10.000 98.000 .000 .999
Roy's Largest Root 1462.946 14922.046c 5.000 51.000 .000 .999
NS Pillai's Trace 1.970 665.382 10.000 102.000 .000 .985
Wilks' Lambda .000 1343.095b 10.000 100.000 .000 .993
Hotelling's Trace 550.852 2699.173 10.000 98.000 .000 .996
Roy's Largest Root 516.471 5268.000c 5.000 51.000 .000 .998
D Pillai's Trace 1.900 194.705 10.000 102.000 .000 .950
Wilks' Lambda .000 1319.279b 10.000 100.000 .000 .992
Hotelling's Trace 1757.179 8610.175 10.000 98.000 .000 .999
Roy's Largest Root 1748.076 17830.378c 5.000 51.000 .000 .999
GPC*NS Pillai's Trace 3.394 59.391 20.000 212.000 .000 .849
Wilks' Lambda .000 397.678 20.000 166.781 .000 .960
Hotelling's Trace 543.140 1317.115 20.000 194.000 .000 .993
Roy's Largest Root 493.207 5227.998c 5.000 53.000 .000 .998
GPC*D Pillai's Trace 2.628 20.312 20.000 212.000 .000 .657
Wilks' Lambda .000 173.263 20.000 166.781 .000 .922
Hotelling's Trace 310.181 752.189 20.000 194.000 .000 .987
Roy's Largest Root 265.534 2814.663c 5.000 53.000 .000 .996
NS*D Pillai's Trace 2.242 13.524 20.000 212.000 .000 .561
Wilks' Lambda .004 35.945 20.000 166.781 .000 .750
Hotelling's Trace 38.622 93.659 20.000 194.000 .000 .906
Roy's Largest Root 35.225 373.385c 5.000 53.000 .000 .972
GPC* NS*D Pillai's Trace 3.325 13.394 40.000 270.000 .000 .665
Wilks' Lambda .000 30.203 40.000 220.739 .000 .804
Hotelling's Trace 46.841 56.678 40.000 242.000 .000 .904
Roy's Largest Root 33.932 229.042c 8.000 54.000 .000 .971
a. Design: Intercept + GPC + NS + Duration + GPC*NS + GPC*D + NS*D + GPC*NS*D, b. Exact statistic c. The statistic is an upper bound on F that yields a lower bound on the significance level.
11
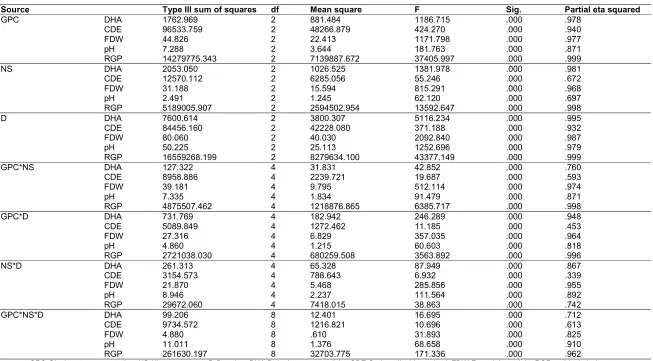
Table 5. Extract of Tests of between-subjects effects of MANOVA showing only the categorical variable
Source Type III sum of squares df Mean square F Sig. Partial eta squared
GPC DHA 1762.969 2 881.484 1186.715 .000 .978
CDE 96533.759 2 48266.879 424.270 .000 .940
FDW 44.826 2 22.413 1171.798 .000 .977
pH 7.288 2 3.644 181.763 .000 .871
RGP 14279775.343 2 7139887.672 37405.997 .000 .999
NS DHA 2053.050 2 1026.525 1381.978 .000 .981
CDE 12570.112 2 6285.056 55.246 .000 .672
FDW 31.188 2 15.594 815.291 .000 .968
pH 2.491 2 1.245 62.120 .000 .697
RGP 5189005.907 2 2594502.954 13592.647 .000 .998
D DHA 7600.614 2 3800.307 5116.234 .000 .995
CDE 84456.160 2 42228.080 371.188 .000 .932
FDW 80.060 2 40.030 2092.840 .000 .987
pH 50.225 2 25.113 1252.696 .000 .979
RGP 16559268.199 2 8279634.100 43377.149 .000 .999
GPC*NS DHA 127.322 4 31.831 42.852 .000 .760
CDE 8958.886 4 2239.721 19.687 .000 .593
FDW 39.181 4 9.795 512.114 .000 .974
pH 7.335 4 1.834 91.479 .000 .871
RGP 4875507.462 4 1218876.865 6385.717 .000 .998
GPC*D DHA 731.769 4 182.942 246.289 .000 .948
CDE 5089.849 4 1272.462 11.185 .000 .453
FDW 27.316 4 6.829 357.035 .000 .964
pH 4.860 4 1.215 60.603 .000 .818
RGP 2721038.030 4 680259.508 3563.892 .000 .996
NS*D DHA 261.313 4 65.328 87.949 .000 .867
CDE 3154.573 4 788.643 6.932 .000 .339
FDW 21.870 4 5.468 285.856 .000 .955
pH 8.946 4 2.237 111.564 .000 .892
RGP 29672.060 4 7418.015 38.863 .000 .742
GPC*NS*D DHA 99.206 8 12.401 16.695 .000 .712
CDE 9734.572 8 1216.821 10.696 .000 .613
FDW 4.880 8 .610 31.893 .000 .825
pH 11.011 8 1.376 68.658 .000 .910
RGP 261630.197 8 32703.775 171.336 .000 .962
Partial Eta Squared is interpreted in much the same way as R2 in regression analysis. In this study, the ƞ2 values for the main effects of glyphosate concentration, nature of nitrogen source and duration of exposure to degradation, ranged between 67.2% and 99.9% while those for the interaction effects ranged from 33.9% to 99.8%. These results suggest that the interaction effects of the independent variables were responsible for the bulk of the variations in the outcome or dependent variables but that the main effects made more significant contributions to glyphosate degradation.
A comparison of the reliability of dependent variables to measure biodegradation using partial Eta Squared ƞ2 values (Table 5) revealed that residual glyphosate was the most reliable. The variable ranged from 99.8% to 99.9% in its ability to explain data variations brought about by the main effects and 74.2% to 99.8% for data variations by interaction effects. Fungal dry weight measurement was second while the least reliable measurement came from carbon dioxide evolution. This observation about carbon dioxide evolution method is plausible since its measurements rely on the amount of carbon extracted from the original organic compound. The more carbon converted to biomass, the less will be evolved as carbon dioxide.
We employed both the Bonferoni’s post hoc multiple comparison test and the Turkey HSD test to separate significant means.
Results (not shown) showed that mean differences of all pairwise comparisons for
the five dependent variables against glyphosate concentration and duration as
independent variables were significant (P = .000) using both Bonferroni and Turkey HSD. However, the two post hoc tests returned dissimilar results when nitrogen sources served as the independent variable, if carbon dioxide evolution
and pH fluctuations served as measures of
degradation. Turkey HSD showed that when amount of carbon dioxide evolved served as the measure of glyphosate
degradation, the mean difference between the use of L-asparagine and ammonium chloride as nitrogen source was not significant (P = .793 > .05) but were significantly different
between either of the pair with urea. However, the corresponding Bonferroni test
reported a non-significant P value of 1.000 suggesting that the later test was more discriminating and therefore less prone to error
than the former. Additionally, when pH served as
the measure of glyphosate degradation, the mean difference between the use of L-asparagine and urea as nitrogen sources was not significant (P = .377 > .05) but was significantly different between either of the pair with ammonium chloride. Bonferroni test also reported a non-significant P value of
.552 suggesting once again that the later test was more discriminating than the former.
4. CONCLUSION
The mold Trichoderma asperellum strain JK-28,
isolated from rice farm soil frequently treated with glyphosate herbicide, demonstrated sublime
potential for glyphosate degradation. Pure culture of the mold could use the herbicide as sole source of carbon but not as sole sources
of nitrogen and phosphorus and therefore required supplementations. Correlation
analysis revealed that the five dependent variables selected as measures of glyphosate degradation were moderately correlated with each other. Principal component analysis returned a one-factor solution suggesting that any one of the five variables would be appropriate to monitor degradation of the organic compound. The main, two-way and three-way interaction effects from MANOVA were best explained by residual glyphosate
which, in most cases, could explain ≥ 95% of the variations about the data. The variable is therefore recommended as reliable in
degradation studies. A comparative post hoc multiple comparison using both Turkey
HSD and Bonferroni tests revealed that Bonferroni tests were more discriminating
and therefore less prone to returning erroneous results for significant mean
separations.
COMPETING INTERESTS
Authors have declared that no competing interests exist.
REFERENCES
1. Cox C. Glyphosate, Part I: Toxicology. J Pesticide Reform. 1995;15:14-20.
2. Zablotowicz RM, Reddy KN. Impact of glyphosate on Bradyrhizobium japonicum symbiosis with glyphosate-resistant transgenic soybean: A minireview. J Environ Qual 2004;33:825-833.
3. Peñaloza-Vazquez A, Mena GL, Herrera-Estrella L, Bailey AM. Cloning and sequencing of the genes involved in glyphosate utilization by Pseudomonas pseudomallei. Appl Environ Microbiol. 1995;61:538-543.
4. Cox C. Glyphosate, Part II: Human exposure and ecological effects. J Pesticide Reform. 1995;15:14-20.
5. Gimsing AL, Borggaard OK, Bang M. Influence of soil composition on adsorption of glyphosate and phosphate by contrasting Danish surface soils. Eur J Soil Sci 2004;55:183-191.
Available:https://doi.org/10.1046/j.1365-2389.2003.00585.x
6. Yu XM, Yu T, Yin GH, Dong QL, An M, Wang HR, Ai CX. Glyphosate biodegradation and potential soil bioremediation by Bacillus subtilis strain Bs-15. Genet Mol Res 2015; 14: 14717-14730.
Available:https://doi.org/10.4238/2015.Nov ember.18.37
7. Haney RL, Senseman SA, Hons FM, Zuberer DA. Effect of glyphosate on soil microbial activity and biomass. Weed Sci 2000;48:89-93.
Available:https://doi.org/10.1614/0043-1745(2000)048[0089:EOGOSM]2.0.CO;2 8. Ekpenyong MG, Antai SP, Essien JP.
Quantitative and qualitative assessment of hydrocarbon degrading bacteria and fungi in Qua Iboe Estuary, Nigeria. Res J Microbiol. 2007;2:415-425.
Available:https://doi.org/10.3923/jm.2007.4 15.425
9. Moneke AN, Okpala GN, Anyanwu CU.
Biodegradation of glyphosate herbicide in vitro using bacterial isolates from four rice fields. Afr J
Biotechnol. 2010;9:4067-4074.
10. Ekpenyong MG, Antai SP, Asitok AD, Ekpo BO. Plackett-Burman design and response surface optimization of medium trace nutrients for glycolipopeptide biosurfactant production. Iranian Biomed J. 2017;21:249-260.
Available:https://doi.org/10.18869/acadpub .ibj.21.4.249
11. Manter DK, Vivanco JM. Use of the ITS primers, ITS1-F and ITS4, to characterize fungal abundance and diversity in mixed template samples by qPCR and length heterogeneity analysis. J Microbiol Meth 2007;71:7-14.
Available:https://doi.org/10.1016/j.mimet.2 007.06.016
12. Jan MR, Shah J, Muhammad M, Ara B. Glyphosate herbicide residue determination in samples of environmental importance using spectrophotometric method. J Hazard Mater. 2009;169:742-745.
Available:https://doi.org/10.1016/j.jhazmat. 2009.04.003
13. Casida Jr LE, Klein DD, Santoro T. Soil dehydrogenase activity. Soil Sci. 1964; 98: 371-376.
Available:https://doi.org/10.1097/00010694 -196412000-00004
14. Asitok A, Ekpenyong M, Antai S. Multivariate statistics of fertility parameter fluxes in cement-dust-polluted soils in Mfamosing, Nigeria; impact on agriculture. J Microbiol Biotechnol Food Sci. 2019;8(6). (In press).
15. Ng HE, Rag SSA, Wong SH, Tey D, Tan HM. Estimation of fungal growth using the ergosterol assay: A rapid tool in assessing the microbiological status of grains and feeds. Lett Appl Microbiol. 2007;46:113-118.
Available:https://doi.org/10.1111/j.1472-765X.2007.02279.x
16. Ekpenyong MG, Antai SP. Influence of pH on cadmium toxicity to species of Bacillus (02 and 12) during biodegradation of crude oil. Int J Biol Chem. 2007;1:29-37. Available:https://doi.org/10.3923/ijbc.2007. 29.37
17. Asitok AD, Antai SP, Ekpenyong MG. Water soluble fraction of crude oil uncouples protease biosynthesis and activity in hydrocarbonoclastic bacteria; Implications for Natural Attenuation. Int J Sci. 2017;6:5-21.
18. Wu Q, Sun R, Ni M, Yu J, Li Y, Yu C, Dou K, Ren J, Chen J. Identification ovel fungus Trichoderma asperellum GDFS1009 and comprehensive evaluation of its biocontrol efficacy. PloS One. 2017;12:e0178857.
Available:https://doi.org/10.1371/journal.po ne.0179957
Available:https://doi.org/10.1371/journal.po ne.0156485
20. Asitok AD, Ekpenyong MG. Statistical distribution of halotolerant/halophilic biosurfactant-producing yeasts in Qua Iboe estuarine sediments. Int J Sci. 2019;8(5). (In press).
21. Wolinska A, Stepniewska Z. Dehydrogenase activity in the soil environment. In. Canuto RA. (ed.) Dehydrogenases. Rijeka: Intech Publisher; 2012.
Available:https://doi.org/10.5772/48294 22. Salazar S, Sanchez L, Alvarez J, Valverde
A, Galindo P, Igual J, Peix A, Santa-Regina I. Correlation among soil enzyme
activities under different forest system management practices. Ecol Eng. 2011; 37:1123-1131.
Available:https://doi.org/10.1016/j.ecoleng. 2011.02.007
23. Itah AY, Essien JP. Growth profile and hydrocarbonoclastic potential of microorganisms isolated from tarballs in the Bight of Bonny, Nigeria. World J Microbiol Biotechnol. 2005;21:1317-1322. Available:https://doi.org/10.1007/s11274-004-6694-z
24. Tabachnick BG, Fidell LS. Using multivariate statistics. New York: Harper Collins College Publishers; 1996.
_______________________________________________________________________________
© 2019 Asitok and Ekpenyong; This is an Open Access article distributed under the terms of the Creative Commons Attribution License (http://creativecommons.org/licenses/by/4.0), which permits unrestricted use, distribution, and reproduction in any medium, provided the original work is properly cited.
Peer-review history: