Development of a Computer-Aided Application for
Analyzing ECG Signals and Detection of Cardiac
Arrhythmia Using Back Propagation Neural Network -
Part II: GUI Development
Oludare Y. Ogundepo
Information and Computer Technology Unit, Federal University of Petroleum Resources,
Effurun, Nigeria
Department of Electrical and Electronics Engineering, Federal University of Technology,
Akure, Nigeria
Akinlolu A. Ponnle
Department of Electrical and Electronics Engineering, Federal University of Technology,
Akure, Nigeria
ABSTRACT
Electrocardiogram (ECG) is a graphic recording of the electrical activity produced by the heart. We have developed a computer-aided application model for classification of ECG signals for detection of cardiac arrhythmia. The model is based on some existing algorithms in literature which were adapted to suit our application. The developed model involves ECG signal pre-processing, extraction of some morphological features and simulating it with a trained Back Propagation Neural Network (BPNN) object. The application model has been investigated using the database of Massachusetts Institute of Technology Division of Health Science and Technology/Beth Israel Hospital (MIT-BIH). In this paper, in order to make the application (a software tool) user friendly, we present the development of a MATLAB based graphical user interface (GUI) for the application, which then makes it serve fully as a cost-effective computer aided application to analyze ECG signals for detection of cardiac arrhythmia. The performance of the developed application was investigated using the MIT-BIH database. Accuracy of 88.6%, sensitivity of 90%, specificity of 86.6%, and positive predictivity of 90% (based only on the MIT-BIH database used) shows that the developed application can be employed for the detection of heart diseases in patients. Also, the application is easy to use, fast, and gives the result of diagnosis as ‘Normal’ or ‘Abnormal’.
Keywords
electrocardiogram, cardiac arrhythmia, graphical user interface, classification accuracy, positive predictivity, morphology.
1.
INTRODUCTION
An electrocardiogram is a graphic recording of the electrical activity produced by the heart. The heart is a four-chambered pump that provides the driving force for the circulation of blood. It contains two atria for collection of blood and two ventricles for pumping out of blood. The resting or filling phase of a cardiac chamber is called diastole; the contracting or pumping phase is called systole.
A normal ECG pattern consists of P wave, QRS complex, and T wave. The QRS complex, in turn, includes three separate waves: Q, R and S. All these are generated when the cardiac
impulse goes through the ventricles. The P wave as well as the components of the QRS complex corresponds to depolarization waves. The T wave corresponds to the repolarization wave. Therefore in essence, the ECG is composed of waves of depolarization and repolarization. Table 1 shows ECG typical characteristics [1].
Table 1: Typical ECG Characteristics [1] Associat
ed Wave
Durati on (sec)
Amplitu de (mV)
Frequen cy (Hz)
Mechanical Action
P Wave < 0.12 ≤ 0.3 10 Atrial Depolarizati on
QRS Complex
0.08 – 0.12
0.5 - 2 20 - 50 Depolarizati on of Ventricles
T Wave 0.2 0.2 5 Repolarizati
on of Ventricles
MATLAB software by Mathworks, is very useful for detection of heart abnormalities through ECG signal analysis. Most algorithms on ECG signal analysis and detection can be efficiently implemented on the software. According to Ojha and Subashini (2014), “Proper utilization of MATLAB functions, both built-in and user-defined, can lead to works with ECG signals for processing and analysis in real time applications” [2]. MATLAB R2015a documentation provides examples of some process of performing basic peak analysis with an example on how to find peaks Q, R, and S in a noisy ECG signal [3]. MATLAB and LABVIEW can be used together to have more immense effect on ECG signal processing [4]. The two are both useful and handy. It is even possible to utilize the power of both for self diagnosis without having an ECG machine as reported in [5].
Reaz et al. (2011) described an implementation of an economical real time distant fetal electrocardiogram monitoring system with a MATLAB based GUI, using adaptive linear network they developed to extract fetal ECG from composite (maternal and fetal) ECG [6]. Vanage et al., (2012) used FFT, Autoregressive Modeling (AR) and Principal Component Analysis (PCA) for feature extraction, and Feed Forward Multilayer Neural Network (FFMNN) as classifier. MATLAB GUI was used. Highest accuracy of 80.6% was achieved with the PCA [7]. Shaman (2014) developed an ANN based MATLAB GUI for ECG classification and normality detection working with scanned ECG images, thermal ECG print outs and captured ECG images from devices [8]. Jaylaxmi and Raveendra (2014) developed a MATLAB based GUI using Wavelet transform for detection of QRS complex of ECG signal, heart rate and various intervals of ECG signal [9]. Mali et al. (2014) developed a MATLAB based GUI-driven software tool for detection and classification of heartbeats from ECG signals, and calculation of ECG and HRV (heart rate variability) parameters, which can be used in electroporation-based treatments in clinical practice [10].
Al-Ziarjawey and Cankaya (2015) developed a MATLAB based GUI which analyses ECG recordings to get the P, Q, R, S and T points in the signal as well as detect heart rate. The developed software tool was solely for purposes of research and not clinical diagnosis [11]. Priya and Reddy (2015) developed a flexible MATLAB based GUI tool to analyze ECG and detect arrhythmia using Discrete Wavelet Transform, and comparison with normal ECG classify arrhythmia type. No learning phase was involved. It was tested with MIT-BIH and Creighton University arrhythmia databases. They reported accuracy between 77.3% and 86.61%, and that their application can support various types of arrhythmia detection in clinical tests [12].
Nowadays, ECG classification can be done using android phones, making it much easier for doctors [13]; and the use of MATLAB based GUI for storage and processing of the ECG signals offers a low cost method especially for third world developing countries’ medical device industries [14], [15], [16], [17].
A graphical user interface (GUI) is a graphical display in one or more windows containing controls called components that enable a user to perform interactive tasks. The user of the GUI does not have to create a script or type commands at the command line to accomplish the tasks. Unlike coding programs to accomplish tasks, the user of the GUI needs not
to understand the details of how the tasks are performed. GUI components can include menus, toolbars, push buttons, radio buttons, list boxes, and sliders etc. GUI created using MATLAB tools can also perform any type of computation, read and write data files, communicate with other GUIs, and display data as tables or as plots [18], [19].
We have developed a computer application model for detection of cardiac arrhythmia in ECG signal which consists of signal pre-processing, detection of the ECG signal components, feature extraction from the detected QRS complexes, and classification of the beats extracted from QRS complexes using Back Propagation Neural Network (BPNN). The model is based on some existing algorithms in literature which were adapted to suit our application. The model was developed and trained with standard arrhythmia database of MIT-BIH [20] and taking into account the Association for the Advance of Medical Instrumentation (AAMI) standard [21]. In order to make our application user friendly for users and patients, we developed a MATLAB based graphical user interface (GUI) which has as its kernel our developed application model for ECG detection and classification. This then makes it to serve fully as a cost-effective computer aided application to analyze ECG signals for detection of cardiac arrhythmia. The developed application processes each signal and detects the beats as normal or abnormal, with graphical display of result.
2.
MATERIALS AND METHODS
2.1 Overview
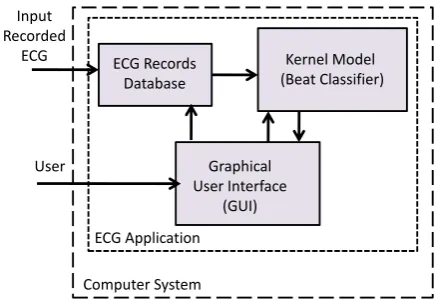
The developed computer-aided application for ECG analysis and arrhythmia detection is as shown in Figure 1. It consists of an ECG records database, the developed kernel model, and a GUI for user inputs and interaction, all of which were developed on MATLAB platform.
Figure 1: The developed computer-aided application for ECG analysis and arrhythmia detection in block diagram
The developed kernel model for the application is divided into the following stages: ECG Signal Pre-processing, Feature Detection, Feature Extraction, and Feature Classification using BPNN. For the signal pre-processing and feature detection, we made use of Pan-Tompkins and Hamilton-Tompkins algorithms [22], [23], and adapted them to suit our application. For the feature classification by BPNN, we adopted MATLAB in-built Levenberg-Marquardt (LM) algorithm [24], [25], [26], and used the MIT-BIH ECG signal records [20] for training. Figure 2 shows the block diagram representation of the developed ECG beat classifier.
ECG Records Database
Kernel Model (Beat Classifier)
Graphical User Interface
(GUI)
ECG Application
Computer System Input
Recorded ECG
Figure 2: Block diagram of the ECG beat classifier
The ECG signal pre-processing stages consist of low pass filtering (to eliminate noise such as the electromagnetic interference and 50Hz power line noise); high pass filtering (to eliminate motion artifacts); differentiation (to give slope information by accentuating QRS complexes relative to P and T wave, and to help overcome baseline wandering); Hilbert transform (to help find the location of R-peaks); squaring (to emphasize higher frequency components and attenuates the lower frequency components which helps to suppress the P and T waves); and moving average (to produce a waveform with smoothed features). A 3-point moving average filter was used. The low pass and high pass filters are cascaded to form a band pass filter. Details of the preprocessing stages and the beat classifier are reported in Part I of this paper.
2.2 AAMI Standard
MIT-BIH heartbeat types are combined according to Association for the Advancement of Medical Instrumentation (AAMI) recommendation. AAMI standard emphasize the problem of classifying ventricular ectopic beats (VEBs) from the non-ventricular ectopic beats. AAMI also recommends that each ECG beat can be classified into the following five heartbeat types:
i. N (Normal beat)
ii. S (Supraventricular Ectopic beats (SVEBs)) iii. V (Ventricular Ectopic beats (VEBs) ) iv. F(Fusion beats)
v. Q (Unclassifiable beats)
Each class includes heartbeats of one or more types. Class N contains normal and bundle branch block beat types and escape beat, class S contains supraventricular ectopic beats (SVEBs), class V contain premature ventricular contraction beats and ventricular escape beat, class F contains beats that result from fusing normal and VEBs, and class Q contains unknown beats including paced beats [27].
In our developed application, we grouped all the five classifications of AAMI heart types into two classifications: Normal ECG and Abnormal ECG.
2.3 The GUI Development
A graphical user interface (GUI) on MATLAB platform was developed for testing the ECG signal for classification under ‘Normal’ or ‘Abnormal’. The database of ECG signals from MIT-BIH was used to evaluate the overall performance of the system application for detection of arrhythmia in a patient. The GUI is desired to contain:
Two figure windows to display the original ECG signal and pre-processed ECG signal.
Static text components for the pre-processing tasks and classification.
Static buttons that enables different kinds of pre-processing tasks.
Push buttons that provide loading of ECG signal from the MIT-BIH database or other ECG database, selection of type of pre-processing task, diagnose the ECG signal, clearing of original and processed ECG signal, and exit from the GUI environment. The application in MATLAB was implemented on an ACER Aspire One system with Intel ® Core Atom ™ CPU N270 @ 1.6GHz, 2GB RAM running MATLAB version 7.12.0 (R2011a) on 32-bit Windows 7 operating system. The application is not stand alone and can only be called and executed in MATLAB environment.
3.
RESULTS AND DISCUSSION
3.1
The Developed Graphical User
Interface
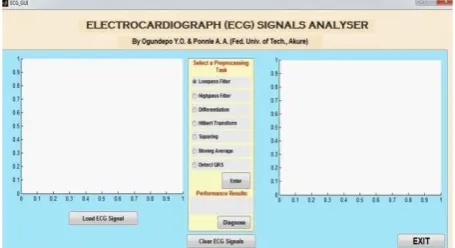
The layout of the MATLAB based developed GUI for the application is shown in Figure 3.
Figure 3: The developed MATLAB based GUI layout for the computer-aided ECG analyser.
The GUI contains:
Two figure windows with axes component. The left window displays the uploaded ECG waveform, while the right window displays the waveform of the processed signal.
A static text component to label the pre-processing tasks and classification panel. This panel also contains a static text component to label the performance result display.
Seven static radio buttons that provide the different kinds of pre-processing tasks.
Five push buttons that provide loading of ECG signal from the database of MIT-BIH formatted ECG records; execution of the selected type of pre-processing task to be carried out on the ECG signal; diagnosing the ECG signal; clearing of both uploaded and processed ECG signal; and exit from the GUI environment.
3.2
ECG Signal Pre-Processing
Some waveforms during pre-processing of a normal ECG signal from MIT-BIH database as displayed by the GUI are shown in Figure 4 and Figure 5.
Pre-processing Components
Detection
Features Extraction
Feature Classifier
BPNN Normal Beats
Abnormal Beats Input ECG
Figure 4: Part of the GUI showing an original ECG signal (MIT-BIH database) and the signal after Hilbert
transformed (already band-passed filtered and differentiated)
Figure 5: Part of the GUI showing the original ECG signal (MIT-BIH database) and the signal after squaring and
moving window operation (This is after band-passed filtered, differentiated, and Hilbert transformed)
3.3
ECG Signal Diagnosis Results
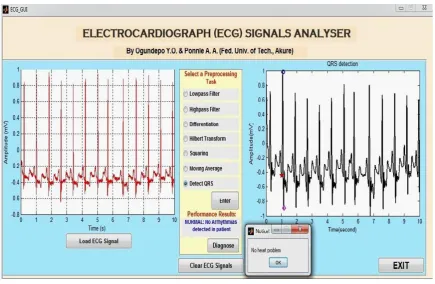
Figure 6 shows the developed GUI for the display, test and diagnosis of an uploaded normal ECG signal from MIT-BIH database, with result of diagnosis indicating no heart problem. QRS detection of the signal is also shown in the GUI.
Figure 6: GUI display of an ECG signal (MIT-BIH database), processed and diagnosed to be Normal
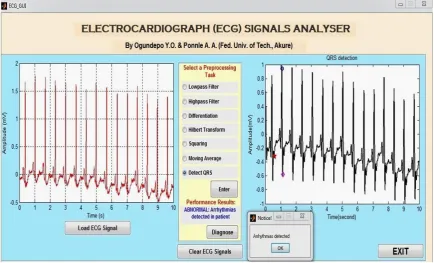
Figure 7 shows the developed GUI for the display, test and diagnosis of another uploaded ECG signal from MIT-BIH database. The figure shows an abnormal, ECG signal under
Figure 7: GUI display of an ECG signal (MIT-BIH database), processed and diagnosed to be Abnormal.
3.4
Operation of the GUI
Upon starting the application from MATLAB, the GUI displays on the computer screen. Clicking on the “Load ECG Signal” push button, the application takes the user to the ECG database folder from which the user selects the record to be displayed. We made the application to accept ECG records that are in MIT-BIH format, so the ECG records in the database must have first been converted to the MIT-BIH format. Having selected the ECG record in the database, the left figure window displays the selected ECG signal in form of a plot, using an in-built specified plot.
To diagnose the signal, the user must carry out all the six pre-processing tasks in the right sequence by clicking the corresponding static radio buttons one after the other, and pressing the “Enter” push button. Failure to undertake the pre-processing tasks in the right sequence will lead to incorrect diagnosis. Also, no pre-processing task must be performed more than once as this will also lead to incorrect diagnosis. The right figure window displays the waveform plot of the effects of each stage of the pre processing on the input ECG signal. Thereafter, the static button for QRS detection is clicked which then puts the application in readiness for diagnosis.
Clicking the “Diagnose” push button enables the application to diagnose the ECG signal either being ‘Normal’ or ‘Abnormal’ with corresponding attendant message and notice. The following messages are displayed depending on the result of diagnosis.
If normal, Notice: “No heart problem”. Performance Result: “NORMAL: No Arrhythmia detected in Patient”.
If abnormal, Notice: “There is Heart Problem!”. Performance Result: “ABNORMAL: Arrhythmia detected in Patient”.
If signal is unrecognizable or too degraded, Notice: “UNKNOWN Signal!”. Performance Result: “UNKNOWN Signal is Unclassifiable”.
Figure 8 shows the application being used on an ACER Aspire One notebook with Intel ® Atom ™ CPU N270 @ 1.6GHz, 2GB RAM running MATLAB version 7.12.0 (R2011a) on 32-bit Windows 7 operating system. The developed GUI displays the test and diagnosis of an abnormal ECG signal from MIT-BIH database with result of diagnosis indicating heart problem. Average time taken to diagnose an MIT-BIH ECG signal after performing all the necessary preprocessing tasks and obtained the QRS complex, was about 2 seconds on the ACER system.
Figure 8: The application being used on an ACER Aspire One notebook
3.5
Performance Evaluation
Accuracy (Acc) measures the overall performance over all classes of beats. It is the ratio of correctly classified patterns to the total number of patterns classified, and is expressed as:
100 FN FP TN TP TN TP Acc(%) (1) Sensitivity (Se) is the ratio of correctly classified event among all correct events, and is expressed as:
100 FN TP TP Se(%) (2) Specificity (Sp) is the ratio of the number of correctly rejected non-events, TN (true negatives), to the total number of nonevents and is expressed as:
100 FP TN TN Sp(%) (3) Positive Predictivity (Pp) is the ratio of the number of correctly detected events, TP, to the total number of events detected. In this application, Pp is the probability that disease is absent when the result of test is ‘Normal’. It is expressed as:
100 FP TP TP Pp(%) (4) where TP is the number of true positives detected (i.e. normal ECG classified as normal); FP is the number of false positives (i.e. abnormal ECG classified as normal); FN is the number of false negatives (i.e. normal ECG classified as abnormal); and TN is the number of true negatives (i.e. abnormal ECG classified as abnormal).
The developed application was tested with the MIT-BIH records and the records that were used are records 100, 101, 102, 103, 104, 105, 106, 107, 108, 109, 111, 112, 113, 114, 115, 116, 117, 118, 119, 121, 122, 123, 124; 215, 217, 220, 221, 222, 223, 228, 230, 231, 232, 233, 234. From the test carried out using the application, TP = 18, TN = 13, FP = 2, and FN = 2.
Therefore for the MIT-BIH data used, 100 2 2 13 14 13 18 (%) Acc = 88.57% 100 2 18 18 (%) Se = 90.0% 100 2 13 13 (%) Sp = 86.67% 100 2 18 18 (%) Pp = 90.00%
So the probability that there is no arrhythmia when the result of diagnosis by the application indicates ‘Normal’ is 90%.
In the course of the test, we noticed that some of the MIT-BIH records exhibit high graded noise and artifacts. Some observations were made in the uploaded waveforms of the original ECG signal of the following records as they were displayed in the left figure window of the GUI:
Record 106 has unusually tall T wave amplitudes.
Record 108 has several baseline drifts and abrupt changes. Also, it has unusually tall peaked P waves uncharacteristic in morphology of typical P waves.
Record 113 has tall sharp T waves.
Record 117 has amplitudes of R peaks and T-wave peaks almost equal. Also, the negative amplitude of the S peaks is relatively too high.
Record 122 has relatively tall P wave amplitudes.
Record 123 has relatively tall T wave amplitudes. Also, the negative amplitude of the S peaks is relatively too high.
Record 220 looks normal in morphology.
Record 223 exhibits sudden changes in QRS amplitudes.
Record 228 looks noisy with over-emphasized T wave amplitudes.
Record 231 looks normal but with relatively high T wave amplitudes, and some missing beats.
Record 232 includes long pauses with high muscle noise.
Table 2 shows the comparison of reported results of some works in literature using MIT-BIH database. The average accuracy indicated is the average value over classes capable of detecting and classifying.
Table 2: Summary of some literature studied using MIT-BIH database
Literature Comment Average Accuracy
Owis et al., (2002) [28] Principal Component Analysis (PCA) and Independent Component Analysis (ICA) with
Minimum Distance Classifier 73%
Nearest Neighbor Classifier 84.4% Bayes Minimum Error Classifier 74% Hadhoud et al., (2006) [29] Fast Fourier Transform (FFT) with Feed forward Multilayer
Neural Network (FFMNN) as classifier
90.6%
Autoregressive Modeling (AR) 85.4%
Principal Component Analysis (PCA) 92.7%
De Chazal and Reilly (2006) [30] Morphology and heartbeat interval with Linear Discriminant (LD) classifier
Jen and Hwang (2008) [31] Cepstrum Coefficient method with ANN for classification 97.5%
Ubeyli (2009) [32] Lyapunov exponents, and Wavelet Coefficients with ANN classifier 93.9%
Oresko et al., (2010) [15] Mobile phone platform with MATLAB 85.5% *
Hermawan et al., (2011) [17] Mobile phone Android 2.2 platform 93.7%
Vanage et al., (2012) [7] Fast Fourier Transform (FFT) with Gradient Descent Back Propagation Neural Network with Adaptive Learning Rate as classifier. MATLAB GUI was developed.
69% *
Autoregressive Modeling (AR) 48.8% *
Principal Component Analysis (PCA) 80.6% *
Das and Ari (2014) [33] Combination of S-Transform (ST) and Wavelet Transform (WT) with temporal features; and classification by Multi Layer Perceptron Neural Network (MLPNN). 44 records of MIT-BIH were used for examination, and 20 records for training.
97.5%
Priya and Reddy (2015) [12] Discrete Wavelet Transform (DWT) and comparison with normal ECG classify arrhythmia type. No learning phase involved. MIT-BIH and Creighton University databases were used. MATLAB GUI was developed.
77.3% - 86.1%
* - Calculated from results in the paper.
Though the accuracy of our developed application lies within the values obtained by others in literature studied, nevertheless, given the MIT-BIH data that were used (35 records for experiments, 12 records for training), the values obtained for the performance indices show that the developed application can be employed for detection of heart diseases in patients from their ECG records. Many of the developed methods in literature do not consistently perform well when classifying ECG waveforms of new patients [33]. As reported by Das and Ari (2014), “The ECG waveforms may differ for the same patient at different time and may be similar for different patients having different types of beats, for this reason, most of the ECG beats classification methods perform well on the training data but provide poor performance on the ECG waveforms of different patients” [33]. Velic et al., (2013) in their analysis of the state of the art of computer aided ECG analysis made it known that “the complexity of ECG curve embarrasses computer programmers in finding the best mathematical model to describe what is exactly happening in cardiac cycle and that is the reason why we still do not have a software solution for ECG analysis which is comparable to clinical decision” [34].
Therefore, using more ECG signal records from MIT-BIH and from other sources for our application, and comparative evaluation with classification by cardiologists would go a long way in further testing the effectiveness of the developed application.
4.
CONCLUSION
The automatic classification of ECG signal helps in recognizing heart problems more accurately with less time. A MATLAB based computer aided application for the detection of cardiac arrhythmia from ECG signals has been developed using the MIT-BIH database. The developed application kernel involves ECG signal preprocessing, extraction of some morphological features, and simulation with a trained BPNN object. The developed GUI also makes it user friendly. The results obtained in terms of accuracy of 88.6%, sensitivity of 90%, specificity of 86.7% and positive predictivity of 90% (based only on MIT-BIH database) shows that the developed application can be employed for the detection of heart diseases in patients once their digital ECG record is available.
This work has provided a computer-aided application (a flexible software tool) which relatively facilitates heart diagnosis at a significant low cost. Though at present, the application is not stand alone, but we believe that with some modifications, coupled with a data acquisition system both for online and offline diagnosis, it can be embedded in medical diagnostic machines and handheld ECG devices or mobile phones at relatively low cost with minimal CP power consumption.
5.
REFERENCES
[1] Upasani D.E and Kharadkar R.D. 2012, Automated ECG Diagnosis, IOSR Journal of Engineering, Vol. 2 (5), pp. 1265-1269.
[2] Ojha D. K., and Subashini M. 2014, Analysis of Electrocardiograph (ECG) Signal for the Detection of Abnormalities Using MATLAB, International Journal of Medical, Health, Biomedical and Pharmaceutical Engineering, Vol. 8, No. 2, WASET, pp. 120-123. [3] MATLAB R2015a Documentation, Peak Analysis,
www.mathworks.com/help/signal/examples/peak-analysis.html
[4] Correia S., Miranda J., Silva L. and Barreto A. 2009, LabVIEW and MATLAB for ECG Acquisition, Filtering and Processing, In Proceedings of 3rd International Conference on Integrity, Reliability and Failure (IFR2009), Porto/Portugal, 20-24 July 2009, paper ref: S0228_A0402.
[5] Islam M.K., Haque N.M.M., Tangim G., Ahammad T., and Khondokar M.R.H. 2012, Study and Analysis of ECG Signal Using MATLAB and LABVIEW as Effective Tools, International Journal of Computer and Electrical Engineering, Vol. 4., No. 3, pp. 404-408. [6] Reaz M.B.I., Amin M.S., Husain H., and Hashim F.H.
2011, An Economic Distant Fetal Electrocardiogram Monitoring System, Scientific Research and Essays, Vol. 6, No. 23, pp. 4975-4983.
Engineering and Management, Vol. 15, Issue 4, pp. 75-80.
[8] Shaman P. 2014, ANN Based GUI for ECG Classification and Normality Detection, International Journal of Advances in Computer Science and Technology, Vol. 3, No. 6, pp. 383-385.
[9] Jaylaxmi C.M. and Raveendra M. 2014, MATLAB Based ECG Signal Classification, International Journal of Science, Engineering and Technology Research (IJSETR), Vol. 3, Issue 7, pp. 1946-1951.
[10] Mali B., Zulj S., Magjarevic R., Miklavcic D., and Jarm T. 2014, MATLAB-based Tool for ECG and HRV Analysis, Biomedical Signal Processing and Control, Elsevier, Vol. 10, pp. 108-116.
[11] Al-Ziarjawey H.A.H. and Cankaya I. 2015, Heart Rate Monitoring and PQRST Detection Based on Graphical User Interface with MATLAB, International Journal of Information and Electronics Engineering, Vol. 5, No. 4, pp. 311-316.
[12] Priya P.K. and Reddy G.U. 2015, MATLAB based GUI for Arrhythmia Detection Using Wavelet Transform, International Journal of Advanced Research in Electrical, Electronics and Instrumentation Engineering, Vol.4, Issue 2, pp. 807-816.
[13] Bawa K., and Sabharwal P. 2014, ECG Signal Fibrillation Classification on Android Platform: A Survey Approach, International Journal of Emerging Science and Engineering (IJESE), Vol. 2, Issue 7, pp. 1-4.
[14] Belgacem N., Assous S., and Bereksi-Reguig F. 2011, Bluetooth Portable Device and MATLAB-based GUI for ECG Signal Acquisition and Analysis, IEEE 7th International Workshop on Systems, Signal Processing and their Applications (WOSSPA), pp. 87-90.
[15] Oresko J.J., Jin Z., Cheng J., Huang S., Sun Y., Duschl H., and Cheng A.C. 2010, A Wearable Smartphone-Based Platform for Real Time Cardiovascular Disease Detection Via Electrocardiogram Processing, IEEE Transactions on Information Technology in Biomedicine, Vol. 14, No. 3, pp. 734-740.
[16] Lin C-T., Chang K-C., Lin C-L., Chiang C-C., Lu S-W., Chang S-S., Lin B-S., Liang H-Y., Chen R-J., Lee Y-T., and Ko L-W. 2010, An Intelligent Telecardiology System Using a Wearable and Wireless ECG to Detect Atrial Fibrillation, IEEE Transactions on Information Technology in Biomedicine, Vol. 14, No. 3, pp. 726-733. [17] Hermawan K., Iskandar A.A., and Hartono R.N. 2011,
Development of ECG Signal Interpretation Software on Android 2.2, IEEE 2nd International Conference on Instrumentation, Communication, Information Technology and Biomedical Engineering (ICICI-BME), 8-9 Nov., 2011, Bandung, Indonesia, pp. 259-264. [18] The Mathworks, MATLAB Graphical User Interface
(GUI), www.mathworks.com/discovery/matlab-gui.html [19] The Mathworks, GUI Building Blocks,
www.mathworks.com/help/matlab/gui-building-basics.html
[20] MIT-BIH Database distribution, Massachusetts Institute of Technology, 77 Massachusetts Avenue, Cambridge,
MA 02139, 1998.
http://www.physionet.org/physiobank/database/mitdb/ [21] Association for the Advancement of Medical
Instrumentation, 1994, American National Standard for Ambulatory Electrocardiographs, Publication ANSI/AAMI EC38-1994.
[22] Pan J. and Tompkins W.J. 1985, A Real Time QRS Detection Algorithm, IEEE Transactions on Biomedical Engineering. BME-32(3), pp. 230-236.
[23] Hamilton P.S. and Tompkins W.J. 1986, Quantitative Investigation of QRS Detection Rules using the MIT/BIH Arrhythmia Database, IEEE Transactions on Biomedical Engineering. BME-33, pp. 1157-1165. [24] Levenberg K. 1944, A Method for the Solution of
Certain Problems in Least Squares, Quarterly of Applied Mathematics, Vol. 2, pp. 164-168.
[25] Marquardt D. 1963, An Algorithm for Least Squares Estimation of Non-linear Parameters, SIAM Journal on Applied Mathematics, Vol. 11(2), pp. 431-441.
[26] Hagan M.T. and Menhaj M. 1994, Training Feed-forward Networks with the Marquardt Algorithm, IEEE Transactions on Neural Networks, Vol. 5, No. 6, pp. 989-993.
[27] Chazal P., Duyer M.O., and Reilly R.B. 2004, Automatic Classification of Heartbeat using ECG Morphology and Heart Beat Interval Features, IEEE Transactions on Biomedical Engineering, Vol. 51, pp. 1196-1206. [28] Owis M.I., Youssef A.B.M., and Kadah Y.M. 2002,
Characteristics of Electrocardiogram Signals based on Blind Source Separation, IEEE Transactions on Medical and Biological Engineering and Computing, Vol. 40, Issue 5, pp. 557-564.
[29] Hadhoud M.M.A., Eladawy M.I., and Farag A. 2006, Computer Aided Diagnosis of Cardiac Arrhythmias, IEEE International Conference on Computer Engineering and Systems, 5-7 Nov., 2006, Cairo, pp. 262-265. [30] De Chazal P. and Reilly R.B. 2006, A Patient-Adapting
Heartbeat Classifier using ECG Morphology and Heartbeat Interval Features, IEEE Transactions on Biomedical Engineering, Vol. 53, No.12, pp. 2535-2543. [31] Jen K. and Hwang Y. 2008, ECG Feature Extraction and
Classification Using Cepstrum and Neural Networks, Journal of Medical and Biological Engineering, Vol. 28, No. 1, pp. 31-37.
[32] Ubeyli E.D. 2009, Statistics over Features of ECG Signals, Expert Systems with Applications, Vol. 36, No. 5, pp. 8758-8767.
[33] Das M.K. and Ari S. 2014, ECG Beats Classification Using Mixture of Features, International Scholarly Research Notices, Vol. 2014, Article ID: 178436, pp. 1-12.
![Table 1: Typical ECG Characteristics [1] Duration (sec)](https://thumb-us.123doks.com/thumbv2/123dok_us/1312127.1638853/1.595.317.548.393.555/table-typical-ecg-characteristics-duration-sec.webp)