Quantitative analysis of research trends in a
leading ecological journal: bibliometric study
during 2003-2012
Saravanan Govindaradjou
1ORCID Id.: https://orcid.org/0000-0001-7040-0622
Dominic John
2ORCID Id.: http://orcid.org/0000-0002-6039-641X
Received: 15 March 2014 Accepted: 22 June 2014
The journal Ecology is one of the premier journals in the field of ecology, published by the Ecological Society of America. Ten volumes of the journal containing 120 issues from 2003 to 2012 have been taken into consideration for the present study that carries out a bibliometric analysis of the 3,359 papers and 164,369 references of this journal. The analysis covers parameters like growth pattern, authorship pattern and author productivity, with most productive countries and institutions. Out of 3,359 contributions, only 410 were single-authored and the rest were multi-authored with a Collaboration Coefficient of 0.21. Applicability of Lotka’s Law has been tested. The most productive institution was the University of California at Davis, with 183 publications. The United States of America topped the list of countries with 2,188 papers, while South Africa occupied eighteenth position.
Keywords: Ecology, bibliometrics, authorship pattern, mapping, VOSviewer, h-index, impact factor, South Africa
1 Introduction
Ecology is the scientific study concerned with the relationship between organisms and their past, present, and future environments. These relationships include the physiological responses of individuals, the structure and dynamics of populations, the interactions among species, the organisation of biological communities, and the processing of energy and matter in ecosystems. Unlike many other disciplines, in ecology the issues are similar across the world, encouraging comparative studies and the participation of an international community of researchers.
Bibliometrics (biblion meaning “book” and metricus meaning “measurement”) is a quantitative method of study concerned primarily with the analysis and description of literature. Its task, immodestly enough, is to provide evolutionary models of science, technology, and scholarship (Egghe 1988: 179). Pritchard (1969: 348) states that bibliometrics deals with the application of mathematics and statistical methods to books and other media of communication. Researchers may use these methods of evaluation to determine the influence of a single writer or to describe the relationship between two or more writers or their works. In the present study, an attempt has been made to study the publication trends in the field of ecology over a ten-year period, by using bibliometric analysis of a leading journal in the domain.
Ecology (ISSN 0012-9658) is a monthly journal published by the Ecological Society of America, Washington DC. Ecology publishes essays and articles that report and interpret the results of original scientific research in basic and applied ecology. The journal publishes a broad array of research in this rapidly-expanding field, covering techniques, approaches, and concepts.
2 Literature review
A considerable number of studies have been carried out to explore individual journal publications and literature on specific subject areas:
Liu, Kong and Duan (2011) analysed twelve Chinese mainstream ecological journals’ publishing index, citation index and internet reach, and grouped the journals. They stressed that the Chinese ecological journals should make up a community – a digital journal aggregation. Prozesky and Boshoff (2012) attempted to analyse gender-related factors in research performance within the field of invasion ecology. Their investigation was based on journals included in the Thomson Reuters Web of Science from 1990 to 2002, focusing on South African science. Narang and Kumar (2010) conducted a bibliometric analysis of 4,798 citations appended to 400 articles in the Indian Journal of Pure and Applied Mathematics from 2003 to 2007. Results indicated a decrease in the number of contributions in successive volumes and that most citations were from journals. Mohamed, Nagarajan and Jothi (2011) discussed authorship trends and
1. Saravanan Govindaradjou is a librarian at the French Institute of Pondicherry, India, and a PhD scholar in the Department of Library and Information Science, Karpagam University, India.
collaborative research in the field of agricultural extension in the Journal of Extension System during the period 2000-2009. The results showed that multi-authored papers outnumbered single-authored papers. Sevukan and Sharma (2008) presented a detailed analysis of research performances of biotechnology faculties in Central Universities of India from 1997 to 2006. The results indicated that twin-authored publications dominated and validated the applicability of Lotka’s Law. However, the application of Bradford’s Law did not fit in to the literature analysed. Thanuskodi and Venkatalakshmi (2010) studied the growth and development of research on ecology in India through Web of Science publications from 1990 to 2006. Their results indicated that 80% of contributions were multi-authored. Aswathy and Gopikuttan (2012) analysed 780 papers from five volumes in the Journal of Spacecraft and Rockets during 2006-2010, finding that, in terms of publications, the United States of America (USA) had the biggest share of papers. India occupied seventh position, with the most contributions coming from its universities.
3 Objectives
The primary objective of this study was to quantify and assess the research performance of the journal Ecology by analysing its publication output during a period of ten years (2003 to 2012) using bibliometric indicators. We also aimed to study the applicability of Lotka’s Law. Other objectives were to explore the h-index, highly cited publications, the impact of cited references and journals, and various collaborative issues over the ten-year period.
4 Method and materials
The data presented in this paper have been retrieved from the Science Citation Index Expanded, accessed via Web of Science, published by Thomson Reuters. The keyword “ecology” has been used as the search term in the field of “publication name” and the time period was limited to 2003 to 2012 (ten years). 3,359 papers from Ecology were retrieved. Microsoft Office Excel and Microsoft Office Word were used to analyse the final data collected in order to generate tables, charts, and graphs.
5 Data analysis and interpretation
In this paper, various statistical techniques are used for our analysis.
A total of 3,359 papers were included in five document types during the ten-year study period, comprising 3,119 (92.86%) articles and 147 (4.38%) editorial pieces. Less significant, were fifty reviews (1.49%), forty-two corrections (1.25%) and one reprint (0.03%).
5.1 Growth of Ecology literature from 2003 to 2012
During the period 2003-2012, the journal Ecology published 3,359 publications with an average of 279.92 publications per year. Fluctuations in publication patterns of ecology literature were noticed throughout the period of study. However, the highest number of publications was recorded in 2010 (387 papers; 11.52% of total publications in the ten-year period) while the lowest was in the year 2011 (240 papers; 7.14% of total publications in this period).
5.2 Relative Growth Rate and Doubling Time of Publications
Relative Growth Rate is the increase in the number of publications / pages per unit of time. The growth rate of total publications in Ecology has been calculated on the basis of Relative Growth Rate (RGR) and Doubling Time (DT) model developed by Mahapatra (1985). Mathematical representation of the mean Relative Growth Rate of articles over a specific period is derived by the following formula:
Here R(P) = Relative Growth Rate of articles over the specific period of time. Loge1P = Log of initial number of articles.
Loge2P = Log of final number of articles.
2 T-1 T = The unit difference between the initial time and final times.
There exists a direct relationship between the Relative Growth Rate and Doubling Time. If the number of publications / pages of subject doubles during a given period, then the difference between the logarithms of the numbers at the beginning and at the end of the period must be the logarithms of the number 2. If one uses natural logarithms, this difference has the value of 0.693. Thus, the corresponding Doubling Time for publications and pages can be calculated by the following formula:
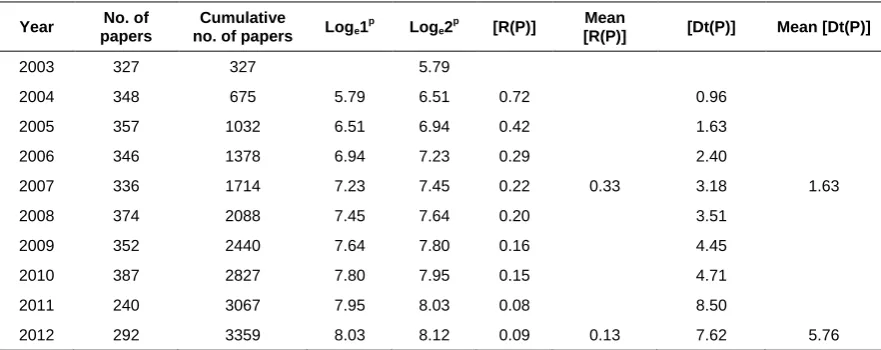
Here, DT(p) and DT(c) are the average Doubling Time for articles and citations respectively. The RGR and DT are used to express the nature of growth of knowledge. The Relative Growth Rate and Doubling Time of publications were derived and are presented in Table 1. It can be noticed that the Relative Growth Rate of publications decreased from 0.72 in 2004 to 0.09 in 2012. The mean relative growth for the first four years (2004 to 2007) was higher than during the last five years (2008 to 2012).
Table 1 Relative Growth Rate and Doubling Time of Ecology during 2003 to 2012
Year No. of papers
Cumulative
no. of papers Loge1 p
Loge2 p
[R(P)] Mean
[R(P)] [Dt(P)] Mean [Dt(P)]
2003 327 327 5.79
2004 348 675 5.79 6.51 0.72 0.96
2005 357 1032 6.51 6.94 0.42 1.63
2006 346 1378 6.94 7.23 0.29 2.40
2007 336 1714 7.23 7.45 0.22 0.33 3.18 1.63
2008 374 2088 7.45 7.64 0.20 3.51
2009 352 2440 7.64 7.80 0.16 4.45
2010 387 2827 7.80 7.95 0.15 4.71
2011 240 3067 7.95 8.03 0.08 8.50
2012 292 3359 8.03 8.12 0.09 0.13 7.62 5.76
At the same time, the corresponding Doubling Time for different years gradually increased from 2004 to 2012. The mean Doubling Time for the first four years (i.e. 2004 to 2007) was only 1.63 which increased to 7.62 during the last five years (2008 to 2012). As the rate of growth of publication decreased, the corresponding Doubling Time increased. It could be deduced that in general there is a progressive increase in the number of publications for the study period. However, the Relative Growth Rate shows a downward trend which means the rate of increase is proportionately low, and this is highlighted by the Doubling Time for publications, which is higher than the Relative Growth Rate.
The mean relative growth of ecology literature has shown a declining trend. Consequently, mean Doubling Time has increased. These trends may be due to the communication pattern of ecologists. Many ecological communications may not appear in the form of journal articles, the primary source of materials for the abstracting journals.
5.3 Authorship pattern and Collaborative Coefficient
It can be seen in Table 2 that most of the papers investigated were multi-authored (87%).
Table 2 Distribution of Authorship pattern in Ecology during 2003 to 2012
Year
No. of Authors
Total Collaborative Coefficient Single Two Multi
(3-6)
Mega (More than 7)
2003 62 108 146 12 328 0.14
2004 60 116 163 9 348 0.16
2005 38 112 191 16 357 0.24
2006 44 104 178 20 346 0.21
2007 50 91 168 26 335 0.18
2008 45 94 200 35 374 0.21
2009 30 95 198 29 352 0.26
2010 50 102 201 34 387 0.20
2011 12 49 157 22 240 0.30
2012 19 66 181 26 292 0.28
Total 410 937 1783 229 3359 0.21
Percentage 12.21 27.90 53.08 6.82 100
CC
,
where fj is the number of j-author papers published in a discipline during a certain period of time; N is the total number of papers published in a discipline during a certain period of time; and j is the greatest number of authors per paper in a discipline. Based on the data presented in Table 2, the Collaborative Coefficient (CC) was calculated .The calculated value of CC for the study period does not vary much over the years. The value of CC is lowest (0.14) for 2003 and highest (0.30) for 2012. The CC usually will be between 0 and 1; if it is near 1, it is assumed that the collaboration is high and if it is near 0 it indicates less collaboration. This again indicates that the researchers in the field of ecology during the study period have been fairly collaborative.
5.4 Author productivity
Lotka’s Law (Lotka 1926) is one of the three classic laws of bibliometrics and deals with the frequency of publication by authors in any given field. The generalised form of Lotka’s Law can be expressed as
k
y
x
n
where y is the number of authors with x articles, the exponent n and constant k are parameters to be estimated from a given set of author productivity data.
The value of exponent n is calculated by the least-squares method described by Pao (1985) using the following formula:
2 2
)
ln
(
)
(ln
ln
)
(
ln
)
(
ln
.
(ln
x
x
N
x
x
g
x
g
x
N
n
, where N=10 (i.e. n = 2.23)N = number of pairs of data
X = logarithm of x, i.e. number of articles Y = logarithm of y, i.e. number of authors
The value of k, which is the theoretical number of authors with a single article, is determined from the following formula: 1 2 1 1 1
1
(
1
)(
)
24
(
1
)
1
1
1
n np x n
p
n
pn
p
n
x
k
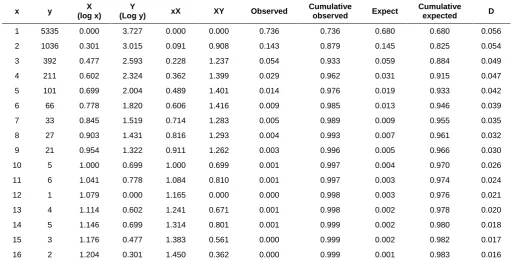
Table 3 Application of Lotka’s Law in Ecology during 2003 to 2012
x y X
(log x)
Y
(Log y) xX XY Observed
Cumulative
observed Expect
Cumulative expected D
1 5335 0.000 3.727 0.000 0.000 0.736 0.736 0.680 0.680 0.056
2 1036 0.301 3.015 0.091 0.908 0.143 0.879 0.145 0.825 0.054
3 392 0.477 2.593 0.228 1.237 0.054 0.933 0.059 0.884 0.049
4 211 0.602 2.324 0.362 1.399 0.029 0.962 0.031 0.915 0.047
5 101 0.699 2.004 0.489 1.401 0.014 0.976 0.019 0.933 0.042
6 66 0.778 1.820 0.606 1.416 0.009 0.985 0.013 0.946 0.039
7 33 0.845 1.519 0.714 1.283 0.005 0.989 0.009 0.955 0.035
8 27 0.903 1.431 0.816 1.293 0.004 0.993 0.007 0.961 0.032
9 21 0.954 1.322 0.911 1.262 0.003 0.996 0.005 0.966 0.030
10 5 1.000 0.699 1.000 0.699 0.001 0.997 0.004 0.970 0.026
11 6 1.041 0.778 1.084 0.810 0.001 0.997 0.003 0.974 0.024
12 1 1.079 0.000 1.165 0.000 0.000 0.998 0.003 0.976 0.021
13 4 1.114 0.602 1.241 0.671 0.001 0.998 0.002 0.978 0.020
14 5 1.146 0.699 1.314 0.801 0.001 0.999 0.002 0.980 0.018
15 3 1.176 0.477 1.383 0.561 0.000 0.999 0.002 0.982 0.017
17 2 1.230 0.301 1.514 0.370 0.000 1.000 0.001 0.985 0.015
20 1 1.301 0.000 1.693 0.000 0.000 1.000 0.001 0.985 0.014
23 1 1.362 0.000 1.854 0.000 0.000 1.000 0.001 0.986 0.014
Total 7252 17.214 23.613 17.913 14.474 Max D 0.056
The productivity of the paper contribution of the journal Ecology was verified to be in conformity with Lotka’s inverse square law using Pao’s method, to know the values of n and C.
Here n is substituted with the value 2.23 and k is calculated as 0.68 using the equation, while p is assumed to be 20. By replacing the values of n and k, the difference is calculated (Table 3). Here D is the minimum and hence the present data set is in conformity with Lotka’s Law. From the table it is clear that the maximum absolute difference value Dmax which represents the maximum deviation is identified as 0.056. The table value or critical value of D in the Kolmogrov-Smirnov (K-S) test at 0.05 level of significance is 0.016. While the calculated value of D, 0.056, is less compared to the table value 0.019, it is clear that the calculated value of D falls within the critical value of D. Thus, the distribution of author productivity of the present data set confirms Lotka’s Law.
5.5 Prolific authors in Ecology
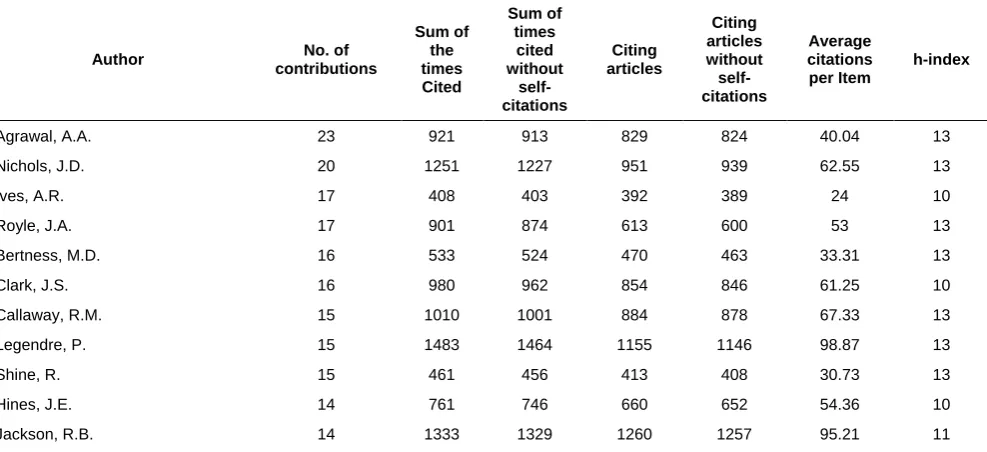
Table 4 lists the most productive authors in the overall field of ecology and their h-index values while Table 4a depicts prolific authors who have produced more than 13 papers in the journal Ecology during the period of study. Their h-index values are also listed.
Table 4a Most productive authors in the journal Ecology during 2003-2012
Author No. of
contributions Sum of the times Cited Sum of times cited without self-citations Citing articles Citing articles without self-citations Average citations per Item h-index
Agrawal, A.A. 23 921 913 829 824 40.04 13
Nichols, J.D. 20 1251 1227 951 939 62.55 13
Ives, A.R. 17 408 403 392 389 24 10
Royle, J.A. 17 901 874 613 600 53 13
Bertness, M.D. 16 533 524 470 463 33.31 13
Clark, J.S. 16 980 962 854 846 61.25 10
Callaway, R.M. 15 1010 1001 884 878 67.33 13
Legendre, P. 15 1483 1464 1155 1146 98.87 13
Shine, R. 15 461 456 413 408 30.73 13
Hines, J.E. 14 761 746 660 652 54.36 10
Jackson, R.B. 14 1333 1329 1260 1257 95.21 11
Table 4 Top Ten authors in the field of ecology
Author No. of
contributions
Sum of the times Cited
Sum of Times Cited without self-citations Citing Articles Citing articles without self-citations Average citations per Item h-index
Shine, R. 178 4581 4077 2813 2667 25.74 37
Luiselli, L. 113 1226 895 725 626 10.85 19
Poulin, R. 101 2679 2433 1700 1620 26.52 30
Baskin, C.C. 100 1474 1285 1041 971 14.74 21
Baskin, J.M. 98 1445 1258 1018 948 14.74 21
Macdonald, D.W. 92 2791 2687 2345 2294 30.34 29
Gaston, K.J. 85 3674 3563 3044 2990 43.22 36
Hobson, K.A. 85 3641 3479 2502 2442 42.84 31
Stenseth, N.C. 82 3951 3852 3231 3187 48.18 30
Reich, P.B. 14 567 566 549 548 40.5 9
Trussell, G.C. 14 518 495 415 406 37 10
Wright, S.J. 14 797 780 660 651 56.93 12
The h-index is an index that quantifies both the actual scientific productivity and the apparent scientific impact of a scientist. The index is based on the set of most-cited papers of a scientist and the number of citations that such a set of papers has received in other publications. Hirsch (2005) postulates that
A scientist has an index h if h of his or her Np papers has at least h citations each and the other (Np – h) papers have less than h citations each. The value of h is equal to the number of papers (N) in the list that have N or more citations.
To identify the h-index values of the prominent authors, we used the ‘‘create citation report’’ tool of the Web of Knowledge database. The information relating to the ‘‘sum of the times cited’’, “sum of times cited without self-citations”, “citing articles”, “citing articles without self-citations”, ‘‘average citations per item’’, and ‘‘h-index’’ were noted down.
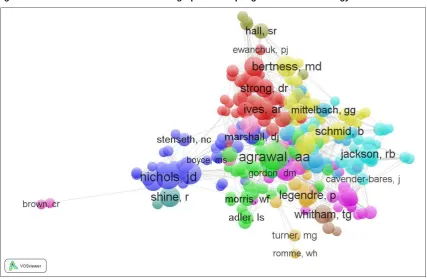
VOSviewer is primarily intended to be used for analysing bibliometric networks. The program can, for instance, be used to create maps of publications, authors, or journals based on a co-citation network and also to create maps of keywords based on a co-occurrence network. VOSviewer (version 1.5.4) (http://www.vosviewer.com/), a freely available computer program is used for constructing distance-based maps based on co-occurrence data. VOSviewer has been written in the Java programming language and runs on most hardware and operating system platforms (van Eck and Waltman 2010).
Figure 1 Label view of VOSviewer of bibliographical coupling of authors in Ecology
For the study period, we employed VOSviewer to analyse the publications in the journal (Figure 1). With the fractional counting method, documents with more than five authors were selected. Of the 7,253 authors, 278 met the threshold. For each of the 278 authors, the number of bibliographic coupling links was calculated. The authors with the largest number of links (277 items) were connected in fourteen clusters with different colours. In the label view, 277 items are indicated both by their label and by a circle. For each item, the font size of the item’s label and the size of the item’s circle vary depending on the weight of the item. If items have been assigned to clusters, the colour of the circle of an item can be determined by the cluster to which the item belongs. This clearly shows the most prolific authors, among them A.A. Agrawal, J.D. Nichols, and A.R. Ives.
5.6 Organisation-wise distribution
is presented in Table 5. Of the top fifteen most productive institutions, fourteen are in the USA and one in Canada. Universities remain the dominant contributors in Ecology.
Table 5 Organisation-wise distribution of Ecology, 2003-2012 (first 15 countries)
Organisations Country No. of Papers % of 3359
University Calif Davis USA 182 5.41
University Calif Santa Barbara USA 103 3.06
University Calif Berkeley USA 92 3.06
US Geol Survey USA 92 2.73
Duke University USA 92 2.73
University Wisconsin USA 83 2.47
University Florida USA 77 2.29
Colorado State University USA 76 2.26
Cornell University USA 76 2.26
University Minnesota USA 75 2.23
University Washington USA 71 2.11
Oregon State University USA 69 2.05
University British Columbia Canada 60 1.78
University Montana USA 59 1.75
University Calif Santa Cruz USA 58 1.72
VOSviewer constructs a map based on a co-occurrence matrix. The construction of a map is a process that consists of three steps. In the first step, a similarity matrix is calculated based on the co-occurrence matrix. In the second step, a map is constructed by applying the VOS mapping technique to the similarity matrix. And finally, in the third step, the map is translated, rotated, and reflected (van Eck and Waltman 2010).
The output file from VOSviewer (Figure 2) is a map based on a network of bibliographic couplings according to organisation With the fractional counting method, more than five documents of organisations were selected. Of the 1,483 organisations, 314 items met the threshold. For each of the 314 organisations, the number of bibliographic coupling links was calculated. The organisations with the largest number of links (314 items) were connected in thirteen clusters with colours (blue, green and red). These clusters are collaboration clusters in terms of the number of publications produced jointly. In the label view, 314 items are indicated by a label and by a circle. In the figure, different colour-coded regions show different clusters. Colours indicate the clusters to which an organisation is assigned. The thirteen clusters correspond to 314 organisations which produced more than five documents in the research period. Table 6 shows the details of the thirteen collaboration clusters and the colour coding details.
Table 6 Collaboration clusters in organisation
Cluster Cluster Colours
No. of Items (No. of
organisations) No. of documents Cluster top most organisation
1 55 629 CNRS
2 38 603 University of British Columbia
3 37 706 University of Calif Davis
4 35 767 US Geological Survey
5 31 474 Yale University
6 22 352 University of Illinois
7 18 250 University of Wisconsin
8 17 339 Cornell University
9 15 380 University of Florida
10 13 375 Duke University
11 12 229 University Calif Santa Cruz
12 11 116 Lund University
13 10 185 University Toronto
VOS mapping technique is to minimise a weighted sum of the squared Euclidean distances between all pairs of items. The higher the similarity between two items, the higher the weight of their squared distance in the summation. The distance based measurement stratifies different clusters here based on the publication number occurring as a pair. The map clearly depicts the most prolific organisations.
5.7 Geographical distribution of contributors
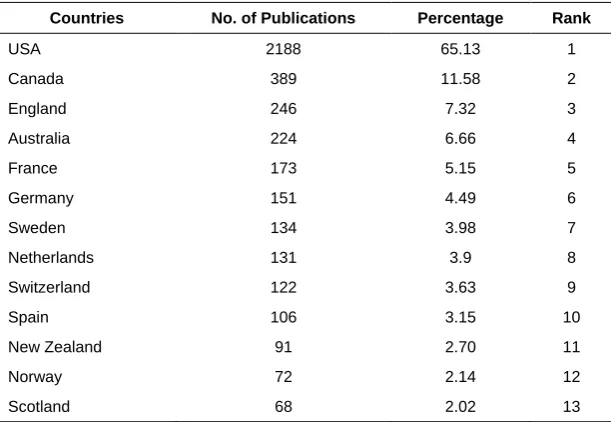
Country-wise distribution of the authors (Table 7) indicates that most of the papers were contributed by USA, followed by Canada and England. Being the originating country, and host to more scientific institutions, it is not surprising that the USA was the top contributing country.
Table 7 Country-wise distribution of Ecology during 2003-2012
Countries No. of Publications Percentage Rank
USA 2188 65.13 1
Canada 389 11.58 2
England 246 7.32 3
Australia 224 6.66 4
France 173 5.15 5
Germany 151 4.49 6
Sweden 134 3.98 7
Netherlands 131 3.9 8
Switzerland 122 3.63 9
Spain 106 3.15 10
New Zealand 91 2.70 11
Norway 72 2.14 12
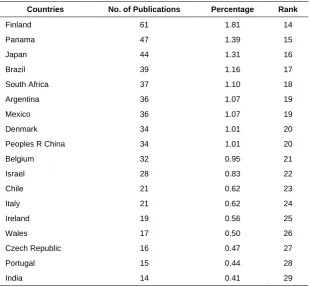
Table 7 Country-wise distribution of Ecology during 2003-2012
Countries No. of Publications Percentage Rank
Finland 61 1.81 14
Panama 47 1.39 15
Japan 44 1.31 16
Brazil 39 1.16 17
South Africa 37 1.10 18
Argentina 36 1.07 19
Mexico 36 1.07 19
Denmark 34 1.01 20
Peoples R China 34 1.01 20
Belgium 32 0.95 21
Israel 28 0.83 22
Chile 21 0.62 23
Italy 21 0.62 24
Ireland 19 0.56 25
Wales 17 0.50 26
Czech Republic 16 0.47 27
Portugal 15 0.44 28
India 14 0.41 29
5.8 Most highly cited papers of journal Ecology in 2003
The bibliographic details of highly-cited papers for the year of commencement of the study, 2003, for Ecology are listed in Appendix 1. Fourteen of the most cited papers of 2003 originated from the USA (seven), followed by Canada (three), New Zealand (two), Sweden (one) and South Africa (one). The highest cited papers from South Africa for the study period are provided in Appendix 2.
5.9 Growth of cited references in the journal Ecology
Citations and references are the backbone of any article. Supporting the content of a manuscript with proper references plays an important role in its reliability. The annual distribution of cited references (Table 8) reveals that the highest cited references were in the year 2010, followed by 2008, while the lowest were in the year 2011.
Table 8 Distribution of cited references and Impact Factors in journal Ecology, 2003-2012
Year No of Articles
No of Cited References
Cumulative
No. of Cited References %
Impact Factor
2003 327 17338 17338 10.55 *
2004 348 17013 34351 10.35 4.104
2005 357 16687 51038 10.15 4.506
2006 346 16986 68024 10.33 4.782
2007 336 15747 83771 9.58 4.822
2008 374 18750 102521 11.41 4.874
2009 352 17382 119903 10.57 4.411
2010 387 18881 138784 11.49 5.073
2011 240 10577 149361 6.43 4.849
2012 292 15008 164369 9.13 5.175
Total 3359 164369 100
* 2003 IF was not available in Web of Science
journal in the previous year to the citable items published in the two years prior, divided by citable items published in the two prior years (Garfield 1976). For example, the IF calculation for the journal Ecology in 2012 is given below:
Cites in 2012 to articles published in 2011 928 Cites in 2012 to articles published in 2010 2110
Sum 3038 Cites to recent articles
Number of articles published in 2011 230 Number of articles published in 2010 357
Sum 587 Number of recent articles
Calculation Cites to recent articles = 3038
Number of recent articles = 587
2012 IF for the journal Ecology 5.175
The IF for the study period was sourced from Web of Knowledge in the Journal Citation Reports (JCR) from 2004 to 2012 (Table 8).
6 Results and discussion
The total number of articles published in Ecology available in Web of Science was 3,359 for 2003-2012. The majority of papers appeared in the year 2010 (387 papers). The h-index of the most prolific author, A.A. Agrawal, with 22 papers, was found to be thirteen. The authorship pattern showed that most papers were multiple-authored (three to six authors) (1,783 papers, 53.08). This number may be compared to single-author papers (410 papers, 12.21%). In the distribution of articles according to country, the USA occupies the first place with 2,188 articles (65.13%). The University of California at Davis contributed the most, ranking first according to institution, with 182 papers (5.41%).
Though this study considered only one journal in the vast field of ecology for bibliometric studies, the journal Ecology is recognised as a leading journal, given its high impact factor and popularity. It can be argued that the patterns discerned from this study therefore might well be reflective of the emerging trends in the discipline of ecology. It will be interesting to classify the broad issues addressed in the journal and study their trends over a period of time.
7 Conclusion
The present work has taken up a detailed analysis of the journal Ecology over a ten-year period (2003-2012). The work provides a reasonable glimpse of the field of ecology, using a reputed journal indicating the direction in which the discipline is going. It is heartening to note that in this scientific discipline, researchers from across the world have shown a strong inclination towards collaborative research which is significant in the present-day context. It will be interesting to replicate this work in a few years from now to observe the changes in the discipline.
References
Ajiferuke, I., Burrel, Q. and Tague, J. 1988. Collaborative coefficient: a single measure of the degrees of collaboration in research. Scientometrics, 14(5-6): 421-433.
Aswathy, S. and Gopikuttan, A. 2012. Journal of Spacecraft and Rockets: a Scientometric analsyis. SRELS Journal of Information Management, 49: 671-682.
Egghe, L. 1988. Methodological aspects of bibliometrics. Library science with a slant to documentation and information studies, 25(3): 179-191.
Mohamed, E.S., Nagarajan, M., and Jothi, S. 2011. Authorship trend and collaborative research in agricultural extension. Pearl: a Journal of Library and Information Science, 5(1): 42-46.
Garfield, E. 1976. Characteristics of highly cited publications in the engineering sciences. Current Contents, 12: 5-10. Hirsch, J.E. 2005. An index to quantify an individual’s scientific research output. Proceedings of the National Academy of
Sciences of the United States of America, 102 (46): 16569-16572.
Liu, T., Kong, H. and Duan, J. 2011. The analysis of Chinese ecological academic journals. Acta Ecologica Sinica, 31(10): 2924-2931.
Lotka, A.J. 1926. The frequency distribution of scientific productivity. Journal of the Washington Academy of Science, 16: 317-323.
Mahapatra, M. 1985. On the validity of the theory of exponential growth of scientific literature. 15th IASLIC conference proceedings. Bangalore: IASLIC, 61-70.
Narang, A. and Kumar, A. 2010. A bibliometric study of Indian Journal of Pure and Applied Mathematics. SRELS Journal of Information Management, 47(1): 31-39.
Pritchard, A. 1969. Statistical bibliography or bibliometics? Journal of Documentation, 25: 348-349.
Prozesky, H. and Boshoff, N. 2012. Bibliometrics as a tool for measuring gender-specific research performance: an example from South African invasion ecology. Scientometrics, 90(2): 383-406.
Sevukan, R. and Sharma, J. 2008. Bibliometric analysis of research output of biotechnology faculties in some Indian central universities. DECIDOC Journal of Library and Information studies, 28(6): 11-20.
Thanuskodi, S. and Venkatalakshmi, V. 2010. The growth and development of research on ecology in India: a bibliometric study. Library Philosophy and Practice (e-journal). Paper 359. [Online]. http://digitalcommons.unl.edu/libphilprac/359. van Eck, N. J., and Waltman, L. 2010. Software survey: VOSviewer, a computer program for bibliometric mapping.
Scientometrics, 84(2): 523-538.
Appendix 1
Bibliographic details of highly cited papers in the journal Ecology for the year 2003
S. NO. Title/Source (Ecology) from WoS in 2003
Times Cited (WoS)
Country of origin of first author
1 Energy, water, and broad-scale geographic patterns of species richness. By Hawkins, BA; Field, R; Cornell, HV; et al. Volume: 84 (12): 3105-3117
730 USA
2 A review of trait-mediated indirect interactions in ecological communities. By Werner, EE; Peacor, SD. Volume: 84 (5): 1083-1100
604 USA
3 Confronting multicollinearity in ecological multiple regression. By Graham, MH. Volume: 84 (11): 2809-2815
550 USA
4 Canonical analysis of principal coordinates: A useful method of constrained ordination for ecology. By Anderson, MJ; Willis, TJ. Volume: 84 (2): 511-525
508 New Zealand
5 Propagule dispersal in marine and terrestrial environments: A community perspective. By Kinlan, BP; Gaines, SD. Volume: 84 (8): 2007-2020
403 USA
6 Estimating site occupancy, colonization, and local extinction when a species is detected imperfectly. By MacKenzie, DI; Nichols, JD; Hines, JE; et al. Volume: 84 (8): 2200-2207
401 New Zealand
7 Variation in plant response to native and exotic arbuscular mycorrhizal fungi. By Klironomos, JN. Volume: 84 (9): 2292-2301
360 Canada
8 Estimating abundance from repeated presence-absence data or point counts. By Royle, JA; Nichols, JD. Volume: 84 (3): 777-790
288 USA
9 Community and ecosystem genetics: A consequence of the extended phenotype. By Whitham, TG; Young, WP; Martinsen, GD; et al. Volume: 84 (3): 559-573
286 USA
10 Herbivore-mediated linkages between aboveground and belowground communities. By Bardgett, RD; Wardle, DA. Volume: 84 (9): 2258-2268
281 Sweden
11 Plant diversity, soil microbial communities, and ecosystem function: Are there any links? By Zak, DR; Holmes, WE; White, DC; et al. Volume: 84 (8): 2042-2050
246 USA
12 Meta-analysis of cod-shrimp interactions reveals top-down control in oceanic food webs. By Worm, B; Myers, RA. Volume: 84 (1): 162-173
240 Canada
13 Piecewise regression: A tool for identifying ecological thresholds. By Toms, JD; Lesperance, ML. Volume: 84(8): 2034-2041
230 Canada
14 Effects of fire and herbivory on the stability of savanna ecosystems. By van Langevelde, F; van de Vijver, CADM; Kumar, L; et al. Volume: 84 (2): 337-350
Appendix 2
South African contributions to journal Ecology, 2003-2012
S.NO. Title/Source
Times Cited (WoS)
1 Effects of fire and herbivory on the stability of savanna ecosystems. By: van Langevelde, F; van de Vijver, CADM; Kumar, L; et al. Ecology, 84 (2): 337-350, Feb. 2003
217
2 Pollination success in a deceptive orchid is enhanced by co-occurring rewarding magnet plants. By: Johnson, SD; Peter, CI; Nilsson, LA; et al. Ecology, 84 (11): 2919-2927, Nov. 2003
125
3 Interactions between environment, species traits, and human uses describe patterns of plant invasions. By: Thuiller, Wilfried; Richardson, David M.; Rouget, Mathieu; et al. Ecology, 87 (7): 1755-1769, Jul. 2006
111
4 Effects of four decades of fire manipulation on woody vegetation structure in savanna By: Higgins, Steven I.; Bond, William J.; February, Edmund C.; et al. Ecology, 88 (5): 1119-1125, May 2007
110
5 Habitat loss, trophic collapse, and the decline of ecosystem services By: Dobson, Andrew; Lodge, David; Alder, Jackie; et al. Ecology. 87 (8):1915-1924, Aug. 2006
102
6 Relating plant traits and species distributions along bioclimatic gradients for 88 Leucadendron taxa By: Thuiller, W; Lavorel, S; Midgley, G; et al. Ecology, 85 (6): 1688-1699, Jun. 2004
91
7 Surface-water constraints on herbivore foraging in the Kruger National Park, South Africa By: Redfern, JV; Grant, R; Biggs, H; et al. Ecology, 84 (8): 2092-2107, Aug. 2003
91
8 Microbial nitrogen limitation increases decomposition By: Craine, Joseph M.; Morrow, Carl; Fierer, Noah. Ecology, 88 (8): 2105-2113, Aug. 2007
85
9 Dark, bitter-tasting nectar functions as a filter of flower visitors in a bird-pollinated plant By: Johnson, Steven D.; Hargreaves, Anna L.; Brown, Mark. Ecology, 87 (11): 2709-2716, Nov. 2006
83
10 Phenotypic variation of larks along an aridity gradient: Are desert birds more flexible? By: Tieleman, BI; Williams, JB; Buschur, ME; et al. Ecology, 84 (7): 1800-1815, Jul. 2003
65
11 Collapse of a pollination web in small conservation areas By: Pauw, Anton. Ecology, 88 (7): 1759-1769, Jul. 2007
57
12 Environmental constraints on a global relationship among leaf and root traits of grasses By: Craine, JM; Lee, WG; Bond, WJ; et al. Ecology, 86 (1): 12-19, Jan. 2005
50
13 Mimics and magnets: The importance of color and ecological facilitation in floral deception By: Peter, Craig I.; Johnson, Steven D. Ecology, 89 (6):1583-1595, Jun. 2008
37
14 Shifting prey selection generates contrasting herbivore dynamics within a large-mammal predator-prey web By: Owen-Smith, Norman; Mills, M. G. L. Ecology, 89 (4): 1120-1133, Apr. 2008
36
15 Community convergence in disturbed subtropical dune forests By: Wassenaar, TD; van Aarde, RJ; Pimm, SL; et al. Ecology, 86 (3): 655-666, Mar. 2005
32
16 Tree cover in sub-Saharan Africa: Rainfall and fire constrain forest and savanna as alternative stable states By: Staver, A. Carla; Archibald, Sally; Levin, Simon. Ecology, 92 (5): 1063-1072, May 2011
30
17 A mutualism with a native membracid facilitates pollinator displacement by Argentine ants By: Lach, Lori. Ecology, 88 (8): 1994-2004, Aug. 2007 Published: AUG 2007
30
18 Photosynthesis and sink activity of wasp-induced galls in Acacia pycnantha
By: Dorchin, Netta; Cramer, Michael D.; Hoffmann, John H. Ecology, 87 (7): 1781-1791, Jul. 2006 24
19 Hidden effects of chronic tuberculosis in African buffalo By: Jolles, AE; Cooper, DV; Levin, SA.
Ecology, 86 (9): 2358-2364, Sep. 2005
23
20 Spatial autocorrelation and the scaling of species-environment relationships
By: de Knegt, H. J.; van Langevelde, F.; Coughenour, M. B.; et al. Ecology, 91 (8): 2455-2465, Aug. 2010
21
21 Minimizing predation risk in a landscape of multiple predators: effects on the spatial distribution of African ungulates By: Thaker, Maria; Vanak, Abi T.; Owen, Cailey R.; et al. Ecology, 92 (2): 398-407, Feb. 2011
22 Likelihood ridges and multimodality in population growth rate models. By: Polansky, Leo; de Valpine, Perry; Lloyd-Smith, James O.; et al. Ecology, 90 (8): 2313-2320, Aug. 2009
18
23 Does the self-similar species distribution model lead to unrealistic predictions? By: Hui, Cang; McGeoch, Melodie A. Ecology, 89 (10): 2946-2952, Oct. 2008
15
24 From moonlight to movement and synchronized randomness: Fourier and wavelet analyses of animal location time series data By: Polansky, Leo; Wittemyer, George; Cross, Paul C.; et al.
Ecology, 91 (5): 1506-1518, May 2010
14
25 Thermal benefits of melanism in cordylid lizards: a theoretical and field test. By: Clusella-Trullas, Susana; van Wyk, Johannes H.; Spotila, James R.. Ecology, 90 (8): 2297-2312, Aug. 2009
13
26 Bioengineers and their associated fauna respond differently to the effects of biogeography and upwelling By: Cole, Victoria J.; McQuaid, Christopher D. Ecology, 91 (12): 3549-3562, Dec. 2010
12
27 Salt marsh ecosystem biogeochemical responses to nutrient enrichment: a paired N-15 tracer study By: Drake, D. C.; Peterson, Bruce J.; Galvan, Kari A.; et al. Ecology, 90 (9): 2535-2546, Sep. 2009
12
28 Methods for assessing movement path recursion with application to African buffalo in South Africa By: Bar-David, Shirli; Bar-David, Israel; Cross, Paul C.; et al. Ecology, 90 (9): 2467-2479, Sep. 2009
11
29 Do novel genotypes drive the success of an invasive bark beetle-fungus complex? Implications for potential reinvasion By: Lu, Min; Wingfield, Michael J.; Gillette, Nancy; et al. Ecology, 92 (11): 2013-2019, Nov. 2011
10
30 Dynamics and management of infectious disease in colonizing populations
By: Bar-David, S; Lloyd-Smith, JO; Getz, WM. Ecology, 87 (5): 1215-1224, May 2006
10
31 Metabolic rate throughout the annual cycle reveals the demands of an Arctic existence in Great Cormorants By: White, Craig R.; Gremillet, David; Green, Jonathan A.; et al. Ecology, 92 (2): 475-486, Feb. 2011
8
32 Native pollen thieves reduce the reproductive success of a hermaphroditic plant, Aloe maculate By: Hargreaves, Anna L.; Harder, Lawrence D.; Johnson, Steven D. Ecology, 91 (6): 1693-1703, Jun. 2010
8
33 Inferring ecological and behavioral drivers of African elephant movement using a linear filtering approach By: Boettiger, Alistair N.; Wittemyer, George; Starfield, Richard; et al. Ecology, 92 (8): 1648-1657, Aug. 2011
7
34 Defoliation synchronizes aboveground growth of co-occurring C-4 grass species. By: Swemmer, Anthony M.; Knapp, Alan K. Ecology, 89 (10): 2860-2867, Oct. 2008
6
35 Tree allometries reflect a lifetime of herbivory in an African savanna
By: Moncrieff, Glenn R.; Chamaille-Jammes, Simon; Higgins, Steven I.; et al. Ecology, 92 (12): 2310-2315, Dec. 2011
5
36 Spatial and temporal changes in group dynamics and range use enable anti-predator responses in African buffalo By: Tambling, Craig J.; Druce, Dave J.; Hayward, Matt W.; et al. Ecology, 93 (6):1297-1304, Jun. 2012
4
37 Spatial scale and species identity influence the indigenous-alien diversity relationship in springtails By: Terauds, Aleks; Chown, Steven L.; Bergstrom, Dana M. Ecology, 92 (7): 1436-1447, Jul. 2011