610
Development Of A Model For Predicting The
Performance Of Engineering Students In
University Examination
Radheshyam H. Gajghat, Chandrahas C. Handa, Rakesh L. Himte
Abstract: This study was carried out to establish a mathematical relationship between influencing factors and the performance of engineering students in university examination. Pass/fail result in university examination was taken as performance measure. The exhaustive literature survey was carried out to explore the significant factors which influence the performance of university students. Also the opinion of stakeholders i.e. students and faculties was taken to add few more important factors in the list. Finally, 22 most important influencing factors were shortlisted for inclusion in the final questionnaire. This survey was conducted amongst the engineering students of technical institutions of Chhattisgarh, affiliated to Chhattisgarh Swami Vivekananda Technical University, Bhilai. Binary logistic regression method was used to formulate the mathematical model. This work will help the engineering students to improve their performance by predicting their probability of passing before appearing in examination.
Index Terms: Student performance, Influencing factors, Performing factors, Model formulation, Binary logistic regression, University examination.
————————————————————
1 I
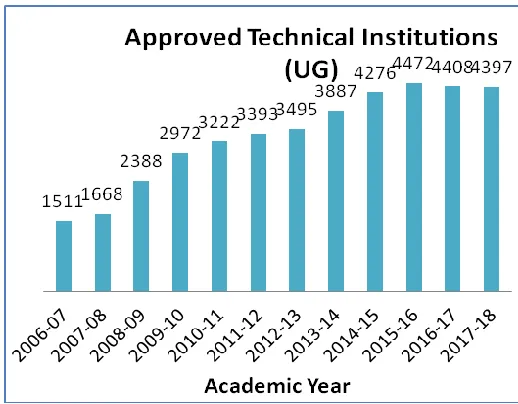
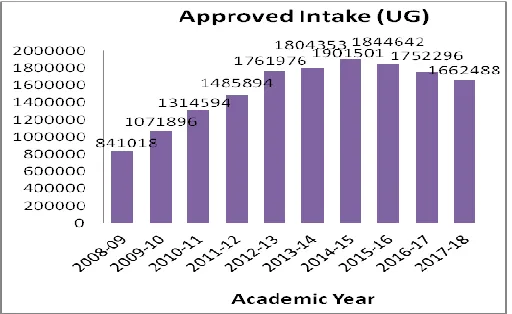
NTRODUCTIONINDIA, the largest democracy of the world, has shown a stupendous growth of its techno-economic progress, over the last 70 years of post independence period. Gradually, India is becoming self reliance in different sectors and key areas including space technology, IT sector, and food security etc. Now, Indian economy has become world‘s largest sixth economy, above all making India proud by fulfilling the requirement of technical manpower of the advanced countries of the world. All this could be possible mostly because of combined efforts of Indian government and technical educational institutes (including private and government sector) of the country [1]. Number of private and government technical institutions has been started to fulfill the increased demand of technical manpower. At the time of independence, there were only 44 and 43 engineering colleges and polytechnics (including pharmacy and architecture institutions) with an intake capacity of 3200 and 3400 respectively. Due to the efforts and initiatives taken by the government during consecutive Five-year plans and particularly due to policy changed in the eighties which allowed participation of private and charitable organizations in the setting up of technical institutions on self-financing basis, the growth of technical education has become significant. Figure 1 shows the growth of All India Council for Technical Education approved undergraduate technical institutions [2] and figure 2 shows the growth of intake in AICTE approved technical institutions at undergraduate level [2-4].
Figure 1: Growth of AICTE approved undergraduate technical institutions
The availability of large number of engineering seats in the country has created opportunity for 12th class science students with lower scores to take admission in undergraduate engineering courses, thereby reducing the university results. This poor result has also adversely affected the placement. As such now result of students has become the highest concern of engineering education system. If it is possible to know in advance which students are likely to fail, the corrective actions such as arranging extra and personal improvement classes, use of advanced tools for teaching, application of innovative teaching etc. can be taken by the college management or the teachers to improve the results. This will certainly help in improving the placements also. Good placement is the most important factor that will help the college to attract the students [5].
————————————————
Radheshyam H. Gajghat is a Associated Professor in Department of Mechanical Engineering, Christian College of Engineering & Technology, Bhilai, India. E-mail: [email protected]
Chandrahas C. Handa is a Professor in Department of Mechanical Engineering, KDK College of Engineering, Nagpur, India. E-mail:
611 Figure 2: Growth of intake in AICTE approved technical
institutions at UG level
The previous studies proved that student‘s university results can be improved by predicting and controlling the influencing factors which affect their academic performance. There are certain parameters like family background, personal characteristics, high school academic background, college environment etc. which have significant impact on the performance of university students. The academic performance of the students is not only influenced by their own natural characteristics but also various other factors [6]. There are some models which have been developed to predict students‘ performance or success at the university level. Most of the studies are focused on students‘ performance in the foreign universities, which may not be suitable for Indian universities due to the differences in their academic, social and cultural environment. So there was need to develop such a model which would be more suitable for the students of Indian universities [7].
In most of the models semester/cumulative grade point average (SGPA/CGPA) and success/failure (pass/fail) in the university examination has been taken as the performing (dependent) variable. In the previous researches, it was found that using only a single independent factor to decide academic success was not strong predictor of success at university level. So there was need to use multiple factors in combination to predict the students‘ success. If all the independent factors were taken as pre-admission factors, this approach had limited scope. So, it would be better to focus on post-admission factors along with pre-admission factors also.
This study may help the students to know the significant influencing factors and to predict their academic performance in university examination. It will make them able to improve their academic performance. This study may be useful for the parents and faculties to understand the difficulties faced by the students and provide them proper guidance and support. College administrators may be able to frame better teaching-learning policies and develop students‘ friendly teaching-learning process [8].
1.1 Objective of the research
The main objective of this study was to identify the significant influencing factors and formulate the model to correlate the performance of engineering students in university examination with their influencing factors. Students‘ performance is measured in terms of pass/fail result in
university examination.
1.2 Formulation of research problem
Literature survey [9] was carried out to study the previous work and found out the research gap in between the previous work done and present status of the problem. The proposed research has attempted to develop a practical model to predict the probability of passing in university examination. This model tries to establish the correlation between the influencing factors (X) and performing factor (Y). The correlation between influencing factors as independent variables (X) and pass/fail result i.e. probability of passing in examination as dependent variable (Y) can be mathematically expressed as follows:
Y = f(X)
Y = f(X1, X2, X3, X4)
Dependent Variable:
Y = Probability of Passing Independent Variables:
X = Influencing Factors such as Personal factors (X1),
Pre-admission factors (X2), Institutional factors (X3) and
Self-learning factors (X4)
1.3 Research hypotheses design
Hypothesis means a simple assumption to be proved or disproved. Research hypothesis is a formal statement or assumption or an idea made on the basis of limited evidence that the researcher wants to investigate. Hypothesis may be null hypothesis or alternative hypothesis. Null hypothesis is a hypothesis which proposes that there is no statistical significant variation exists in a set of observations. It implies that the population mean is equal to the hypothesized mean [10] and it can be expressed as:
H0: μ =
Rejecting the null hypothesis is nothing but accepting the alternative hypothesis. Alternative hypothesis is just an alternative to null hypothesis and in many cases it is just opposite to the null hypothesis. It implies that the population mean is not equal to the hypothesized mean [10] and it may be expressed as:
H1: μ ≠
Hypothesis no. 1:
H0:
There is no significant relationship between the influencing factors and pass/fail result in university examination.
H1:
There is significant relationship between the influencing factors and pass/fail result in university examination.
Hypothesis no. 2:
H0:
There is no significant relationship amongst the influencing factors which affect the performance in university examination.
H1:
612
2 M
ETHODSA
NDM
ATERIALS2.1 Identification of important factors
An exhaustive literature survey [9] was conducted to explore the probable influencing factors which influence the performance of university undergraduate students. In this literature survey, 114 influencing factors were identified. Few less influential factors were eliminated and finally 48 influencing factors were remained in the list. The opinions of stakeholders (i.e. students and faculties) were also taken to add few more influencing factors to design a good predictive model. In this process 90 influencing factors were identified and after screening 40 influencing factors were remained. Both lists were combined together which included 88 influencing factors. There were some similar factors which were merged together and finally a list of 75 influencing factors was prepared [11]. Five performing factors viz. semester/cumulative grade point average (SGPA/CGPA),
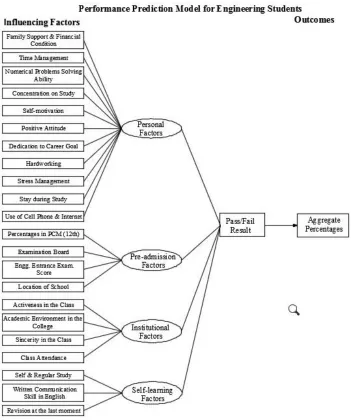
pass/fail in the examination, relative retention rate, time to graduation and aggregate percentages obtained in university examination [9], were also identified from the previous researches. A preliminary survey was conducted to identify and select most important factors that could be included in the final questionnaire. The purpose of this survey was to obtain quantitative data which would enable the researchers to identify the most important factors that students and faculties saw as influencing students‘ academic performance [12-13]. Through this survey, 22 influencing factors and pass/fail result in university examination as performing factor were identified as most important factors which were included in the final questionnaire [11]. These 22 influencing factors were classified in to four categories viz. Personal factors (X1),
Pre-admission factors (X2), Institutional factors (X3) and
Self-learning factors (X4) as shown in figure 3. For designing the
predictive model, the influencing factors (X) were taken as independent factors and performing factor (Y) as dependent factor.
613 2.2 Final questionnaire design
A final questionnaire was designed which included 22 influencing factors and pass/fail result as performing factor. For correct evaluation of each factor, numbers of statements were added to individual factor. The statements were taken from the questionnaire samples available on internet and previous research papers. Overall 75 statements were added for all the influencing factors [14]. These statements were also translated into participants‘ mother-tongue ‗Hindi‘ for their better understanding. The respondents were asked to tick the option on five points Linkert-type scale as per the importance of the statement they feel. In addition to the above influencing and performing factors, the questionnaire contained items for gathering demographic data such as name, gender, institute name, branch and mobile number of students.
2.3 Sampling technique and selection of population In this study, cluster sampling was used to select the sample. Cluster sampling is a type of probability sampling where the total population is divided into a number of relatively small subdivisions, called clusters, and then some of these clusters are randomly selected for inclusion in the overall sample [10]. From the past university results, it is observed that first year students‘ result is very poor. Also it is found that students who fail during first semester often fail to continue on toward graduation [15]. So the survey was based on the university examination result of first year. This survey was conducted among the engineering students of technical institutes affiliated to CSVTU, Bhilai. The sample size was calculated by using the following formula [10]:
Where,
N = Population, 8291 (Admission Year 2015-16)
Z = 1.96 for 95 % Confidence Level
p = Population Proportion, 0.5 for Maximum Sample Size
e = Margin of Error, May be taken 4 to 5 %
If e = 4, Sample Size = 367
If e = 5, Sample Size = 560
2.4 Data collection and filtration
In this type of research, the typical data collection methods, which were previously used, were focus groups, open-ended surveys and closed-form questionnaires. These methods are usually not used in solving deterministic types of engineering problems where randomness is not involved. However, when dealing with research issues related with engineering education, where measurement of attitude, ability, perspective, and motivation is involved, these methods are more appropriate and have so far been widely applied [16].
The primary data was collected from the engineering students of technical institutes affiliated to CSVTU, Bhilai by using the questionnaire. The secondary data regarding the performing factor i.e. pass/fail result was collected from the result websites (link was given on university website). This
secondary data was used to verify the figures related to performing factor provided by students. The attendance of most of the students was also verified from the attendance records provided by the institutes. In this survey close ended questionnaires were used because the population was literate and large and time for collecting data was limited. The research was conducted by means of distributing 950 questionnaires amongst third semester students (data collected based on their second semester/first year result) of 13 engineering colleges, out of which 840 questionnaires were returned, yielding an effective response rate of 88.42 %. During the survey, the data was collected by visiting the institutions personally to ensure the correct and genuine responses of the students. Before filling the questionnaire by the students, the purpose of the survey was explained and filling tips were given to them. The anonymity of participants was protected as their details were not disclosed anywhere. They were assured that their data would not be used for any other purposes and would be kept confidential. Data from questionnaires was compiled, sorted, edited, classified and coded into the coding sheet of Microsoft Excel. Further, the data was filtered by applying the following guidelines:
a. The questionnaires, which got similar responses for number of statements continuously, were removed. (This may be due to lack of seriousness in filling the questionnaire)
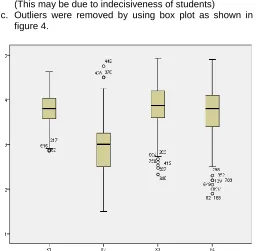
b. The questionnaires, where aggregate percentages‘ value was very low but average of influencing factors‘ value was very high or vice versa, were also removed. (This may be due to indecisiveness of students)
c. Outliers were removed by using box plot as shown in figure 4.
Figure 4: Outliers shown in box plot diagram
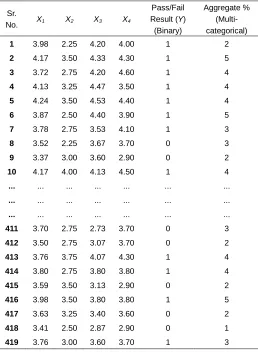
After filtration, the samples of 465 students were remained which were sufficient and was within the required range as per sample size calculated. Out of 465 samples, 419 (i.e. 90 %) samples (table 1) were used for model formulation and 46 (i.e. 10 %) samples were used for model validation. This dataset of 419 participants included 306 (i.e. 73 %) male students and 113 (i.e. 27 %) female students. In this
1 ) (
) 1 ( *
* 1
2 2
2
p p z N
e
N p p z SampleSize
614 survey, the students of all branches were included.
Branch-wise participation of students is shown in table 1.
Table 1: Branch-wise participation of students in the survey
Sr. No. Branch No. of
Participants
1 Civil Engineering 98
2 Computer Science 57
3 Electronics & Instrumentation 23 4 Electronics & Telecommunication 22 5 Electronics & Electrical Engineering 34
6 Mechanical Engineering 185
Table 2: Dataset of 419 samples used for model formulation
Sr.
No. X1 X2 X3 X4
Pass/Fail Result (Y) (Binary)
Aggregate % (Multi-categorical)
1 3.98 2.25 4.20 4.00 1 2
2 4.17 3.50 4.33 4.30 1 5
3 3.72 2.75 4.20 4.60 1 4
4 4.13 3.25 4.47 3.50 1 4
5 4.24 3.50 4.53 4.40 1 4
6 3.87 2.50 4.40 3.90 1 5
7 3.78 2.75 3.53 4.10 1 3
8 3.52 2.25 3.67 3.70 0 3
9 3.37 3.00 3.60 2.90 0 2
10 4.17 4.00 4.13 4.50 1 4
... ... ... ... ... ... ... ... ... ... ... ... ... ... ... ... ... ... ... ... ...
411 3.70 2.75 2.73 3.70 0 3
412 3.50 2.75 3.07 3.70 0 2
413 3.76 3.75 4.07 4.30 1 4
414 3.80 2.75 3.80 3.80 1 4
415 3.59 3.50 3.13 2.90 0 2
416 3.98 3.50 3.80 3.80 1 5
417 3.63 3.25 3.40 3.60 0 2
418 3.41 2.50 2.87 2.90 0 1
419 3.76 3.00 3.60 3.70 1 3
2.5 Data Analysis
2.5.1 Reliability and Adequacy of Data
The dataset of 419 students as shown in table 2 were used for model formulation. The reliability and adequacy of this dataset was checked by using SPSS Statistics 20.0. The Reliability statistics in table 3 shows the values of Cronbach‘s Alpha is equal to 0.899 for pass/fail result dataset which is greater than 0.7, indicated good support
for internal consistency and reliability of the data [17].
Table 3: Reliability statistics for pass/fail result dataset
Cronbach's Alpha Cronbach's Alpha Based on Standardized Items
N of Items
.899 .907 76
The Kaiser-Meyer-OIkin (KMO) test checks the adequacy of data i.e. whether data is sufficient or not. For the good adequacy of data, the value of KMO measure should be greater than 0.70. If it is less than 0.50, the data is said to be inadequate [18]. Table 4 shows KMO measures is equal to 0.837 for pass/fail result dataset which is greater than 0.70, showed good adequacies of data. The Bartlett‘s test should be significant i.e. a significance value should be less than 0.05 at 5 % significance level. This means there is sufficient relationship between all the variables which is a reasonable basis for further analysis. Table 4 also shows Bartlett‘s Test of Sphericity where the value of p is equal to 0.000 which is less than 0.05. Hence correlation was significant and the dataset was found to be fit for further analysis.
Table 4: KMO and Barttlett’s test for pass/fail result dataset
KMO and Bartlett's Test
Kaiser-Meyer-Olkin Measure of Sampling Adequacy. .837
Bartlett's Test of Sphericity
Approx. Chi-Square 10385.511
df 2850
Sig. .000
2.5.2 Correlation of influencing factors with pass/fail result
The performance of students was measured in students‘ pass/fail result in university examination and student was coded as 1 for pass and 0 for fail. It is necessary to ensure significant correlation between influencing factors and performing factors (i.e. pass/fail result) before designing the model. Influencing factors are parametric variables whereas pass/fail result is non-parametric variable. To establish the correlation between parametric and non-parametric variables, the chi-square test is best suitable [19]. Hence chi-square test was conducted to find the correlation between influencing (categorical) factors (X1, X2, X3, X4) and
pass/fail result as performing factor (Y) at significance level 5 % by using SPSS Statistics 20.0. The output of the test is as shown in table 5.
Hypothesis no. 1
H0:
There is no significant relationship between the influencing factors and pass/fail result in university examination.
H1:
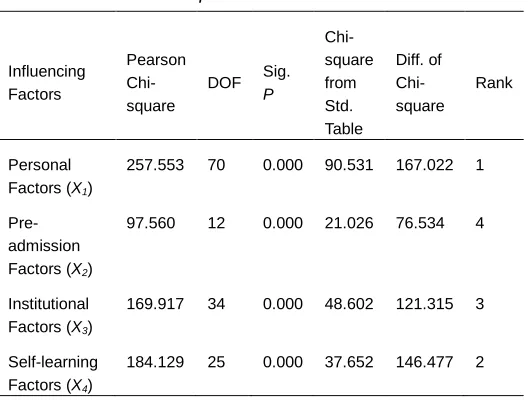
615 Table 5: Chi-square values for influencing factors with
pass/fail result
Influencing Factors
Pearson Chi-square
DOF Sig. P
Chi-square from Std. Table
Diff. of Chi-square
Rank
Personal Factors (X1)
257.553 70 0.000 90.531 167.022 1
Pre-admission Factors (X2)
97.560 12 0.000 21.026 76.534 4
Institutional Factors (X3)
169.917 34 0.000 48.602 121.315 3
Self-learning Factors (X4)
184.129 25 0.000 37.652 146.477 2
The result of chi-square test in table 4 reveals that Pearson chi-square values calculated on the basis of 419 samples were more than standard square values taken from chi-square distribution table at 5% significance. The calculated P values are less than 0.05, indicate that null hypothesis Ho
is rejected and alternate hypothesis H1 is accepted for all
influencing factors. It implies that there is significant relationship between the influencing factors and pass/fail result.
The ranking of influencing factors is done on the basis of differences of chi-square as shown in table 5. As the ranking of influencing factors goes on increasing, its impact on result decreases. So, personal factors (X1) have most
impact whereas pre-admission (X2) factors have least
impact on pass/fail result. Self-learning (X4) and institutional
factors (X3) are on second and third position respectively.
2.5.3 Correlation amongst influencing factors
In this research work, 22 important influencing factors were grouped into four major factors i.e. Personal (X1),
Pre-admission (X2), Institutional (X3) and Self-learning (X4) as
input variables. To check correlation amongst all considered influencing factors, paired t-test was found suitable. Paired t-test was conducted to check correlation between influencing factors (X1, X2, X3, X4) in pairs and find level of
significance by using SPSS Statistics 20.0 as shown in table 6. The correlation of different pairs of influencing factors was found out at 95 % confidence level.
Hypothesis no. 2:
H0: There is no significant relationship amongst the
influencing factors which affect the performance in university examination.
H1: There is significant relationship amongst the
influencing factors which affect the performance in university examination.
Table 6: Paired t-test showing correlation between influencing factor pairs
Sr. No. Pair No. of
Samples Correlation Sig. P Rank
1 X1 & X2 419 .360 .000 5
2 X2 & X3 419 .318 .000 6
3 X3 & X4 419 .612 .000 1
4 X1 & X3 419 .597 .000 3
5 X1 & X4 419 .602 .000 2
6 X2 & X4 419 .462 .000 4
The result of Paired t-test in table 6 reveals that all influencing factors were having positive and significant correlation with each other. The institutional factors (X3)
showing positive, strongest and highest correlation i.e. 0.612 with self-learning factors (X4) indicates that good
institutional environment promote students for self-learning. Positive and strong correlation of personal factors (X1) with
both self-learning factors (X4) i.e. 0.602 and institutional
factors (X3) i.e. 0.597 indicate that personal factors motivate
for self-learning and help to create good institutional environment. The pre-admission (X2) factors with
institutional factors (X3) i.e. 0.318 and personal factors (X1)
with pre-admission factors (X2) i.e. 0.360 have significant
but weaker correlation which supports less dependency of these factors on each other. The correlation between pre-admission factors (X2) and self-learning factors (X4) i.e.
0.462 is moderate which indicates that pre-admission academic achievements were due to the good self-learning practices adopted by the student.
3 R
ESULTSA
NDD
ISCUSSION3.1 Development of binary logistic regression model for pass/fail result
The pass students were coded as 1 and fail students were coded as 0. Thus result outcome can be expressed in binary terms. When a linear model was developed, it gave the output in the form of fraction in between 0 to 1 which also indicated the probability of passing. The proposed research was conducted to develop a mathematical model to predict probability of passing of engineering students in university examination. Influencing factors i.e. Personal (X1), Pre-admission (X2), Institutional (X3) and Self-learning
(X4) factors were considered as independent factors and
probability of passing (pass/fail result) was considered as dependent variable. This relation can be expressed as:
Probability of Passing, Y = f (X1, X2, X3, X4)
616 spread 0 to 1. Therefore, Binary Logistic Regression Model
was more suitable for this type of problem [20-22]. Binary Logistic Regression equation is given by
Where, Y is the probability of passing on fail i.e.1 on 0
e is the base of the natural logarithm,
a is a constant,
b is a coefficient of X.
Reasons for using Binary Logistic Regression Model are as follows:
a. Output variable is in binary code form i.e. Pass (1) or Fail (0).
b. In linear multiple regression model, sometimes the predicted probability of passing are greater than one and less than zero for few samples which is theoretically unacceptable.
c. Probability of Passing (Y) is not having linear relationship with influencing factors i.e. X1, X2, X3 and X4.
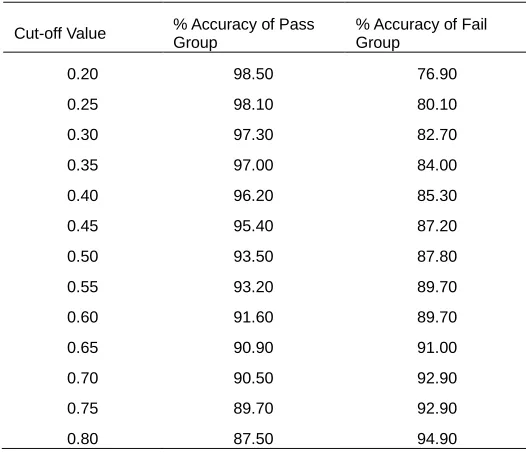
3.2 Cut-off value for optimum accuracy of BLR model
To develop binary logistic regression model, cut-off value is required as input in SPSS Statistics 20.0. For each cut-off value, the predicted accuracy of pass/fail result dataset was obtained by running logistic regression model. Predicted accuracy of pass/fail result dataset in percentages was found by varying cut-off values from 0.2 to 0.8 as shown in table 7. The graph was drawn between cut-off values and predicted accuracy % as shown in figure 5.
Table 7: Accuracy in % with cut-off values
Cut-off Value % Accuracy of Pass Group
% Accuracy of Fail Group
0.20 98.50 76.90
0.25 98.10 80.10
0.30 97.30 82.70
0.35 97.00 84.00
0.40 96.20 85.30
0.45 95.40 87.20
0.50 93.50 87.80
0.55 93.20 89.70
0.60 91.60 89.70
0.65 90.90 91.00
0.70 90.50 92.90
0.75 89.70 92.90
0.80 87.50 94.90
Figure 5: Graph between cut-off values with predictive accuracy in percentages
In figure 5, it was observed that optimum predicted accuracy for pass/fail result dataset was found at cut-off value 0.65. The prediction accuracy of pass group is 90.90 % and fail group is 91 %. The overall prediction success rate of the model is 91 %. This cut-off value i.e. 0.65 and 95 % confidence level was used to find out final binary logistic regression model.
Table 8: Model summary of BLR model for pass/fail result
Model Summary
Step -2 Log likelihood Cox & Snell R Square
Nagelkerke R Square
1 151.049a .617 .842
a. Estimation terminated at iteration number 8 because parameter estimates changed by less than .001.
In above table 8, Nagelkerke R2 value is equal to 0.842 indicates a moderately strong relationship between influencing factors and probability of passing. The coefficients of input variables in the equation for the model are as shown in table 9.
Table 9: Coefficients of BLR model for pass/fail result Variables in the Equation
B S.E. Wald df Sig. Exp(B)
Step 1a
X1 10.484 1.508 48.343 1 .000 35756.891 X2 1.929 .447 18.618 1 .000 6.885 X3 2.948 .655 20.261 1 .000 19.073 X4 2.225 .636 12.237 1 .000 9.256 Constant -63.934 7.533 72.030 1 .000 .000 a. Variable(s) entered on step 1: X1, X2, X3, X4.
Binary logistic regression model from above table 9 is formulated as
Logit Y =
617 The above designed binary logistic model will predict the
probability of passing of engineering students in university examination. The sample categorized as pass if predicted probability is equal to as or more than 0.65. All influencing factors contributed significantly at significance level 0.05 (p < 0.05). The ranking of factors was done on the basis of Wald Coefficient as shown in above table 9. As per Wald coefficient, personal factors (i.e. 48.343) are most important and self-learning factors (i.e. 12.237) are least important. Institutional (i.e. 20.261) and pre-admission (i.e. 18.618) factors are on second and third position.
4 C
ONCLUSIONSThe analysis of result reveals some important inferences related to impact of influencing factors on performance of engineering students in university examination. On the basis of this study and analysis of results, some important conclusions can be drawn which will be helpful to solve the issues that are responsible for students‘ poor academic performance in university examination. This work will help the management, academicians and engineering faculties to frame a better and effective educational policy and modify the existing teaching learning process which will improve the overall performance of engineering students and hence enhance their employability. The influencing factors showing positive correlation have to be enhanced and the factors showing negative correlation have to be minimised to improve the performance.
Based on this research work, the following conclusions are drawn and presented as below:
1. From table 5 it can be concluded that there is significant relationship between the influencing factors and pass/fail result. The personal and self-learning factors are the deciding factors for passing the students in university examination. These factors have high impact on the result whereas institutional factors have moderate and pre-admission factors have lesser impact on the result. 2. It is observed from table 6 that there is significant and
positive correlation amongst all the influencing factors. A strong and positive correlation exists between institutional and learning factors, personal and self-learning factors, personal and institutional factors. This indicates that good institutional environment promote students for self-learning. High score of personal factors motivate for self-learning as well as help to create good institutional environment. There is moderate correlation between pre-admission and self-learning factors which support the perception that student with good academic background is already motivated for self-learning. The weak correlation between personal and pre-admission factors, pre-admission and institutional factors suggest lesser dependency of these factors on each others. 3. The coefficient of determination, R2 value obtained in
Binary logistic regression model for pass/fail result is equal to 0.842 which shows strong relationship between probability of passing and influencing factors. The optimum cut-off value for this model is found to be 0.65. It means students with the passing probability equal to or more than 0.65 is considered as pass.
4. After analysis of BLR model and correlations, it can be concluded that personal factors (X1) are most important
factors and have high impact on the probability of
passing of engineering students followed by institutional (X3), self-learning (X4) and pre-admission (X2) factors.
Pre-admission factors play very little role in the performance of students. If a student with high score in personal factors take admission in an institute with good institutional environment, his probability of passing will be more.
In nutshell, this study has developed a predictive model based on binary logistic regression method which is capable of predicting the performance of engineering students in university examination satisfactorily.
A
CKNOWLEDGEMENTThe authors would like to acknowledge the help and kind support extended by the management of different engineering colleges of Chhattisgarh affiliated to Chhattisgarh Swami Vivekananda Technical University, Bhilai. The authors also wish to express their gratitude to all the faculties and students for their cooperation during data collection for this study.
R
EFERENCES[1] Chopra, K and Sharma, P Higher Technical Education in India- Profile of Growth and Future Perspectives. Tech. rep., ADB Sponsored RETA Project in India. http://www.namstct.org/ADB_RETA_Report/Prof_KL_ Chopra_Prof_PB_Sharma.pdf, assessed on 11/05/2016
[2] All India Council for Technical Education Approval Process Handbook 2018-19. https://www.aicte-india.org/sites/default/files/APH%202018-19.pdf assessed on 24/12/2017
[3] All India Council for Technical Education Approval Process Handbook 2013-14. http://www.old.aicte-india.org/downloads/Approval_Process_Handbook_20 13-2014.pdf assessed on 24/12/2017
[4] All India Council for Technical Education Approval Process Handbook 2015-16. http://www.old.aicte-india.org/downloads/Approval_Process_Handbook_20 15_16.pdf assessed on 24/12/2017
[5] Kabra, R R and Bichkar, R S, ―Performance prediction of engineering students using decision trees‖, International Journal of Computer Applications, 36(11), 2011.
[6] Daniyal, M, Nawaz, T, Aleem, M and Hassan, A, ―The Factors Affecting the Students‘Performance: A Case Study of Islamia University of Bahawalpur, Pakistan‖, African Journal of Education and Technology, 1(2): 45-51, 2011.
[7] Harb, N and El-Shaarawi, A Factors Affecting Students‘ Performance. 2006 Munich Personal Archive (MPRA)
[8] Alos, S B, Caranto, L C and David, J J, ―Factors affecting the academic performance of the student nurses of BSU‖, International Journal of Nursing Science, 5(2): 60-65, 2015.
[9] Gajghat, R H, Handa, C C and Himte, R L, ―Factors Influencing Academic Performance of the Students at University Level Exam: A Literature Review‖, International Journal of Research in Engineering and Technology, 6(5): 102-110, 2017.
618 Techniques‖, New Age Internatinal (P) Ltd.,
Publishers. 2014.
[11] Gajghat, R H, Handa, C C and Himte, R L, ―Identification of Important Factors Influencing the Performance of Engineering Students in University Examination: A Systematic Approach‖, Research Journal of Engineering and Technology, 8(4): 447-452, 2017.
[12] Ditcher, A and Tetley, J, ―Factors influencing university students‘ academic success: what do students and academics think?‖, HERDSA Annual International Conference, Melbourne. 1-14, 1999. [13] Kalbande, V N and Handa, C C, ―Identification of
Important Parameters & Skills Required by Engineering Students in Campus Placement Process‖, International Journal of Engineering Research-Online, 3: 1-7, 2015.
[14] Gajghat, R H, Handa, C C, and Himte, R L, ―Design and Development of a Questionnaire to Study the Effect of Various Influencing Factors on Performance of Engineering Students‖, i-manager‘s Journal on Educational Psycholog, .12(2): 26-35, 2018.
[15] Selim, M Y and Al-Zarooni, S, ―Do secondary school grades predict the performance of engineering students?‖, Australasian Journal of Engineering Education. 15(3): 145-153, 2009.
[16] Li, Q, Swaminathan, H and Tang, J, ―Development of a classification system for engineering student characteristics affecting college enrollment and retention‖, Journal of Engineering Education. 98(4): 361-376, 2009.
[17] Morgan, G C, Leech, N L, Gloeckner, G W and Barrett, K C ―SPSS for Introductory Statistics - Use and Interpretation‖, Lawrence Erlbaum Associates, Publishers, London, 2004.
[18] Leech, N L, Barrett, K. C and Morgan, G C, ―SPSS for Intermediate Statistics - Use and Interpretation‖, Lawrence Erlbaum Associates, Publishers, London, 2005.
[19] Shukla, D, ―Employability Skill among Professionals – Chagrin of HR Executives in Indian Labor Market : A Study on Engineering Graduates of Bhopal City‖, VSRD International Journal of Business & Mngt. Research. 2(8): 418-427, 2012.
[20] Ayán, M N and García, M T, ―Prediction of University Students‘ Academic Achievement by Linear and Logistic Models‖, The Spanish Journal of Psychology. 11(1): 275-288, 2008.
[21] Kalbande, V N and Handa, C C, ―Developing a Model to Predict Employability of Engineering Students in Campus Placement for IT Sector‖, International Journal of Advance Research in Engineering, Science & Technology. 2(6): 201-206, 2015.