IDBSCAN Algorithm Based Proficient Anomaly
Detection
Nooh Bany Muhammad
Abstract: In Wireless Sensor Networks, anomaly is considered as most impact component because the data integrity is affected by anomaly. This causes uncontrolled network on Wireless Sensors. This research work handles the detection of anomaly effectively. Initially this work considers most essential features among vast number of features from bench mark dataset Intel Berkeley Research lab (IRLB). Those features are temperature, voltage and humidity. From the network traffic, aforementioned features are extracted. The data of network are clustering by using Improved Density-Based Spatial Clustering of Applications with Noise (IDBSCAN) algorithm. The anomaly is detected by varying the portions based on density, where the low density regions are considered as anomaly data. Probabilistic neural network is trained by using normal data which is clustered in high- density portions. The novel of this proposed IDBSCAN algorithm is Minimum spanning tree is evaluated by using Improved Kruskal Algorithm (IKA). Thus the anomaly is found effectively and security of network is improved.
Index Terms: WNS, Density-Based Spatial Clustering of Applications with Noise, Intel Berkeley Research lab, Kruskal Algorithm, Intrusion detection
————————————————————
1. INTRODUCTION
EVELOPMENT in large scale wireless sensor networks (WSNs)[1] have been enabled because of continuous advances occurred in wireless communication technologies as well as MEMS. The real time applications of WSNs are wide ranging for example, target tracking, military surveillance and environmental monitoring. In such cases of applications, normally sensors are fitted out for sensing, radio transmission units and data processing whereas the power is largely inadequate. The limited power of the sensors pioneering novel methodologies in order to develop the energy effectiveness and also lengthen the lifetime of network. Now a day‟s energy-aware design becomes sizzling research field at entire stacks of networking protocol. In so many WSNs applications[2], gathering of data is main precautious process, whereas hierarchical mechanisms and data aggregation are typically engaged. The data redundancy can be eliminated in the process of Data aggregation. This can also reduce the loads in the communication. Clustering or Hierarchical[3]approaches are having the specialty of having effective network scalability. Because of its data latency reduction, the Clustering mechanism are expansively applied. Basically, density-based clustering approaches[4] are recognized the clusters as high density portions which have been divided from portions of low density. In the data space, these portions are illustrated as arbitrarily shape. There are wide range of formalizations are found in the density based clusters in various applications. Based on the general idea, these mechanism are describing clusters as linked dense elements. The variation of these approaches is only description of connectedness and density. From sparser noise, the DBSCAN (Defined distance)[5] uses a particular distance to dispersed dense clusters. In all among
clustering approaches, DBSCAN algorithm is the quickest approach. But, it is only applicable when the process is using clear Search Distance. This approach needs entire expressive clusters which have related densities. From a specific point When the Minimum Features per Cluster was not found for Defined distance approach inside the search distance, then that certain point is considered as noise. Although, when the feature‟s core-distance was superior to the Search Distance, then that point is termed as noise.
Fig. 1. Search distance of DBSCAN
The above figure shows, if the Search Distance is less than the core-distance, the features are denoted as noise. If the search distance is superior to the core-distance, the considered features are termed as cluster part.In this proposed work, anomaly is detected by using IDBSCAN algorithm by considering three essential features such as temperature, voltage and humidity, those are extracted from network traffic.
2
LITERATURE
SURVEY
This section discusses the various existing anomaly detection approaches based on DBSCAN. [6]Focused an innovative approach based on segment in order to handle data effectively. The neighboring data segment collection was considered as random variables. The spatial predictabilities are exploited by determining the abnormal behavior. The traditional anomaly detection approaches executed only based on point which manages every opinion exclusively, which are ————————————————
1002 incapable for consistently. This work effectively reported
long-term anomalies which are presented in a separate sensor node. In WSN, this work investigated the approach to develop the prediction variance detector. By engaging Spearman‟s rank correlation coefficient and differential compression, the communication cost which was spent while grouping a covariance matrix was found. Wide range of long-term anomalies were detected effectively. When compare basic centralized approach, the cost for communication can be reduced up to 80 percent. [7]Investigated a widespread anomaly detection framework named Holmes for regular activities in home. Holmes exactly study the occupant‟s casual activities by analyzing the differences in regular activities on the basis of particular days of the week, month, temporal, collective and correlation features. The study predicted that it decreased the counts of false alarms with respect to the prevailing techniques. On the basis of expert and resident feedback, the Holmes analyses the semantic rules which demonstrates particular differences of activities in exact situations to decrease the false alarms. [8]Proposed a DBSCAN model depict an outlier detection system on the basis of density. The updated DBSCAN was protected by the calculation of least radius of recognized cluster „Eps‟ for the purpose of fitting to the cluster. Based on the above factor the normal and abnormal point had been decided. The efficiency of the postulated algorithm was experimented on different synthetic base developed from Intel Berkeley database. From the obtained results it was noticed that the suggested work possessed high effectiveness than the present model with respect to FAR and ACC. Also the average DR proved the high efficiency of the detector for adjacent outliers with seventy percent of DR, ninety percent of ACC and very low negligible percentage of ACC. [9] suggested the online application of NP (Neyman-Pearson) description to rectify NP optimality which permits the achievement of maximum power of detection at a definite false alarm rate in online manner perfectly. With the aspect of suggested algorithm, it is suitable for the implementations that needed consecutive data processing at a high rate mainly due to factors regulating free efficient computational design along with NP parameters below the non-stationary and stationary statistical sources. The algorithm could able to access the real time control of error in type 1. It perhaps learned the altering nominal Markov statistics in a series of time and anomaly detection that is adequately variable statistical subsequent on the basis of anomalies. [10]Developed two kinds of outlier detection methods on the basis of density to identify indigenous outliers using Local Outlier Factor that used k-distance neighborhood formulation. The proposed study are formulated in two aspects which are to minimize the computing time for predicting LOF to correlate with important constraints of sensible nodes and supporting outlier identification present in sparse and dense clusters. The work explained the DBOD_MSS required minimum time of computation for developing LOF in the first approach and in the second approach the outlier appearing was detected successfully as minor groups which are not detected by the prevailing approach whereas the first discussed approach had the chance of detection of outlier appear. [11]Suggested a technique for real time images mainly for pixel separationwhich consisting of 50 frames with the help of density based spatial clustering of applications with noise (DBSCAN) algorithm. The computational price of super pixel algorithm is reducedby deploying two frameworks. The first
quantitative and qualitative analysis of a social network, For example Social Media (Face book, Whatsapp, Twitter, Etc).That was used for researchers to perform analysis using software and unique theories and methodologies. SNA was often diagrammed with points or nodes and lines or ties to present the convolution related to social networking. Data mining was the knowledge extraction process. Data mining was mostly used for Social network analyzer to detect the unusual and illegal activities exhibiting different behaviors than others present in the same behavior or structure. In this paper consist to detect and prevent the various anomalies based on various features. And this paper presented the types of data mining techniques to detect the anomalies, the types were
behavior based
spectral based
structure based
[17] An unsupervised DBN and a one-class SVM was trained to extract generic varied features, was trained by the deep belief networks which the hybrid model presented .DBN consists of irrelevant Characteristics which disguised the presence of anomalies. This problem was, known as the „curse of dimensionality‟, which was blocked for many anomaly detection techniques. One-class SVM (support vector machines) were effectively produced the decision surfaces from well-behaved feature vectors and ineffective modeling of the variation in large, high-dimensional datasets. Architecture such as Deep Belief Networks (DBNs) is one of the favorable technique for learning robust features such us object recognition, image registration, classification.
[18] Explicated the architecture and described the suggested framework for anomaly detection and healthcare monitoring for all patients in medical using Wireless Body Area Networks(WBANs). The architecture explicates novel data mining and some machine learning algorithms with modern sensor fusion techniques and this process was often differentiated as low, Intermediate and high. Depending on the processing stage the fusion takes place. To increase the effectiveness of Wireless Body Area Networks systems used in the healthcare industry researcher developed the network of wireless sensor known as WBANs for initial level hospital and clinics by creating an application which is capable of “intelligently” discriminating between patient health irregularities and sensor signal failure. WBAN used to both patients and healthcare owners that save the time of both. In this paper Support Vector Machine (SVM) technique was used to classify abnormal instances from incoming sensor data If found, when applied a periodically rebuilt and regressive prediction model to the irregular instance. It was found if the patient entered a critical state or if a sensor is reported faulty readings. It shows quickly able to identify sensor anomalies and compared with several other algorithms, which was maintains a higher positive rate and lower negative false rate [19] Explained the world has huge amounts of data were stored and transferred from anywhere and any location. Data mining was the knowledge extraction process. Anomaly detection was used these Data mining techniques, that meets the different behavior from some same set of behavior. In this paper existed, using different types of data mining techniques to detect the anomaly that may help interested researchers to work future in this direction. Intrusion Detection Systems (IDS) was one of the security tool that‟s provide strengthen to security of communication and information systems. IDS technique acts like antivirus software, firewalls. These system
has been classified such us, Anomaly detection systems or Hybrid detection systems and Signal detection systems. In anomaly detection systems compare activities against normal defined behavior. In this paper focus upon the various anomaly detection techniques.[15]Showed A novel support vector machine (SVM) model combining kernel principal component analysis (KPCA) with genetic algorithm (GA) was proposed for intrusion detection, was this most important and effective things for security infrastructures in network environments. In these traditional IDS, there are many problems Such as insufficient analysis capability, low detection capability, unknown network attack and false alarm rate and so on. Researcher always wants to find a new intrusion detection technology with better accuracy detection and less training time. There are various machine learning methods such us,Decision tree, Genetic algorithm, Principal component analysis, Fuzzy logic and Support vector machine. Among the mentioned method Support vector machine (SVM) was one of the important one, the main reason was distribution of different types of attacks was imbalanced, which was frequently utilized in real time classifications applications.
3
PROPOSED
WORK
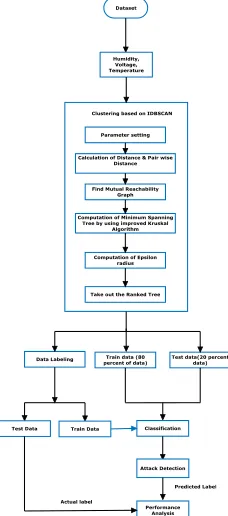
This section deliberates the proposed methodology with overall flow diagram. The Fig.5 illustrates the overall flow diagram. Initially the IRLB dataset is considered for detect the anomaly. Among numerous number features, there are three features are extracted those are Humidity, voltage and Temperature. Then these features are clustered by using IDBSCAN algorithm. This algorithm is explained in subsequent sections. The clustering process is started with setting the parameter. After that the distance and pair wise distances are calculated. The Mutual Reachability Graphs are found. The novelty of this proposed work is given in the calculation of Minimum spanning tree. The existing approaches are used Prim‟s Minimum spanning tree whereas, this proposed approach uses Improved Kruskal Algorithm (IKA). Then the Epsilon radius is calculated. Finally the ranked tree was taken out. The clustered results arefurther labeled as high density portions as 1. Low density regions as 0. These labeled results are divided into two separate parts one for training and another one training in the ratio of 8:2. The clustered results are separately processed for further machine learning classification. The classification is done based on Probabilistic neural networkapproach. The results from data labeling process finally compared with the predicted data from the Probabilistic neural network based classification process. By comparing predicted data and labeled data, the anomalies are detected accurately. Then the performance of attack detection is compared by means of various performance measures accuracy, recall and precision.
3.1 Feature Selection:
1004 Fig. 2. Data Received from sensor with temperature
Fig. 3. Data Received from sensor with temperature
Fig. 4. Data Received from sensor with temperature
3.2 Clustering:
Clustering is the process of identifying a collection of similar objects contained in a data set and separating the dissimilar objects in various groups or a group termed as noisy points. The clustering process is observed as a task of unsupervised learning. In the case of density based clustering, it is a group of data objects found over the adjoining area with high density of the data space. The separation of density based clusters from one another was performed by low density objects of adjoin regions. The data objects present in low density areas are normally regarded as outliers or noise.
IDBSCAN is accessibleforthehugedatasetsbecause it permitsutilization of index structures for estimating the density
3.3 Coefficient Correlation (CC):
In IDBSCAN algorithm, there 2 most important parameters are presented those are Epsilon and MinPts. These two input parameters is calculated inorder to detect the anomalies. Hence, the basic assumption indensity-based approach was, there should be minimum of two clusters in order to recognize the anomalies. The Eq.1 is for the CC which is having the variable of total number of clusters and input parameters. This coefficient provides the relation among input as well as output based on the criteria of detecting anomaly based on density. The best input parameters are selected from the IDBSCAN algorithm based on an equation. This equation are utilized to acquire superior value of E as well as MinPts through commanding limitations and redo the algorithm steps. Figure 4 illustrates the concluding clustering.
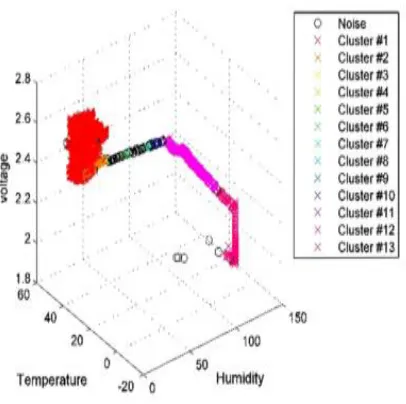
Fig. 6. IDBSCAN clustering
For various input parameters the performance and obtained results of IDBSCAN is given in Table 1.
TABLE1
PERFORMANCE OF IDBSCANALGORITHM
Epsilon MinPts
Cluster Number
Coefficient Correlation-Existing
Coefficient Correlation-Proposed
5 20 2 0.75 0.9836
3 30 8 0.33 0.3054
3 20 3 0.56 0.6557
1 30 10 0.29 0.167
1 25 16 0.15 0.0734
1 20 19 0.1 0.1035
1 15 16 0.08 0.092
1 10 16 0.05 0.0611
1 5 9 0.044 0.0537
3.4 Data Labeling:
The most of the data are normal in data labeling process while the density based approach was assumed. The high density data are accumulated as separate cluster. Then, IDBSCAN algorithms best input parameters are found.The clusters are found that the high-density portions are taken as normal data (denoted as 1) when clusters with low-dense portions are taken as anomaly data (denoted as 0). The Fig.6, shows clearly the clusters of IDBSCAN algorithm. The orange coloreddistrictsare denoting the high- denseportionswhich are normal data sectionaslikeextra regions (other than orange color) portions refers low- dense are noticed as anomaly data. Other than these, the squareddistricts are the data those are presented noise.
3.5 Probabilistic neural network:
This network is based on the concept Bayesian approach. It is a multivariate probability calculation and also competitive learning. It is a four-layered architecture. It contains nodes which able to map the patterns of input to distinct classes. This network is used to classify the normal and anomaly data as 1 and 0.
3.6 Working Procedure of IDBSCAN ALGORITHM: Initially the features are selected from the dataset IRLB. The features are temperature, humidity and voltage. The input parameters of IDBSCAN those parameters are𝓜 ,
𝓔 ,𝓒 . The correlation coefficient is calculated by using
following formula,
CC =
,
(1)
Where CC is Correlation Coefficient
If CC value is more than 1, then the value is minimized by initializing the input parameters as step 2 in below algorithm. The notations of Eq. (1) is given in algorithm steps.
Algorithm: IDBSCAN Input:
Output:
Step 1: Choosing the appropriate features such asvoltage temperature and humidity from the 𝒳 dataset
Step 2:SettingIDBSCAN algorithm‟s input parameters ( ,
ℰ , )
Step 3: Operating on IDBSCAN on 𝒳 .
Step 4:whenCC> 1, at that time it process from step 2 tillCC is get reduced below 1.
Step 5: Calculated Correlation coefficient by using following formula,
CC = , Where,
CC Expressed as correlation coefficient
1006 ℰ Expressed as epsilon value
Expressed as cluster number
Expressed as neighborhood radius obtained
The step 3 in above algorithm is explained below: Pair wise distance is calculated in following manner:
𝒟 = √∑ p − q
(2) The core distance is estimated by using following equation,
𝒟 = sort 𝒟 1
The Eq. 2 & 3 are used to calculate the core distances and pair wise distance for every 𝒳 by using .
(3) The mutual reachability distance 𝒹 is calculated by using
following equation:
𝒹 = max 𝒟 𝒟 𝒟 ; (4)
From Eq. 4 we can understood that the maximum value of 𝒟 𝒟 𝒟 is assigned as 𝒹
The novelty of this proposed work is given in the computation of Minimum Spanning Tree. In existing work the Minimum Spanning Tree is computed by using various algorithm such as Prim‟s algorithm. In this proposed work, the Minimum Spanning Tree is calculated by using Improved Kruskal algorithm.
Algorithm sub step for IDBSCAN Step 1: start
Step 2: Calculate the core distances and pair wise distance for each 𝒳 by using
Input:𝒳
Output: 𝒟 𝒟
𝒟 = √∑ p − q
𝒟 = sort 𝒟 1
𝒟 is assigned based on the value of
Where,
𝒟 Expressed as pair wise distance
𝒟 Expressed as core distance
Step 3: Find the mutual reachability distance 𝒹
𝒹 = max 𝒟 𝒟 𝒟 ;
Step 4: Compute the mutual reachability graph 𝒢
It is a complete graph, 𝒢 h, in which the objects of 𝒳 are vertices and the weight of each edge is
the 𝒹 (with respect to ) between the
respective pair of objects.
Step 5: Compute Minimum Spanning Tree by using Modified Kruskal algorithm
The step 5 in above algorithm is having following steps: Input:𝒢
Output: 𝒮𝒯
Step 1: The score value are calculated for all 𝒶 by using this equation
𝒮 =1 − 2 − 2 − − 2
Where 𝒶 expressed as arc in the graph 𝒮 Expressed as the score function Expressed as truth-membership degree Expressed as indeterminacy membership degree
Expressed as falsity membership degree
Step 2: Arrange all 𝒶 of 𝒢 by their correspondingvalue of
scores: initiallyminimum score value and finallymajor score value. As edge weights,the score values are utilizedcorrespond the value of neutrosophic graph 𝒢
Step 3: Select the not recognized edges from the graph G. to the 𝒮𝒯 , addingthe selected arc when this is nor creating
entire cycle.
Step 4: Stop the process whenever k − 1 arcs have been added to the 𝒮𝒯 .
Where k is the number of node in the 𝒢
The step 4 in above algorithm are solved by following manner Step 1: Start
Step 2: 𝒮𝒯 = {θ}. 10describes a set of edges, which
is the 𝒮𝒯
Step 3: For 𝒶 = 1 to 𝒶 ∈ 𝒢
𝒮 =
Insert 𝒶 into 𝒢 h
End
Step 4: While 𝒮𝒯 ≤ k-1 do
Select 𝒶 form 𝒢 h with least score value
if 𝒮𝒯 ∪𝒶having no cycle after
𝒮𝒯 = 𝒮𝒯 ∪ 𝒶
End
Delete 𝒶 from 𝒢 h
End while Step 5: Stop
Computation of epsilon radius is mentioned below Step 1: Compute the epsilon radius
Sort the edge weight in descending order where obtain from 𝒮𝒯 ,
= sort 𝒮𝒯
Step 2: Take out the ranked tree R from 𝒮𝒯
For the root of the tree set all objects the same label.
Remove all edges from 𝒮𝒯 in
decreasing order.
Step 3: end
4
PERFORMANCE
ANALYSIS
This section analysis the performance analysis of proposed approach is carried out on IRLB dataset[20]. The Fig.8, Fig.9, and Fig.10 shows the performance comparison with existing methodologies such asOEM (original EM), PSEM[21], and Existing DBSCAN.
Performance Measures: There are three measures such as, precision, recall and accuracy are compared to know the performance of proposed approach.
0 20 40 60 80 100
52.9
90.4 91.57 92.45
Ac
cu
rc
ay
valu
es in
%
Various Approaches
0 10 20 30 40 50 60 70 80 90
47.5
86.9 88.47 89.58
Re
call
Valu
es in
%
Various Approaches
0 10 20 30 40 50 60 70 80 90 100
OEM PSEM Existing
DBSCAN
IDBSCAN
51.1
94 94.89 95.42
P
re
cis
ion
valu
es in
%
Various Approaches
Acc = TP TN / P N or TP TN / TP TN FP FN Recall is calculated by using following formula
Recall={ {relevantdocument ∩ retreiveddocument}1 / relevantdocument}orTP/ TP FN
Precision is calculated by using following formula
Precision={ {relevantdocument ∩ retreiveddocument} / retreiveddocument}orTP/ TP FP
Fig. 7. Position of wireless sensor nodes[20]
4.1 Accuracy Comparison:
The following Fig.8 shows the comparison of accuracy values with existing approaches. The OEM gives 52.9% of accuracy. The PSEM gives 90.4% of accuracy. The existing DBSCAN value provides 91.57% and The IDBSCAN shows 92.45% of accuracy which is efficient than other compared methods.
Fig. 8. Comparison of Accuracy
4.2 Recall Comparison:
The Fig.9 demonstrations the comparison of recall values with existing approaches. The OEM gives 47.5% of recall value. The PSEM gives 86.9% of recall value. The existing DBSCAN value provides 88.47% and The IDBSCAN shows 89.58% of recall which is efficient than other compared methods.
Fig. 9. Comparison of Recall
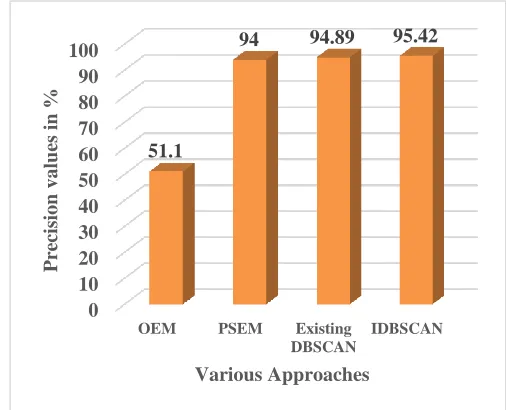
4.3 Precision Comparison:
The Fig.10 illustrates the comparison of precision values with existing approaches. The OEM gives 51.1% of precision value. The PSEM gives 94% of precision value. The existing DBSCAN value provides 94.89% and The IDBSCAN shows 95.42 % of precision which is efficient than other compared methods.
Fig. 10. Comparison of Accuracy
5
C
ONCLUSION1008 trained by using normal data which is clustered in high-
density portions. The novel of this proposed IDBSCAN algorithm is Minimum spanning tree is calculated by using Improved Kruskal Algorithm (IKA). There are three performance metrics are calculated to prove its effectiveness. The accuracy, Recall and precision value of proposed approach shows, 92.45 % 89.58% and 95.42% respectively. Thus the anomaly is found effectively and security of network is improved.
R
EFERENCES[1] M. Dong, K. Ota, and A. Liu, "RMER: Reliable and energy-efficient data collection for large-scale wireless sensor networks," IEEE Internet of Things Journal, vol. 3, pp. 511-519, 2016.
[2] H. M. A. Fahmy, "WSNs applications," in Wireless Sensor Networks, ed: Springer, 2016, pp. 69-213.
[3] A. Bouguettaya, Q. Yu, X. Liu, X. Zhou, and A. Song, "Efficient agglomerative hierarchical clustering," Expert Systems with Applications, vol. 42, pp. 2785-2797, 2015. [4] A. Bryant and K. Cios, "RNN-DBSCAN: A density-based
clustering algorithm using reverse nearest neighbor density estimates," IEEE Transactions on Knowledge and Data Engineering, vol. 30, pp. 1109-1121, 2018.
[5] J. Hou, H. Gao, and X. Li, "DSets-DBSCAN: a parameter-free clustering algorithm," IEEE Transactions on Image Processing, vol. 25, pp. 3182-3193, 2016.
[6] M. Xie, J. Hu, and S. Guo, "Segment-based anomaly detection with approximated sample covariance matrix in wireless sensor networks," IEEE Transactions on Parallel and Distributed Systems, vol. 26, pp. 574-583, 2015. [7] E. Hoque, R. F. Dickerson, S. M. Preum, M. Hanson, A.
Barth, and J. A. Stankovic, "Holmes: A comprehensive anomaly detection system for daily in-home activities," in 2015 International Conference on Distributed Computing in Sensor Systems, 2015, pp. 40-51.
[8] A. Abid, A. Kachouri, and A. Mahfoudhi, "Outlier detection for wireless sensor networks using density-based clustering approach," IET Wireless Sensor Systems, vol. 7, pp. 83-90, 2017.
[9] H. Ozkan, F. Ozkan, and S. S. Kozat, "Online anomaly detection under Markov statistics with controllable type-I error," IEEE Transactions on Signal Processing, vol. 64, pp. 1435-1445, 2016.
[10] N. Chitradevi, V. Palanisamy, K. Baskaran, and K. Swathithya, "Efficient density based techniques for anomalous data detection in wireless sensor networks,"
淡江理工學刊, vol. 16, pp. 211-223, 2013.
[11] J. Shen, X. Hao, Z. Liang, Y. Liu, W. Wang, and L. Shao, "Real-time superpixel segmentation by DBSCAN clustering algorithm," IEEE Transactions on Image Processing, vol. 25, pp. 5933-5942, 2016.
[12] M. Zolotukhin, T. Hämäläinen, T. Kokkonen, and J. Siltanen, "Analysis of http requests for anomaly detection of web attacks," in 2014 IEEE 12th International Conference on Dependable, Autonomic and Secure Computing, 2014, pp. 406-411.
[13] D. Juliette, R. Gilles, and O. Philippe, "Online and Scalable Unsupervised Network Anomaly Detection Method," IEEE Transactions on Network and Service Management, pp. 1-15, 2016.
[14] A. Karami and R. Johansson, "Choosing dbscan parameters automatically using differential evolution,"
International Journal of Computer Applications, vol. 91, pp. 1-11, 2014.
[15] F. Kuang, W. Xu, and S. Zhang, "A novel hybrid KPCA and SVM with GA model for intrusion detection," Applied Soft Computing, vol. 18, pp. 178-184, 2014.
[16] S. Manaseer, A. Alawneh, and H. Almogdady, "SOCIAL MEDIA AS A TOOL IN EDUCATION: A CONTENT DESCRIPTIVE ANALYSIS," International Journal of Information, Business and Management, vol. 11, pp. 212-218, 2019.
[17] S. M. Erfani, S. Rajasegarar, S. Karunasekera, and C. Leckie, "High-dimensional and large-scale anomaly detection using a linear one-class SVM with deep learning," Pattern Recognition, vol. 58, pp. 121-134, 2016. [18] O. Salem, A. Guerassimov, A. Mehaoua, A. Marcus, and
B. Furht, "Anomaly detection in medical wireless sensor networks using SVM and linear regression models," International Journal of E-Health and Medical Communications (IJEHMC), vol. 5, pp. 20-45, 2014. [19] S. Agrawal and J. Agrawal, "Survey on anomaly detection
using data mining techniques," Procedia Computer Science, vol. 60, pp. 708-713, 2015.
[20] "http://db.csail.mit.edu/labdata/labdata.html.."