IJSRR, 4(2) April - June. 2015 Page 51
Research article Available online www.ijsrr.org
ISSN: 2279–0543
International Journal of Scientific Research and Reviews
Pattern of Anemia in Elderly Age Group
S. Amarneel and N. Sheth
Department of pathology, Government Medical College , Bhavnagar -364001,Gujrat, INDIA. Email id : [email protected]
________________________________________________________________________________________
ABSTRACT
:
To study hematological profile and morphological pattern of anemia in patient ageing 60 to 90 year. Total 80 patients were included who attended clinical OPD of Sir T Hospital bhavnagar. Out of 80 patient 42 (52.5%) were found to be anemic. Proportion of anemia female is 53.5% and males is 50.0%. Pattern of anemia was based on RBC indices and correlated with peripheral smear. Normocytic anemia was the commonest pattern 57.13%. There is a need to diagnose anemia and confirm its pattern in elderly age group to improve overall outcome.
Keywords: Anemia Elderly, Proportion, Pattern.
KEY WORDS
: Pattern of anemia in elderly age group.*Corresponding Author:
S. Amarneel, N. Sheth
Department of pathologyIJSRR, 4(2) April - June. 2015 Page 52
INTRODUCTION
Anemia is common in elderly age group and is easily overlooked since symptoms such as
fatigue, weakness, shortness of breath may be attributed to the ageing process itself but decline in
hematological parameter with age is not necessarily as a result of normal ageing. 3,7 n elderly population
anemia has more severe complication than younger population. 3 herefore anemia should never be
accepted as consequence of normal ageing process and should be thoroughly investigated .
Using WHO criteria for diagnosis of anemia the prevalence was found to range from 8 to 44
percent, with highest prevalence in men ageing 85 and above 4. As reported in Indian cross sectional
studies prevalence varies from 6% to 30% in male and 10% to 20% in female. 6Many studies indicate
that as the age advances prevalence of anemia also increases and it is more common in elderly female 5.
Despite of high prevalence of anemia in elderly only a few studies have focused on affect of anemia on
the overall outcome of elderly patient.
MATERIAL AND METHOD
This study was a hospital based observational study including total 80 patient from 60 to 90
years age group presenting at clinical OPD at sir T Hospital. Both male and female were included in
this study . A detailed history, complete general and physical examination was done. Detailed laboratory
studies hemoglobin and diagnostic tests were done to fix the pattern of anemia. Diagnosis of anemia
were based on WHO criteria (hemoglobin <13g/dl for male and <12 g/dl female)[4]. Anemia pattern
was established by RBC indices and further confirmed by peripheral smear. Normocytic anemia was
defined when MCV was between 80 to 100 fl, microcytic anemia when MCV is below 80 fl and
macrocytic anemia when MCV above 100 fl. Dimorphic anemia was diagnosed when RDW is more
than normal range (11-15%) and confirmed by peripheral smear. Patient having malignancy or any
blood related severe disorder were not included in this study.
RESULTS
Present study included patients ageing from 60 to 90 years. Mean age was 68.2 years. Maximum
number of patients were lying in 60 to 65 year age group. Out of 80 cases selected 42 were found to be
anemic i.e. 52.5%. 56 were female and 24 were male patients of total . 30 out of 56 female patients
IJSRR, 4(2) April - June. 2015 Page 53
Table 1 Table for age and sex distribution of all patient included in study
Age group Female (total – 56) Male ( total – 24)
60 – 65 years 24 (42.85%) 8 (33.33%)
66 – 70 years 12 (21.42%) 5 (20.83%)
71 – 75 years 10 (17.85%) 3 (12.5%)
76 – 80 years 5 (8.92%) 4 (16.66%)
81 – 85 years 3 (5.35%) 3 (12.5%)
86 – 90 years 2 (3.57%) 1 (4.16%)
Table 2 Table for age and sex distribution of anemic patient.
Age group Female Male
60 – 65 years 10 of 24 ( 41.6%) 3 of 8 ( 37.5%)
66 – 70 years 4 of 12 ( 33.33%) 2 of 5 (40%)
71 – 75 years 8 of 10 ( 80%) 2 of 3 (66.6%)
76 – 80 years 3 of 5 ( 60%) 2 of 4 ( 50%)
81 – 85 years 3 of 3 (100%) 2 of 3( 66.6%)
86 – 90 years 2 of 2 ( 100%) 1 of 1 (100%)
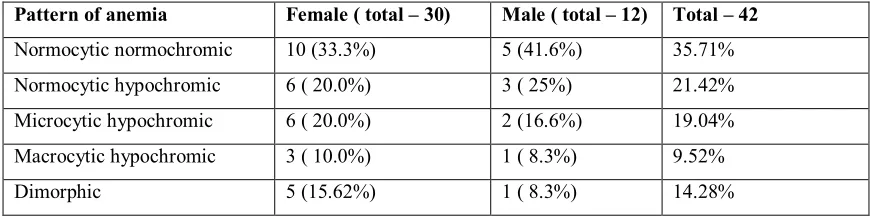
Pattern of anemia was established by RBC indices and confirmed by peripheral smear. Present
study highlighted that normocytic was the commonest type of anemia among elderly constituting
57.13% of total anemic patient including both sexes. Microcytic hypochromic followed it with 19.04%
than macrocytic hypochromic 9.52% and dimorphic anemia 14.24%.
Table 3 Table for distribution of pattern of anemia
Pattern of anemia Female ( total – 30) Male ( total – 12) Total – 42
Normocytic normochromic 10 (33.3%) 5 (41.6%) 35.71%
Normocytic hypochromic 6 ( 20.0%) 3 ( 25%) 21.42%
Microcytic hypochromic 6 ( 20.0%) 2 (16.6%) 19.04%
Macrocytic hypochromic 3 ( 10.0%) 1 ( 8.3%) 9.52%
IJSRR, 4(2) April - June. 2015 Page 54
DISCUSSION
Anemia is a common condition in elderly patients and its prevalence increases with age. On most
occasion it is wrongly attributed to normal ageing process. Anemia can impair quality of life as well as
cognitive and physical functions and is a co-morbid condition that affects other diseases(e.g. heart
disease, cerebrovascular insufficiency) and is even associated with a risk of death1.Thus, anemia should
not be accepted as a consequence of aging and must be explored .
Etiology of anemia is frequently difficult to determine even after extensive investigation in elderly patient
2
.But anemia of chronic disease was found to be the most common form of anemia in elderly which may
be the cause of high prevalence of normocytic anemia.
Amit Bhasin et al study showed that most common pattern of anemia in 60 to 70 yr age group was
normocytic 3. Our study closely correlate with this study. In the present study age group 60-70 years were
least affected by anemia i.e. 41.6% were as patient of aging 80- 90 years were most affected i.e. 91.65% .
Commonest pattern of anemia in present study was normocytic anemia i.e. 57.13%. Hee-seon Kim et. al.
study correlates with present study 7. Chul won choi et. al. in their study of anemia in elderly have
observed 171 out of 1254 patient to be anemic. Out of them 144(11.4%) were women and 27(2.1%) were
men. A significant difference in prevalence of anemia has been found among the age 60-70 years, 70-80
years, and 80-90 years. The most common pattern of anemia in their study has been found to be
normocytic anemia i.e. 93.5% and 3.5% of them being microcytic, and 3% were macrocytic anemia8.
Present study anemia in males (50%) is less as comapered to females(53.5%) which correlates with
Chulwon choi et. al. study. But differs from Guralink J.M et.al study which shows prevalence of anemia
in male (11.0%) is more as compared to female ( 10.2%) in age group 60 and above9. And also differ
from National Health and Nutrition Examination Survey (NHANES III) carried out in the United States
which revealed prevelance of anemia is 11% of male and 10.2% of female in people ageing 65 and above
10
. However this study was a hospital based study in comparision to population based study of NHANES
III.
Anie et.al. has diagnosed anemia in 36% of males, being normocytic in 83%, microcytic in 14%
and macrocytic in 3% as compared to 44% of women of which 80% is normocytic 16% is microcytic and
4% is macrocytic 11. In present study anemia in male patients was 50% of all of which 76.66% is
normocytic, 16.66% was microcytic, 8.3% was macrocytic and 8.33% was dimorphic. As compared to
IJSRR, 4(2) April - June. 2015 Page 55
microcytic, 10% was macrocytic and 15.62% was dimorphic. Nisseson et.al. Study has revealed that
prevalence of anemia in general elderly population has been 7.5% for male and 20% for female12 . Present
study also correlates by showing prevalence of anemia more in female as compared to males in elderly age
group.
CONCLUSION
Diagnosing anemia and confirming its pattern is important since it help in directing further
investigation reaching to the etiology and most importantly help in treatment. Although many anemic
elderly patients can be diagnosed with nutritional deficiency, anemia of chronic inflammation or co
morbid diseases, the etiology of anemia in a significant fraction remains obscure Non specific
symptoms like fatigue and weakness should not be ignored attributing it to normal aging process as it
can be important signal to presence of anemia .
REFERENCES
1. Woodman R, Ferrucci L, Guralnik J. Anemia in older adults. Curr Opin Hematol.
[PubMed] 2005;12:123-8.
2. Andrès E, Loukili NH, Noel E, et al. Vitamin B12 deficiency in elderly
patients. CAMJ.2004;171:251–60.
3. Bhasin a, Rao MY. Charecteristics of anemia in elderly: A hospital based study in south India .
Indian journal of hematology and blood transfusion 2011 ;27(1):26-32
4. World Health Organization. Definition of an older or elderly person. Retrieved August 29,
2010.
5. Ferrucci L, Semba RD, Guralnik JM, et al. Proinflammatory state, hepcidin and anemia in older
persons. Blood. 2010;115:3810 3826
6. Helda Khusun, Ray Yip, Werner Schultink and Drupadi HS Dillon. World Health Organization
Hemoglobin Cut-Off Points for the Detection of Anemia. Journal of Nutrition 1999;
129:1669-74.
7. Hee-Seon Kim and Byung-Kook Lee. Cross-sectional study on the prevalence of anemia
IJSRR, 4(2) April - June. 2015 Page 56
8. Choi CW, Lee J, Park KH, Yoon SY, Choi IK, Oh SC, Seo JH, Kim BS, Shin SW, Kim YH,
Kim JS. Prevalence and Characteristics of Anemia in the Elderly Am J Hematol.
Cross-Sectional Study of Three Urban Korean Population Samples. 2004; 77(1):26-30.
9. Guralnik Jack M, Eisenstaedt RS, Luigi Ferrucci. Prevalence of anemia in persons 65 years and
older adults. Blood 2004; 104:2263-9.
10. Chernetsky A, Sofer O, Rafael C. Prevalence and etiology of anemia in an institutionalized
geriartic population. Harefuah, 2002; 141:591-4,667.
11. Ania BJ, Suman VJ, Fairbanks VF.Incidence of anemia in older people: an epidemiologic
study in a well defined population. J Am Geriatric Soc 1997; 45: 825-31.
12. Nissenson AR, Goodnough LT, Dubois RW. Anemia: not just an innocent by stander? Arch