Research artical Available online www.ijsrr.org
ISSN: 2279–0543International Journal of Scientific Research and Reviews
An Analysis of Performances of Indian Banks in Promoting
Microfinance through SHG Bank Linkage Program
*Dipti Baishya
1and Ratul Mahanta
1,
1
Department of Economics, Gauhati University, Guwahati, 781 014, Assam, India Email: diptib150@ gmail.com, rmeco@gauhati.ac.in
ABSTRACT:
The paper examines performance of banking agencies in promoting SHG Bank Linkage Program in India and compares progress of the program in all six Indian regions. To assess the performance of banks in SHG Bank Linkage Program, four factors are taken into consideration namely – Self Help Group saving linkage, Self Help Group credit Linkage, Self Help Group outstanding loan amount and Non Performing Assets of Self Help Group loans. It is found that in India, performance of commercial bank is better in terms of saving mobilization and outstanding loan amount and in terms of credit disbursement and Non Performing Assets against SHG loan, the performance of Regional Rural Bank is better. SHG Bank Linkage Program has an encouraging growth in all six regions although the rates of growth vary from region to region. Southern Region has outperformed other regions in SHG Bank Linkage Program since its inception to till date. Poor performance in some regions has resulted in high Non Performing Assets rate against SHG loans, due to which long-term sustainability of this program is at risk. By narrowing down the gap between loan disbursement amount and outstanding loan amount, in turn, will help in regulating the NPA rate.
KEYWORDS
: Self Help Group, Saving mobilization, Loan disbursed, outstanding loan amount,Non-Performing Assets.
*Corresponding author:
Dipti Baishya
Research Scholar, Department of Economics, Gauhati University
House No 33, Kali Mandir Path, Beharbari, Guwahati-29
E-mail address:diptib150@gmail.com
1.
INTRODUCTION:
Self Help Group Bank Linkage Program (SBLP) came into existence in 1992 and within a short
span of time, it has emerged as the largest microfinance program in the world as compared to the
other approaches in vogue primarily due to its bearable interest rates and resilient repayment terms.
Till 31st March 2017, SBLP has covered 10 crore families in India. This has been achieved through
85 lakh SHGs with savings deposits of rupees 16,114 crores and 48.4 lakh groups with the
collateral-free loan, of which, 88% are exclusively women groups1. SBLP has resulted in a change in the
bankers’ point of view towards the credibility of the poor. It is pertinent to mention that poor women
living in Indian villages now control financial business with turnover of more than Rs. 1 lakh crore
inclusive of deposits and credits, which is much more than most Multi-National Corporations in
India2. On the other hand, the number of Micro Finance Institutions (MFI) and the other models of
microfinance have gone up from a few in numbers to several hundred with around 40 million clients
benefitting from it as in March 20163. Amongst SBLP and MFI, the former is the most cost-effective
approach benefitting the poor. It is due to the fact that MFI’s operating costs are high, as the
workforce employed in the field is large in number. The operating cost eventually gets transferred to
the end clients in form of high-interest rates, processing charges etc. As a result, the ultimate goal of
poverty alleviation has been overlooked by most of the MFIs in the quest for expansion and profit
maximization4. The shortcomings of MFI make SBLP a dominant microfinance paradigm in India5.
Microfinance program in India is being implemented by Scheduled Banks namely Commercial
Banks (CB), Regional Rural Banks (RRB) and Cooperative banks (COB) as well as other MFIs.
Formal institutional agencies like Land Development Bank, Housing Finance Institutions, Urban
Cooperative Banks (UCB), and Urban Credit Cooperative Societies (UCCS) have no significant role
in promoting SBLP. The success rate of SBLP has not been uniform throughout the nation. In
southern India, SBLP is seen as successful approach while in the northern region and northeastern
region its performance is pitiable6. Availability of better infrastructural facilities is one of the reasons
of the high success rate of SBLP is a southern region7. Saving mobilization, loan disbursement,
outstanding loan amount and Non-Performing Assets (NPA) are the four factors that quantify the
performance of the banking institutions in promoting SBLP. A higher number of SHG saving are
linked to the banks every year, new and old SHG’s facilitating with fresh and repeated loans, low
outstanding loan rate with banks and low NPA against SHG loans indicates the formation of
high-quality SHG which will be sustainable in the long run. These factors also indicate better performance
Microfinance has made tremendous progress in India over the years and has become a
household name in view of the multi-pronged benefits from microfinance services to the poor in
India 8. SBLP, the holistic microfinance program of India has reached to the needy and poor Indians
by the vast Indian banking network by liberalizing the norms of lending, so as to make them
bankable 2. But the crisis in Indian microfinance which started in South India at the beginning of this
decade has done incalculable damage to the industry. However, it has sustained itself on the basis of
its reputation and trust 9.
One of the drawbacks of SBLP movement is, it has not progressed at the same pace in all six
regions of India and there is also variation in growth and coverage between different states of the
same region10. The SBLP reach-out in the southern region is significantly higher while it is
significantly low in the north-east region. Various reasons are associated with this low penetration of
SBLP in the northeast region. However one of the prime reasons that can be cited is the inadequate
bank network. Major portion of the growth in the banking network is shared by the southern region.
On the other hand, the spread of SHGs in both north and the north-eastern region is poor 11. Social
backwardness and fewer NGO activities are also some of the reasons for low SBLP penetration
besides bad banking network8. Lack of proper communication, financial literacy, and geographical
positions as well as the efficiency of banking agencies are some other prime reasons for the
region-wise disparity in terms of SBLP penetration 12.
As far as the agency-wise performance in promotion of SBLP in six regions of India is
concerned, there is a disparity in the findings of different studies suggests. Considering public and
private sector commercial banks, the cost of providing microfinance in a rural area is more for the
private sector than public sector banks 13. The commercial bank has been playing a vital role in
providing credit facility to SHG members through SBLP in India 14. Whereas some studies
emphasized on the better performance of cooperative banks in terms of savings, loan disbursement
and loan outstanding of women SHGs 15. They further give emphasis to on better performance of
RRB in terms of NPA. Contradictorily another study opine on poorer performance of RRB in
promoting SBLP than Commercial Banks and Cooperative Banks 12. On a similar note one more
study mentioned about a downward trend of RRB in tapping SHG savings as well as in loan
disbursements and has mentioned about the mutual benefit of bank and SHG as a primary
requirement for successful implementation of SBLP2.
Sustainability of SBLP is worrying due to the high rate of NPA against SHG loans. Of the
high level of outstanding loan amount which leads to high NPA 16. Increase in the outstanding loan
amount each year over the previous year is a serious matter of concern 17. Channelization of SHG
loans for the productive purpose would help to increase the income of groups which in turn will
improve their repayment capacity and will also be helpful in narrowing down the gap between
outstanding loans and loan disbursed 15.
The ongoing discussion is indicative of the fact that SBLP is the key strategy adopted in India by
NABARD to spread microfinance to rural areas through banking agencies. Notwithstanding the fact,
that progress of SBLP in some regions is questionable due to the poor performance of banking
agencies in promoting SBLP. However, none of the studies covered all banking institutions which
deal with microfinance and all four parameters to measure the national as well as the regional
progress of the program. The aforementioned studies give a partial picture of the progress of the
SBLP and performance of banking agencies in India and its regions. The novelty of the present study
is that it tries to assess the performance of all three banking agencies in promoting SBLP in India on
the basis of all the four parameters. Further, the study tries to give a comparison of the rate of
progress of SBLP in all the six regions of India with each other and also with the national average
considering all the four parameters.
2.
METHODOLOGY:
2.1 Conceptual frameworks:
According to World Bank, 2014 revised poverty calculation methodology, India with 17.5 %
of total world’s population has 20.6% of world’s poorest in the year 2011. India is striving hard to
tackle population growth and uneven distribution of wealth. The failure of banking institutions in
delivering credit to the poor has resulted in the emergence of a new and innovative institutional
structure in India nearly two and half decades back. This structure, commonly known as
microfinance, is an endeavour to reach the poor and address their financial needs. Microfinance
refers to the supply of microloans, savings, and other basic financial services like insurance to the
poor without collateral requirements
.
The ideology of microfinance was to provide relief to poorborrowers from the exploitation of traditional moneylenders who charged huge interest rates against
loans. The concept of microfinance originated about 38 years back and was propounded by a famous
economist Prof. Mohammed Yunus. Later with his initiative, Gramin Bank started lending money to
small groups of people with similar social and economic backgrounds where “standard collateral”
was replaced by “social collateral’’. Individuals were solely responsible for repayment of the
repayment of the loan by individuals in a responsible manner. The problem of free riding within the
group is ruled out through bonds between the group members. Loan to the poor was restricted under
icrofinance scheme as the poor have a tendency to free ride 9.
There are two main models of microfinance in India namely MFI and SHG bank linkage program
that link the formal financial sector with low-income households. In India, the first Micro Finance
Institution was established in the year 1974, as an Urban Cooperative bank in Ahmadabad at the
initiative of a few poor women working in an unorganized sector who were members of a Self
Employed Women Association (SEWA). SEWA was registered as a trade union in Gujarat with an
objective to increase income, employment and an access to obtain social security. Structurally MFI’s
can be divided into following four types namely-
NGO MFIs that are registered under the Societies Registration Act, 1860 or the Indian Trusts
Act, 1880.
Cooperative MFIs which are registered under the State Cooperative Societies Act or mutually
aided Cooperative Societies Act or Multi-State Cooperative Societies Act.
NBFC MFIs which are incorporated under Section 25 of Companies Act, 1956.
NBFC MFIs that are incorporated under the Companies Act, 1956 and registered with RBI.
MFI’s are very desperate in reaching out to the poor with well-structured distribution channels as
compared to formal banking systems. But various anomalies were observed in 2009-10 in MFIs
operating in southern India particularly in Andhra Pradesh (AP) where it was very prominent. The
high rate of interest coupled with the increased availability of credit from a large number of MFI’s
has resulted in overlapping of loans. Borrowers took loans from one MFI to pay back another MFI
which resulted in a debt-trap for the poor borrowers. The high rate of interest and coercive means of
recovery lead to some cases of suicide in southern India.
SBLP was started by NABARD in India in the year 1992 with the objective of enabling the
poorest of the poor to have access to financial resources and thereby increase their household income
and achieve sustained livelihood10. At present SBLP is the world’s largest microfinance program.
SHG’s are formed and linked to formal financial agencies in three different ways under SBLP which
are
namely-Model – 1: In this model, the bank itself acts as a Self Help Group Promoting Institution (SHPI).
Model – 2: In this model, groups are formed by NGOs (in most of the cases) or by government
agencies. The groups are nurtured and trained by these agencies.
Model – 3: Banks act as funding agencies only and others agencies like NGO and volunteers act as
Self Help Group (SHG) is formed by 10 to 20 people with the objective to generate a common fund
wherein each member contributes an equal amount of savings on a regular basis. All money related
decisions and transactions carried out during the group meetings. Later a savings account is opened
with the bank in the name of the SHG which jointly operated by two or three nominated leaders of
the SHG. Newly-formed SHGs are usually in the queue to receive their first loan. After receiving the
loan the group members can recycle the loan amount within the group in a pre-decided interest rate
as the bank loans are often taken for a longer duration. The credit taken from banks often rotates
within or outside the group about 1.5-2 times before it is fully repaid to the bank, that too before the
due dates. Thus, the credit issued by the banks to SHGs serves as a multiplier to grow its corpus.
Members of the group take credit both for consumption purpose as well as for investing in the new or
existing business. Many SHGs do not approach banks for a loan as some have adequate savings and
grants provided by NGOs or alternatively, in some highly deprived areas, SHG members do not have
opportunities for investment in viable economic activities. SBLP progressed in India at a tremendous
pace due to the massive network of institutions including the CB, RRBs, COB and NGOs.
The whole process of lending and borrowing by SHG from formal financial institutions can be
divided into four parts. First, SHG’s saving mobilization by creating a saving account in the bank;
second, loan disbursed to the SHG by the bank; third, SHG loan outstanding with the bank; and
finally non-performing assets of SHG loans. These four parameters give an idea of how banks are
performing in making SBLP successful and how the regions are progressing in connecting rural
masses to the formal banking sector as well as helping the individuals in making economically
self-sufficient.
2.2
Study area:
The proposed study covers India and its six regions. The six regions are namely Eastern Region
(ER), Western Region (WR), Northern Region (NR), Southern Region (SR), North Eastern Region
(NER) and Central region (CR). The regions are categorized according to Zonal Councils of India.
These Zonal Councils were set up vide Part-III of the States Reorganization Act, 1956.
2.3
Data source and Time Frame:
Secondary data has been used in for the present study. The data has been collected from various
issues of ‘Status of Microfinance in India’ report prepared by ‘Micro Credit Innovations Department’
of NABARD. Based on the availability of data, the national level information has been collected
2.4
Methods:
The present study is descriptive in nature. As such descriptive statistics are used for presenting
the data particularly through graphs and tables. Basic statistical tools such as ratio, percentage and
compound annual growth rate (CAGR) have been used. The study analyses the performance of
SBLP in India and its six regions based on four parameters namely savings of SHG with banks, loan
disbursed by banks to SHGs, SHG loan outstanding with banks and NPA of SHG loans. The study
also analyzes CB, RRB and COB’s performance in promoting SBLP.
3. RESULTS AND DISCUSSIONS:
The results and discussions has been divided into four sub-sections namely saving
mobilization, loan disbursement, loan outstanding and NPA in order to present the explanation more
meaningful and systematic way.
3.1 Saving mobilization:
Table 1 and figure 1 represents per SHG Saving as on March 31st, 2017.
Figure 1:“Per SHG Saving as on March31st, 2017”
Source: Compiled from the various Annual Report on Status of Microfinance in India, NABARD [18]
From table 1 and figure 1 it is evident that among all banks, CB has the highest CAGR in
terms of per SHG savings. More than half of the SHG account and saving balances are with CB. It is
due to CB’s monopoly in promoting SBLP in early stage and its vast branch network in India as is
evident from Table 1. In the year 2012 per SHG savings of all the three banking agencies decreased
but regained gradually in the later years as is evident in Figure 1. Of the various factors, the prime
factor responsible for the decrease is “Data Cleansing” by banks to maintain accuracy in SHG
accounts. Another factor responsible for the decrease in per SHG savings is the introduction of
Table 1: “Per SHG Saving as on March 31st,
2017” S.
No
Year/
Bank CB RRB COB
1 2009 7813 12222 8302
2 2010 9067 7139 11357
3 2011 9785 7238 11696
4 2012 8993 6113 9047
5 2013 13574 7493 9630
6 2014 16488 9284 1009
7 2015 16035 10859 14876
8 2016 21821 11012 14430
9 2017 22883 14042 14956
10 CAGR 12.27% 8.82% 3.50%
0 5000 10000 15000 20000 25000
Commercial Banks
Regional Rural Banks
Cooperative Banks
National Rural Livelihood Mission (NRLM) by central Government in 2011 which lead to the
gradual decline of Sampurna Gramin Swarojgar Yojana (SGSY) SHG accounts.
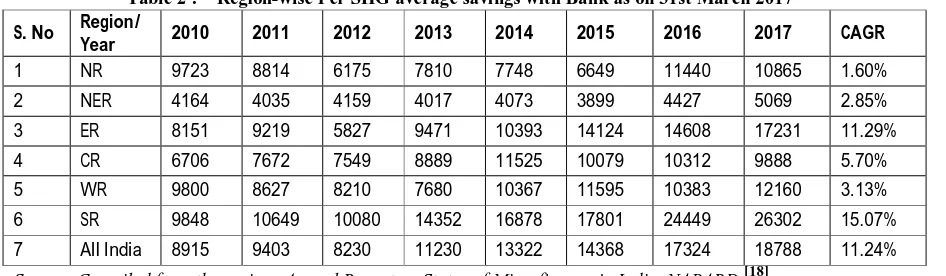
Table 2 represents the region-wise per SHG average savings with Bank as on 31st March 2017.
Source: Compiled from the various Annual Report on Status of Microfinance in India, NABARD[18]
As seen in Table 2 the CAGR of per SHG average savings is highest in SR and lowest in NR
followed by NER. The early start of SBLP and high banking network in SR and low network and
late start in NR and NER are some of the reasons that can be cited for the observed trend. Moreover,
NER has lowest per SHG average savings over the years due to less number of high-grade old SHG
with high saving balance. In 2012 per SHG average savings in all regions except for NER has
decreased. This downward swing is the outcome of “data cleansing” by banks and “Indian
microfinance crisis” which though started in MFI model of SR but later affected SBLP model too
and spread to other regions. But NER has not been affected due to the low expansion of MFI model
in this region.
3.2 Loan disbursement:
Table 3 and Figure 2 represent the Per SHG Loan Disbursed. As seen in table 2, CAGR of
per SHG loan disbursed by RRB is highest and lowest by CB with a small margin in among all the
three banking agencies.
Table 2 : “Region-wise Per SHG average savings with Bank as on 31st March 2017” S. No Region/
Year 2010 2011 2012 2013 2014 2015 2016 2017 CAGR
1 NR 9723 8814 6175 7810 7748 6649 11440 10865 1.60%
2 NER 4164 4035 4159 4017 4073 3899 4427 5069 2.85%
3 ER 8151 9219 5827 9471 10393 14124 14608 17231 11.29%
4 CR 6706 7672 7549 8889 11525 10079 10312 9888 5.70%
5 WR 9800 8627 8210 7680 10367 11595 10383 12160 3.13%
6 SR 9848 10649 10080 14352 16878 17801 24449 26302 15.07%
Figure 2: Per SHG Loan Disbursed
Source: Compiled from the various Annual Report on Status of Microfinance in India, NABARD [18]
In 2014-15 per SHG loan disbursement of CB and RRB has reduced and the same pattern
was observed for COB in the preceding year. This can be accredited to the high growth rate in the
number of SHG credit link than the growth of share in credit disbursement.
Table 4 Represents Per SHG Average Bank loan amount region-wise. It is seen from table 4 that CR
has lowest CAGR whereas WR has highest in terms of average per SHG loan disbursement.
Table 4: “Per SHG Average Bank Loan Amount Region-wise” S
No
Region
/ Year 2009-10 2010-11 2011-12 2012-13 2013-14 2014-15 2015-16 2016-17 CAGR
1 NR 81962 88843 109080 109412 117269 97777 126746 123293 6.01%
2 NER 58241 81654 88483 71606 79125 84056 84375 98134 7.74%
3 ER 55513 65402 80718 70570 50783 93690 84709 95193 8.01%
4 CR 81199 124667 121343 108895 93092 101536 141272 82864 0.29%
5 WR 43383 68068 74508 100803 98404 120279 167636 139310 18.14%
6 SR 110880 151459 179493 205262 235718 213083 258996 272926 13.73%
7 All
India 91083 121623 144046 168757 175768 169608 203495 204313 12.23%
Source: Compiled from the various Annual Report on Status of Microfinance in India, NABARD [18]
Further table 4 reveals that though Per SHG Average Bank Loan Amount of SR is highest
during the study period, but in 2014-15 it had a downward swing which was offset in the 2015-16. It
was due to the decline in the share of the number of SHGs which has reduced from almost half
(49.8%) in 2013-14 to 44.9% in 2015-16. Rationalization of data by banks, especially in Kerala,
Tamil Nadu and Pondicherry, has resulted in decline number of SHG (Status of Microfinance in
Table 3: “Per SHG Loan Disbursed” S.
No
Year/
Bank CB RRB COB
1 2008-09 80284 78851 50225
2 2009-10 100104 88648 57755
3 2010-11 145360 108028 70985
4 2011-12 165701 165331 64738
5 2012-13 182109 180337 91502
6 2013-14 209094 188833 63838
7 2014-15 202738 147993 101732
8 2015-16 222482 194999 128253
9 2016-17 217629 208290 128097
10 CAGR 10.19% 11.27% 10.47%
0 50000 100000 150000 200000 250000
Commercial Banks
Regional Rural Banks
Cooperative Banks
India, 2015-16). Reduction in the share of the number of SHG with the bank has resulted in a
reduction of a number of SHG credit linked so has the credit amount. NR, NER, ER and CR has low
CAGR of per SHG average loan disbursement below the national average. Bank provides a small
loan at the time of first credit linkage which drags down the average credit per group in those states
where SBLP had a started late [19]. On the other hand, SR has a larger number of matured SHG with a
good track record of on-time loan repayment. Such SHG’s are eligible for a higher amount of
repeated loan facilities.
3.3 Loan outstanding:
Table 5 and Figure 3 represent the Per SHG Outstanding Loan Amount. Figure 3 Per SHG
loan outstanding under all three agencies is increasing over the year.
Fig 3: Per SHG outstanding Loan Amount
Source: Compiled from the various Annual Report on Status of Microfinance in India, NABARD [18]
As seen from Table 5 CAGR of per SHG outstanding loan amount of CB is highest and lowest in
COB.
Table 6 represents Per SHG Average Bank Loan outstanding Region-wise. The average per SHG
loan outstanding was highest in SR over the years.
Table 5: “Per SHG Outstanding Loan Amount”
S No Year/
Bank CB RRB COB
1 2008-09 57045 53474 31470
2 2009-10 62294 55707 33901
3 2010-11 71678 58002 42303
4 2011-12 98625 66617 43254
5 2012-13 100792 79286 46138
6 2013-14 117507 90048 53209
7 2014-15 132233 108683 55884
8 2015-16 141453 111483 64404
9 2016-17 144809 118622 66996
10 CAGR 11.12% 9.91% 8.89%
0 20000 40000 60000 80000 100000 120000 140000 160000
Commercial Banks
Regional Rural Banks
Cooperative Banks
Table 6: “Per SHG Average Bank Loan O/S Region-wise” S No Region/ Year
2009-10 2010-11 2011-12 2012-13 2013-14 2014-15 2015-16 2016-17 CAGR
1 NR 53455 60570 55568 54249 59840 87036 74912 63352 2.46%
2 NER 50340 46344 62307 55461 60513 58687 58646 58063 2.06%
3 ER 35958 38014 46987 54261 50509 57704 62231 66147 9.10%
4 CR 49453 65912 78884 76598 64232 56733 66604 55562 1.68%
5 WR 29936 39335 47113 49670 60982 73412 78825 75120 14.05%
6 SR 73672 80581 107799 114423 143137 161674 169499 183562 13.93%
7 All India 57795 65224 83455 88455 102273 115361 122242 127016 11.91%
Source: Compiled from the various Annual Report on Status of Microfinance in India, NABARD[18]
WR illustrates the highest CAGR in average per SHG loan outstanding and is lowest in CR
which is closely followed by NER. According to Status of Microfinance in India report 2016-17, the
ratio of the loan outstanding to loan disbursement in India as a whole has marginally increased to 1.6
from 1.5 in 2015-16. High loan outstanding to low loan disbursement implies a situation where the
repayment rate is low and many of the SHGs are not eligible for subsequent loans because of
previous outstanding loans. The ratio was found to be high at 3.3 for CR, followed by NER at 2.9
and lowest in SR. That is indicative of the fact that though average SHG loan outstanding rate is low
in CR and NER, the loan disbursement rate is even much lower than outstanding rate and this has
resulted in a speedy growth of NPA of SHG loans in CR and NER.
3.4 NPA against SHG Loan:
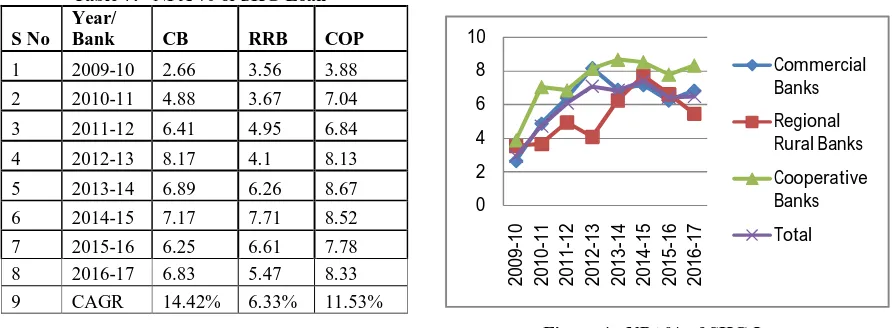
Table 7 and Figure 4 CB have the highest CAGR of NPA against SHG loan amount.
Figure 4: NPA% of SHG Loan
Source: Compiled from the various Annual Report on Status of Microfinance in India, NABARD [18] Table 7: “NPA % of SHG Loan”
S No
Year/
Bank CB RRB COP
1 2009-10 2.66 3.56 3.88
2 2010-11 4.88 3.67 7.04
3 2011-12 6.41 4.95 6.84
4 2012-13 8.17 4.1 8.13
5 2013-14 6.89 6.26 8.67
6 2014-15 7.17 7.71 8.52 7 2015-16 6.25 6.61 7.78 8 2016-17 6.83 5.47 8.33 9 CAGR 14.42% 6.33% 11.53%
Mounting outstanding loan amount with low credit disbursement rate has resulted in rapid
increase in NPA of SHG loans in CB and COP. The rate of NPA under RRB has always been
regulated except for the financial year 2013-14 and 2014-15. As revealed in figure 4 RRB has
become successful in lowering down the NPA rate again in the last two financial years. This is
indicative of the fact that though the pace of microfinance coverage of RRB is very slow, SHG
formed under RRB will be sustainable in long run.
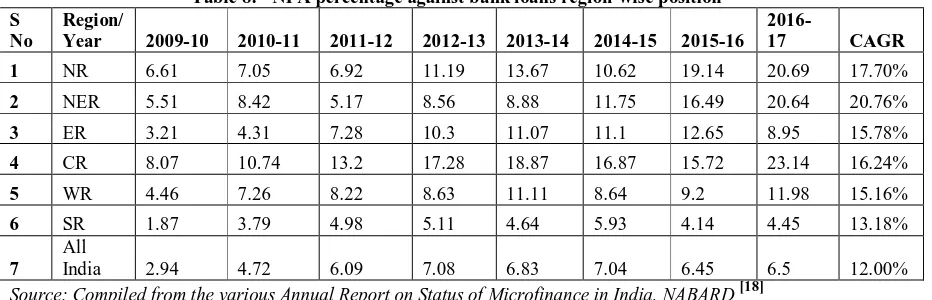
Table 8 represents the Lowest CAGR of NPA percentage against SHG loans in SB. This is
suggestive of the best quality SHG formation in the SB region which will be highly sustainable in
long run. High CAGR of NPA percentage of NER indicates low bank network in this region. This
stands as an obstacle in attracting individual attention and proper nurturing of SHG, which is because
of less number of a branch against population size and even lesser bank officials against the number
of SHGs.
Table 8: “NPA percentage against bank loans region-wise position” S
No
Region/
Year 2009-10 2010-11 2011-12 2012-13 2013-14 2014-15 2015-16
2016-17 CAGR
1 NR 6.61 7.05 6.92 11.19 13.67 10.62 19.14 20.69 17.70%
2 NER 5.51 8.42 5.17 8.56 8.88 11.75 16.49 20.64 20.76%
3 ER 3.21 4.31 7.28 10.3 11.07 11.1 12.65 8.95 15.78%
4 CR 8.07 10.74 13.2 17.28 18.87 16.87 15.72 23.14 16.24%
5 WR 4.46 7.26 8.22 8.63 11.11 8.64 9.2 11.98 15.16%
6 SR 1.87 3.79 4.98 5.11 4.64 5.93 4.14 4.45 13.18%
7
All
India 2.94 4.72 6.09 7.08 6.83 7.04 6.45 6.5 12.00%
Source: Compiled from the various Annual Report on Status of Microfinance in India, NABARD[18]
Another reason for high rate of NPA is because of not abiding by the procedures laid down by
NABARD in the formation of SHG under Government sponsored schemes. Extending credit to such
SHGs results in high NPA rate as the quality of those SHG’s is always compromised. These SHGs
has a tendency of not repaying the loan. Further the members of the SHG’s spend the loan amount
5.
CONCLUSION AND RECOMMENDATIONS:
SBLP has a positive growth in all six regions although the rates of growth vary from region to
region. SR is single-handedly taking SBLP movement forward over the years with the high rate of
SHG’s saving deposit, credit disbursement and loan outstanding and low NPA and also has a CAGR
higher than national average under all four indicators. NER has a low rate of per SHG outstanding
loan amount with a high rate of NPA against SHG loans. These findings contradict with the findings
which argue that high growth in the loan outstanding of SHG leads to an increase in NPA17. The
poorest performer in SBLP is NER with low CAGR of SHG’s credit disbursement, deposit
mobilization, outstanding loan amount and high NPA rate over the study period.
Among all the three banking agencies, CB performance is better in terms of saving mobilization
and outstanding loan amount. However, n terms of credit disbursement and NPA against SHG loan,
RRB’s performance is better. This contradicts the findings which assert a downward swing in the
performance of RRB in SBLP promotion12. The current study also reveals the poor performance of
COB in promoting SBLP despite having a strong base in the rural sector. This contradicts the study
which confirms COB’s better performance in promoting SBLP than RRB15.
SBLP movement has not become successful in NER and other priority states like in Southern
India primarily due to poor infrastructure. For this program to be successful in all the regions alike,
NABARD will have to design the program differently so as to cater the diversified needs of people
living in different geographical areas of the country. Further, the gap between loan disbursement and
loan outstanding needs to be narrowed down which in turn will help in regulating the NPA rate. This
can be achieved by proper training and nurturing of all SHG formed under SBLP by the banks. If the
banks act dedicatedly as Self Help Promoting Institution, it will facilitate the socio-economic growth
REFERENCES:
1. NABARD. Status of Micro Finance in India report 2016-17. Mumbai.
2. Annapurna A. SHG-Bank Linkage Programme: An Indian Perspective. International Journal
of Engineering Science and Computing. 2017; 7(4).
3. Sa Dhan. The Bharat Microfinance Report. New Delhi.2015-2016.
4. Paul G, John P, S. (2010), Comparative analysis of MFI and SHG-banking model. APMAS.
Andra Pradesh; 2010.
5. Basu P, Shrivastava P.Scaling-up Microfinance for India’s Rural Poor. World Bank Policy
Research Working Paper 3646.2005.
6. Kumar and Golait (2009) Bank Penetration and SHG-Bank Linkage Programme:A Ctituque
Reserve Bank of India Occasional Papers. 2009; 29(3):119-138.
7. Sriram MS,Kumar R. Condition in Which Microfinance has Emerged in Certain Regions and
Consequent Policy Implication. Working paper. Indian Institute of Management.
Ahmedabad- India. 2005.
8. Reddy A, Malik D. A Review of SHG-Bank Linkage Programme in India. Indian Journal of
Industrial Economics and Development. 2011; 7 (2):1-10.
9. Haldar A, Stiglitz JE.The Indian Microfinance Crisis: The Role of Social Capital, the Shift to
For-Profit Lending and Implications for Microfinance Theory and Practice.Mimeo. Columbia
University; 2014.
10.Manohar L. Growth of SHGs Bank-Linkage Programme- A Comparative Study of Six
Regions in India. International Journal of Research in Humanities and Social Science. 2015;
2(8):28-37.
11.[11] Pokhriyal K, Ghildiyal V. Progress of Microfinance and Financial Inclusion- A Critical
Analysis of SHG-Bank Linkage Program in India. International Journal of Economics and
Finance. 2011; 3(2).
12.Singh S, Kumar P. Development and Disparity of Self Help Group-Bank Linkage Programme
in India - An Analytical Study. Asian Journal of Research in Banking and Finance. 2016;
6(10):1-9.
13.Savyanavar M, Trivedi P. (2016), “Performance Analysis of Commercial Banks Providing
Microfinance in Rural Areas of Maharashtra”, IOSR Journal of Economics and Finance
(IOSR-JEF). 2016:46-5.
14.Manju H, Shanmugam V. An Analysis of SHG Performance Through Microfinance in India,
15.Singh S, Kaur A. Growth of Women Self Help Groups under Bank-Linkage Programme in
India. International Conference on Recent Innovations in Science, Management, Education
and Technology. 2016; 4(7).
16.Nikita. An Analysis of Performance of Micro Finance in India. International Journal of
Management Research & Review.2014; 4 (7):715-721.
17.Goyal S, Agarwal S, Gupta R, Kumar S. A Study on the Performance of Self Help Group
Bank Linkage Programme in India. BVIMSR’s Journal of Management Research. 2017; 9(1).
18.NABARD. Status of Micro Finance in India report. 2008-09 to 2016-17. Mumbai.
19.Roy A. Microfinance and Rural Development in North East India. Pacific Business Review
International. 2012; 3(3): 43-56.
20.Rao M. Impact of Self Help Group Bank Linkage Programme and its Role on the Upliftment
of the Poor - Special Referent to Raigad District, Maharastra State. Doctoral Dissertation.