―Optimization Of Tig Welding Parameters And
Their Effect On Aluminium 5052 Plate’’
Lokesh Kumar Sharma, Amit Tiwari,Himanshu Vasnani
Abstract: Aluminum is very predominant metals with different alloying elements like: magnesia, silicon, tin, copper, magnesium and zinc.Important discussion for the field of metallurgy and engineering due to having fabrication & formability for the different products. In the world of precision TIG welding provides the best and suitable processes used in nuclear industries, automobile industries, aerospace industries and marine industries. In this paper, we used the details of TIG welding on the different samples 2mm, 3mm and 5 mm thickness on 5052 aluminum alloy plate. AL 5052 alloy is relatively nonmagnetic and does not easily ignite, due to having the properties of recycle, light weight, soft weight, and easily machined, durable, ductile and malleable metal. Welding speed, gas flow rate& welding current are the final governing parameters in this thesis. Also, the output parameters after several readings on the taken sets of specimen are studied and various optimized steps taken for the better quality of welded joints and their strength of weld. Tensile strength and hardness of weld joint will analyze over the specimen through the optical microscope and UTM.
Keywords: Tungsten Inert Gas (TIG), Response Surface Methodology (RSM), Aluminum (AL), Heat Affected Zone (HAZ).
————————————————————
1. PREVIEW
Welding and the weld surface requires lot of expertise and knowledge for the inspection during manufacturing. Welding is the process of joining of materials and complete the whole design by joining the parts with their final products to be manufactured. In different methods has been practiced in the industries for the quality manufacturing and reducing the accidents .Detection and evaluation of the weld parts is the assessment methods & tends to reduce as the critical defect size. Since the choice of possible methods depends upon the services of the equipment’s. Quite often in the industries, welding is practiced more than 100 years old during manufacturing, pre service and in-service. In processing has attracted international attention for the proper development of the engineering society and the development of the industrial life with reducing the risk in the services.NDT nowadays used for the critical services and high pressure services like: Furnaces, heat exchanger, boiler, radiators, chillers etc. on the fracture of mechanics calculations.Welding is the process to join the different metals with taken sets of part or the work pieces. It can join the different metals, plastic, alloys or the aluminum metals with each other at the applied heat and the pressure. In welding through which the metals elements come in contact with each other at the applied current and speeds depends upon the some factors. Due to rapid solidification and factors like the metallurgical changes that occur during welding can be used for reaction of materials with the oxidation of the metals. Also, it is possible for the crack formation in the joint position of the welded portion for having tendency of crack formation may occur in the same metals of types.
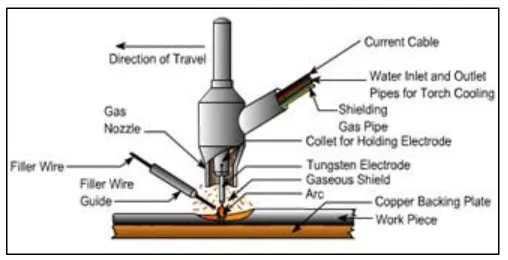
Figure 1: Welding principle in TIG.
Electrodes are available in different diameter for the butt welded joints and having electrodes length of 150-200 mm. Tungsten electrode are used and power is provided through the battery for the proper filling of the weld zones in the safer mode.
2. RESPONSE SURFACE METHODOLOGY OF
EXPERIMENT
It is widely used in the field as taken the best technique to match the welding requirements. This studied investigated to prepare the low cost products and optimized the welding defects with their proper functioning. To reduce the cost and improve the quality of the product this type technique is widely used and log as functions of desired output. The method & variation in a process is minimized to help in analysis of data and prediction of optimal results through robust design of experiments. RSM main objective and main steps for the parameter design phase are as below:
i. First, to set the objective for the overall experiment with the proper displacement.
ii. Output response will be identified with the proper measurements.
iii. Factors should be considered that affect the output response with the given levels and the interactions. iv. Array must be set with the trials of experiments
conducted over the O.A.
v. To reduce the noise variance and the significance of process parameters full analysis for the sets of factors be formed with the defined array.
__________________________________
Mr.Lokesh Kumar Suresh GyanVihar University, Jaipur. Email id: lokeshsharma9351@gmail.com
Mr.Amit Tiwari M.tech degree in the field of Production Engineering from Pacific university, Udaipur Rajasthan (Email id: amittiwari992@gmail.com)
Mr. Himanshu Vasnani
474 vi. Final set of optimal design parameters will be used
to conduct the confirmatory experiments.
In overall investigation it is find that the present optimization for the welding speeds and currents with their proper gas shielding effects. Response surface Methodology is used for the change in the weld for the base metal dilution in pulsed TIG welding. With the same procedure the advantages for the results & their optimization for the reduced hot cracking sensitivity, reduced width of heat-affected zone (HAZ) and reduced residual stresses with the proposed reports are observed in the previous thesis.To make certain changes to previous systems, it is really to know the exact picture behind the new scenario. So, gap analysis formed and the review of papers taken for the existing systems and their gap, which are as in next chapter.
3. RESEARCH BACKGROUND
In this study, a literature review details and attempts to analyze the effect of different parameters welding through the TIG welding was analyzed and their survey for the elements and AL 5052 properties of materials during fabrication and assessment of damage to the elemental background of the overall scenarios are evaluated
[1] AamirSohail, Abdul Aziz, Muhammad Imran, Osama Junaid M and SagheerAhmed(2017), in this girth welding of SS 304L were experimentally examined with ER308L filler with orbital machine in the set parameters of pulse rate, pulse frequency, arc travel speed and wire feed rate. All the effects are properly analyzed in the given sets of reinforcement of weld.
[2] Sanjay Kumar, Pravin k singh, D Patel, Shashi B Prasad (2017), due to selected optimization of the focused welding parameters. It is observed from the present study of the given or taken parameters of the Current, Voltage, Root Gap and Gas flow rate. It is undergone mechanical testing to perform the regression relation between input parameters and response values of RSM.
[3]Nabendu Ghosh, Pradip Kumar Pal, Goutam Nandi (2016), levels of current observed for the taken Butt welded joints of the in the taken consideration of their selected parameters. In terms of the yield strength, ultimate tensile strength and percentage of elongation of the welded specimens for the analyzed by using Taguchi methodology.
[4]Arun Kumar Srirangan, SathiyaPaulra(2016), this investigation focuses on the 800HT with the grey relational analysis with N82 filler wire of diameter 1.2 mm. L9 orthogonal array conducted for the whole experiments. Also, ultimate tensile strength and yield strength (at room temperature, 750 °C) shows as the targeted multiple output variables. In this, welding parameters play a vital role in the analysis of the filler material deposition and the chosen impact of the current, voltage & speed.
[5] B.Ganesamoorthi, S.Kalaivanan, R.Dinesh, T. Naveen kumar, K. Anand (2015), welding strength can be minimized or maximized by the chosen sets of parameters as studied and found in this paper. A mathematical model
for the RSM technique in the parametric resolution of the design matrix were used. It is observed that the results of the confirmatory solver were seen the desired output to the system.
[6]MAI (2015), in this investigation for the weld current varying parameters, experimental studied over the plate dimension with the single pass Tungsten Inert Gas (TIG) conducted. Dimension of the plate is 125mm X 60mm X 3mm. using the seen output the results investigation shows that the amount of weld current is 34%, with the increase of 37% in the weld zone were considered.
[7] V.Anand Rao, Dr.R.Deivanathan (2014), their analysis for the grade of SS in using the welding processes. The austenitic stainless steel of 310 grades were filled with the same SS materials for the proper strength. Higher strength was observed in the whole study with their requisite parameters. Same parameters was sets for the variables in this study.
[8]G VEN (2013), in the solution of the optical microscopy of the aluminum alloy (AA2219–T87) through the tungsten inert gas (TIG) welded 2219−T87 with ER2319. Electrodes filler alloy forms the pores in the surface of the metals if the speed should not maintain proper’s. This pores and sample observed micro cracks were used for the dissolution and segregation in the heat affected zone (HAZ). CuAl2 intermetallic particles were compared with the impedance spectroscopy in the higher corrosion rate. Dissolution and segregationrate observed around 0.6 M NaCl solution in the experimental setup.
[9]Pankaj C. Patil, Prof. R. D. Shelke (2013), from the literature study of this welding over the 7005 aluminum alloy plate, of thickness 5 mm tensile strength and hardness of weld joint was analyzed. It is very necessary to look after the repeatability of welding depends on the speed & processing parameters of the weld zones. All the big challenges were control with the sets of the parameters under their conditions were noted in the whole scenario.
[10]Indira Rani 2012, in this paper the summarized heat input and output of the paper for the of Al alloy 5A12 during TIG welding. The results show that the plate (2.5-6) mm with the requisites thickness considered. Dynamic process shows the some impact on the welding heat input have great effect for the welding speed (800-1400) mm/min. Also the residual distortion of out-of-plane is according the used current (60-100) A. In this work to optimize the performance of TIG welding over 2mm, 3 mm & 5mm aluminum plate, an automated TIG welding setup of the proposed sets of parameters was made. To get better strength welding of the Aluminum plate also done from both side their macrostructure analysis taken for the visualization & detecting the defects in the joint.
4. OBJECTIVES
[2] To investigate the specimen sample profile weld bead reinforcement, penetration, weldment macrostructure zones for the definite shape of dimension in the heat affected zone (HAZ).
[3] To find out the effect of the welding speed, applied current and Gas flow rate on the tensile strength of weld joint, micro hardness of the weld pool and macrostructure of the joint will analyze.
5. RESULTS AND DISCUSSION
In spite of this scientific interest, there remains a lack of extensive research and application of TIG welding in industries and situations are exposed to external exposed surfaces of the metal beyond the strength of the materials.
5.1 Experimental Setup
Aluminum plate sample of the dimension (60x20 mm) thickness 2mm, 3 mm and 5 mm was selected as work piece material for the present experiment. After sample preparation, all specimen are marked with the marker for their identifications in their bundles. All 7 specimen with their sets of 3 are taken one by one for the welding in the working table with flexible clamp side by side and welding done so that a butt join can be formed. TIG welding with Alternate Current (AC) was used in experiments as it concentrates for the point where the heat in the welding area. Electrode ER1100 tungsten electrodes of diameter 2.5 mm was taken as electrode for this experiment. The end of the electrode was prepared by reducing the tip diameter to 2/3 of the original diameter by grinding and then striking an arc on a scrap material piece. For the first phase of experiment welding parameters selected are shown in table 1. Before performing the actual experiment a number of trial experiments have been performed to get the appropriate parameter range where welding could be possible and no observable defects like undercutting and porosity occurred.
Table 1: Experiment Work and their parameters selected
Process
Parameter Units
Constant value
Level 1 Level 2 Level 3 Specimen
Thickness mm 2 3 5
Peak current Amps 90 110 170
Base current Amps 60 60-72 90
Welding speed, mm/min 250 350 450
Pulse frequency Hz 2 4 6
Shielding gas
flow rate L/min 15 20 25
Purging gas flow
rate L/min 5 8 10
Filler rod
diameter mm 3.15 3.15 3.15
Electrode
diameter mm 3.15 3.15 3.15
Pulse ratio and
Time % 50 50 50
5.2 Test specimen
After the experiment arrangements over the TIG welding machine. All the specimens are separately welded one by one to each side of their joints. Samples of specimen with the definite welding speed were measured and calculated for their average welding width as shown in table 2. Graph for the average value of welding vs. welding current plotted and it is clearly seen that welding width increases almost linearly with increase of welding current.
Fig 2. –Welded specimen of 2mm, 3mm and 5mm with selected sets of parameters are shown in figure.
5.3 Simulation Modeling of Welding
Minitab software used for the analysis and graph of the results. It is found that the results are found very proper and accurate as per the taken details of the specimen. All the specimen with the 2, 3 and 5 mm have 7 definite pieces of the work piece and welding through the TIG weldment done. Table 2 shows all the parameters which is taken for the final experimental purposes and their collected final results for the weld joint. Analysis on Minitab software done for the collected sets of the parameters.
Table 2: Welding Parameters of the all the 7 specimens sets of 2 mm, 3mm and 5 mm
Speci men
Curre nt (I)
Voltage (V)
Weldi ng Spee d (S)
Root Gap (R)
Gas Flo w Rat e (G)
Tensile Strengt h (T)
55 30 100 0.5 5 21.98
476 2 mm
65 30 140 0.5 10 22.87
70 30 160 0.5 10 21.56
73 30 180 0.5 12 21.04
75 30 200 0.5 12 20.90
80 30 220 0.5 15 21.67
3 mm
85 40 240 1 15 28.45
90 40 260 1 15 27.92
95 40 280 1 17 26.83
100 40 300 1 17 27.04
105 40 320 1 19 28.52
110 40 340 1 19 27.43
115 40 360 1 20 26.84
5 mm
130 50 380 1.5 20 32.87
140 50 400 1.5 22 32.45
150 50 420 1.5 22 32.96
155 50 440 1.5 24 31.64
160 50 460 1.5 24 31.83
165 50 480 1.5 25 31.05
170 50 500 1.5 25 32.67
Values for the specimen roughness are plotted against applied current in fig. 6.Surface roughness are there over the welded portion of the 7 samples of each sample. Specimen of 2 mm, 3 mm and 5 mm have their different weld zone and have different surface roughness are shown below. Roughness value shown a bitter changes in the observed range of range of 1.1 to 3.5 micron. Also, it is observed somehow quite low for a welded specimen. Automated system will show good quality of welding, which is possible to say that it not required any finishing operation. As the details of the figure illustrate the 3D model and their steel model was built through the induction heating. Study for the rectangular cracks was shown below and the coil was used here in the diameter of the 6 mm and a length of 200mm. Copper conductor coil was activated and size of the shield was 200 mm × 150 mm × 100 mm for the required signals used which may be high as per demand. Also, the sample size was 150 mm × 50 mm × 5 mm for the welded specimens.It was observed that the rectangular crack with a size of 10 mm × 2 mm × 0.6 mm was located on the surface of the sample.
Figure 4: Model for the simulation: (a) 3D model and (b) steel model
ANALYSIS
Probability Plot of Current (I), Voltage (V)
Fig 3: Minitab graph welding speed vs. welding current vs. welding voltage used over the welded specimen
sample.
All the graph data for the weld joints for the current and voltage increases with the increasing welding. Since the case formed where the voltage and current will coincide for their equal behaviors as shown in the graph.
ANALYSIS
Empirical CDF of Current (I), Welding Speed (S)
Fig 5: Minitab graph b/w Current and Welding speed over the welded specimen sample for the selected
parameters.
Therefore it is observed for the above graph that the welding speed variation increases the surface finish and their joints behavior for the whole set of the composition matters in the soft materials with their deformation at certain levels.
ANALYSIS
Fig 6: Minitab graph b/w Current and Tensile strength over the welded specimen sample in the normal mode.
It is found from the above graph, tensile strength of the welding portion increases with the proper adjustment of the current through electrode deposition the butt weld joint through the TIG welding. Also, it increases with the increasing current and joints filled proper in all the segments of the specimen.
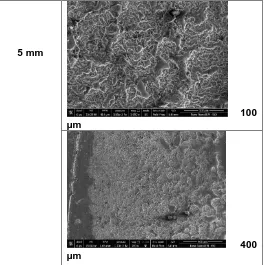
5.4 FESEM Data for each cross section of the weld specimens through the optical microscope
FESEM data taken through the optical image over welded specimen for the selected parameters in the define ranges. No changes observed for the specimen over the weld zone. Cross section of the weld zone have impact over the joint position, which is shown in the figure for the 2m, 3mm, & 5mm. Now, the series of impact observed for the welding current, welding depth for the applied welding speed which increases. A welding depth increases with the increasing welding current for the fixed value of the welding speed.
Specimen Microstructure Image
2 mm
50µm
100 µm
400 µm
3mm
50 µm
100 µm
400 µm
478 5 mm
100 µm
400 µm
Figure 7: Weld zone FESEM data for each cross section of the specimens for 50,100, 400 µm for each specimen
of 2, 3 and 5mm through the optical microscope.
5.5 Tensile Strength Test
Tensile test performed for the strength test of the used materials or the materials involved in the overall experimental purposes. Welding joint undergone thorough the tensile test by using the universal tensile testing machine. It will be loaded with the maximum load of 650kN. Gradually load will give to the sample over 1 mm/min. Values will be found larger in comparison to small values observed under the other series of aluminum with the total pressurized under the 132 MPa. Also, for the applied current for welding speed of 250-450 mm/min for the experimental case the values and increasing sets of recorded results are plotted. Tensile strength value almost increasing for increasing current setting when welding speed is 250-450 mm/min (except for welding current form 90 A to 170 A) as shown in table 5.2.
Figure 8: Specimen AL5052 for Tensile Test on UTM M/C
ANALYSIS
Empirical CDF of Current (I), Root Gap (R), Heat Input(KJ/mm)
Fig 9: Minitab graph of current, root gap and heat input for the welded specimen sample in applied parameters
As from the above graph the root gap must be kept proper to increase the weld behavior and also to reduce the heat input. It increases with the root gap and decreases with the root gap spaces.Time is considered for the variations inside the slope curve for the temperature length graph, which is maximum and minimum as found. It is easier to found that time curve is identified in this variations. Also, for the quantitative evaluation of the cracks the slope curve theoretical basis are exactly the same. Slope curve over the analysis to the model was not affected by the temperature gradients.
5.6 Optimization
Results for the applied eddy current which is accumulated around the cracks. Temperature gradients will increase gradually for the frame. Temperature of the coil and the sample of the image was taken from the thermal image across the sample. Infrared image of the system was taken from the thermography system, which have bright areas shows that the high temperature regions and also this gradients have of cracks have more bright area of 2s around the cracks.
ANALYSIS
Pareto Chart of Current (I) by Welding Speed (S)
Fig 10: Minitab graph pareto chart for current and welding speed 3.5 mm/s, 4 mm/s and welding current 100, 110, 120, 130 and 170 are used over the welded
6. CONCLUSION AND FUTURE WORK
Investigation over the specimens drawn some interesting conclusions are below:-
Uniform welding possible with TIG welding. Speed and current are the identified zones for affecting the weld.
Welding strength, microstructure are affected by their selection of welding points and their welding processes.
Quality of welding for the series of aluminum must be optimized under pre and post welding precaution during welding process.
Automated welding system avoided welding defects by controlling welding parameters (like welding current, gas flow rate, welding speed etc.).
Experiment for both sided welded sample, welding performed with high current (170 A), welding speed have no specific effect on tensile strength of the weld joint.Also, due to welding speeds for the specimen of AL 5052, strength is more due to more intensity of current
Tensile strength of the weld joints depends directly over the current & speed, with increasing current tensile strength of weld joint increases.
Due to change of microstructure, hardness value of the weld zone changes.
In the series of aluminum various results observed for both side welded part, tensile strength may change. But here tensile strength almost equivalent to the strength of base material.
6.1 Future Work
We only added 5%, however with further addition of more results can be varied by varying reinforcement grain size or percentage. Wear behavior and surface roughness quality of composite specimen can be further analyzed at different environment conditions also measured of composite is the scope of future work.
High strength rate properties of the developed composite may be found to explore the possibilities of using rutile reinforcement composite for different military applications.
This work further be extended by varying stirrer speed during process.
7 REFERENCES
[1]. AamirSohail, Abdul Aziz, Muhammad Imran, Osama Junaid M and Sagheer Ahmed (2017), Effect of TIG Welding Parameters on the Properties of 304L Automated Girth Welded Pipes Using Orbital Welding Machine , RRJOMS | Volume 5 | Issue 4 | October, 2017.
[2]. Sanjay KUMAR, Pravin K SINGH, D PATEL, Shashi B PRASAD (2017), Optimization of welding parameters of GTAW using response surface methodology, U.P.B. Sci. Bull., Series D, Vol. 79, Iss. 3, 2017. [3]. Nabendu Ghosh, Pradip Kumar Palb, Goutam Nandi
(2016), Parametric Optimization of MIG Welding on 316L Austenitic Stainless Steel by Grey-Based
Taguchi Method, Procedia Technology 25 ( 2016 ) 1038 – 1048.
[4]. Arun Kumar Srirangan, SathiyaPaulraj(2016), Multi-response optimization of process parameters for TIG welding of Incoloy 800HT by Taguchi grey relational analysis, Engineering Science and Technology, an International Journal 19 (2016) 811–817.
[5]. B.Ganesamoorthi, S.Kalaivanan, R.Dinesh, T. Naveen kumar, K. Anand(2015) Optimization Technique using Response Surface Method for USMW process Procedia - Social and Behavioral Sciences 189 ( 2015 ) 169 – 174.
[6]. MAI (2015), Optimization of pulsed TIG welding process parameters on mechanical properties of AA 5456 Aluminum alloy weldments. Journals of Science Direct (SP), 30, 188-1297.
[7]. Dr.R.Deivanathan, V.AnandRao,(2014), Experimental Investigation for Welding Aspects of Stainless Steel310 for the Process of TIG Welding, Procedia Engineering 97 (2014) 902 – 908.
[8]. Lu, S. P., Qin, M. P., & Dong, W. C. (2013). Highly efficient TIG welding of Cr13Ni5Mo martensitic stainless steel. Journal of Materials Processing Technology, 213(2), 229-237.
[9]. Raveendra, A., & Kumar, B. R.(2013). Experimental study on Pulsed and Non- Pulsed Current TIG Welding of Stainless Steel sheet (SS304). International Journal of Innovative Research in Science, Engineering and Technology, 2(6).
[10]. VEN (2013), An Evaluation of TIG Welding Parametric Influence on Tensile Strength of 5083 Aluminum Alloy. International Journal of Mechanical, Aerospace, Industrial, Mechatronic and Manufacturing Engineering, Vol. 7, 1262-65.
ABOUT THE AUTHORS
Mr.Lokesh Kumar Sharma is pursuing his Master of Technology in theManufacturing and Industrial Engineering from Suresh GyanVihar University, Jaipur. Email id: lokeshsharma9351@gmail.com
Mr.Amit Tiwari is currently working as as an Assistant Professor in department of Mechanical Engineering at Suresh GyanVihar University, Jaipur, Rajasthan India. He is also a Ph.D Scholar. He received his M.tech degree in the field of Production Engineering from Pacific university, Udaipur Rajasthan India. He has published four technical books and 40 research papers in various International and national Journals (Email id: amittiwari992@gmail.com)