R E S E A R C H
Open Access
Comparative analysis of copy number detection
by whole-genome BAC and oligonucleotide
array CGH
Nicholas J Neill, Beth S Torchia, Bassem A Bejjani, Lisa G Shaffer, Blake C Ballif
*Abstract
Background:Microarray-based comparative genomic hybridization (aCGH) is a powerful diagnostic tool for the detection of DNA copy number gains and losses associated with chromosome abnormalities, many of which are below the resolution of conventional chromosome analysis. It has been presumed that whole-genome
oligonucleotide (oligo) arrays identify more clinically significant copy-number abnormalities than whole-genome bacterial artificial chromosome (BAC) arrays, yet this has not been systematically studied in a clinical diagnostic setting.
Results:To determine the difference in detection rate between similarly designed BAC and oligo arrays, we developed whole-genome BAC and oligonucleotide microarrays and validated them in a side-by-side comparison of 466 consecutive clinical specimens submitted to our laboratory for aCGH. Of the 466 cases studied, 67 (14.3%) had a copy-number imbalance of potential clinical significance detectable by the whole-genome BAC array, and 73 (15.6%) had a copy-number imbalance of potential clinical significance detectable by the whole-genome oligo array. However, because both platforms identified copy number variants of unclear clinical significance, we designed a systematic method for the interpretation of copy number alterations and tested an additional 3,443 cases by BAC array and 3,096 cases by oligo array. Of those cases tested on the BAC array, 17.6% were found to have a copy-number abnormality of potential clinical significance, whereas the detection rate increased to 22.5% for the cases tested by oligo array. In addition, we validated the oligo array for detection of mosaicism and found that it could routinely detect mosaicism at levels of 30% and greater.
Conclusions:Although BAC arrays have faster turnaround times, the increased detection rate of oligo arrays makes them attractive for clinical cytogenetic testing.
Introduction
Molecular cytogenetic techniques such as array-based comparative genomic hybridization (aCGH) have revolu-tionized cytogenetic diagnostics and, in turn, the clinical management of patients with developmental delays and multiple congenital anomalies [1,2]. These rapid, high-resolution, and highly accurate techniques have identi-fied numerous previously unrecognized chromosomal syndromes [3-8], refined critical regions for established genetic defects [9], and broadened our view of the“ nor-mal” diploid genome [10]. In addition, aCGH has given the clinician a greater appreciation of variability in the
clinical presentation of many well-described conditions [11,12] and allowed for the discovery of new conditions with relatively mild phenotypes [13,14]. Furthermore, the application of aCGH has created a paradigm shift in genetics that has moved the description and discovery of genetic conditions from the “phenotype-first” approach, in which patients exhibiting similar clinical features are identified prior to the discovery of an underlying etiology, to a“genotype-first” approach, in which a collection of individuals with similar copy-num-ber imbalances can be examined for common clinical features [15].
Originally, targeted microarrays constructed from bac-terial artificial chromosomes (BAC) were developed for the clinical laboratory because of their ability to clearly * Correspondence: [email protected]
Signature Genomic Laboratories, Spokane, WA, USA
identify copy number changes in discrete regions of the human genome known to play a role in genetic disease [16]. This“less is more”idea prevailed in the early years of clinical aCGH because the technology was new and proof of principle was required before it could be adopted for more widespread diagnostic use. Further-more, the identification of copy number alterations of unclear clinical significance was considered undesirable to the diagnostician, the ordering physician, and the patient’s family. Recently, the coverage of microarrays has expanded to include more comprehensive coverage of the human genome, leading many to suggest that whole-genome BAC or oligo arrays are the next step in the continued improvement in the detection rate of cytogenetic abnormalities.
It has been presumed that whole-genome oligonucleo-tide arrays, because they have higher resolutions, would detect more copy number aberrations than whole-genome BAC arrays. However, to our knowledge, there has not been a systematic comparison of these two whole-genome copy number screening technologies in a clinical diagnostic environment. Therefore, to determine which platform is most effective in identifying clinically significant DNA copy number alterations, we designed a whole-genome BAC array and a whole-genome oligo array and compared the results in a blinded study of 466 clinical diagnostic specimens. In addition, we pro-spectively evaluated 3,443 patients by the whole-genome BAC array and 3,096 patients by the whole-genome oligo array and compared the detection rates of cally significant abnormalities and those of unclear clini-cal significance. Finally, we validated our oligo array with 48 cases to determine the level of mosaicism that can be reliably detected and compared that level to our previously published cases analyzed using the BAC array.
Materials and methods
Whole-genome BAC array design and aCGH
We constructed a whole-genome BAC array designed for clinical diagnostic use using >4,600 BAC clones. All clones were validated by FISH prior to inclusion on the array using previously described validation procedures [16]. Contigs of 3-6 overlapping clones were selected to cover 1,543 genetic loci, including >150 known micro-deletion/microduplication syndromes and increased den-sity of coverage in the 5-10 Mb surrounding the subtelomeric and pericentromeric regions of the gen-ome. In addition, we placed contigs to cover >500 func-tionally significant genes such as transcription factors and other genes known to play important roles in devel-opment. This coverage also includes genome-wide representation with at least one contig in nearly every chromosomal band at the resolution of an 850-band
karyotype. The mean gap size for the whole-genome BAC array is ~1.6 Mb. Microarray manufacturing and aCGH analysis using the whole-genome BAC array were performed as previously described [13]. BAC arrays were analyzed after a dye-swap, two-experiment analysis [16], using sex-mismatched controls. Results were then displayed using custom BAC aCGH analysis software (Genoglyphix™; Signature Genomic Laboratories, Spokane, WA).
Whole-genome Oligonucleotide Array Design and aCGH
Oligonucleotide-based microarray analysis was
performed using a custom-designed, 105K-feature whole-genome microarray manufactured by Agilent Technologies (Santa Clara, CA) with one probe every 10 kb in regions of interest–microdeletion/microduplication syndromes, the pericentromeric regions, subtelomeres and genes involved in important developmental path-ways–for an average of 50 oligos per clinical locus. In addition, to achieve backbone coverage, we placed a probe, on average, every 35 kb throughout the rest of the genome between the regions of interest. Genomic DNA labeling was performed as described for BAC arrays, whereas array hybridization and washing were performed as specified by the manufacturer (Agilent Technologies). A dye swap was not performed for the oligo arrays, and sex-matched controls were used. Arrays were scanned and analyzed as previously described [17]. Results of aberration calls consisting of five or more consecutive oligos were then displayed using custom oligonucleotide aCGH analysis software (Genoglyphix™; Signature Genomic Laboratories). The use of five consecutive oligos achieved a resolution of 40 kb in the regions of interest and a resolution of 140 kb in the backbone.
Decision Algorithm for Clinically Significant Copy Number Reporting
gene content, and/or were present in regions where common copy-number variation was known to occur in the general population. Signature’s own Genoglyphix Chromosome Aberration Database (GCAD) was used as a reference to assist in the interpretation of each altera-tion. GCAD is a database of >11,000 chromosomal abnormalities identified in >9,500 patients out of >40,000 patients evaluated by our laboratory and con-tains detailed statistics of each observed alteration (breakpoint coordinates, size, gene content, etc.) as well as clinical information pertaining to patient referral.
Fluorescence in situ Hybridization (FISH)
When possible, all copy number alterations detected by microarray analysis were visualized by interphase and/or metaphase FISH using a BAC probe located within the region of gain or loss. FISH was performed as previously described [18].
Patient Clinical Testing
To validate the custom-designed 105k oligo array com-pared to the whole-genome BAC array, 466 cases were run side-by-side in a platform comparison study. In each case, the clinically validated BAC array results were used for interpretation and reporting. Specimens with known chromosome abnormalities, parental specimens, and prenatal cases were excluded from the analysis.
In addition, we conducted a prospective study of 3,443 consecutive BAC microarray analyses and 3,096 conse-cutive oligo microarray analyses in our clinical labora-tory. The array platform used for testing in each case was chosen by the referring physician at the time of sample submission to our clinical diagnostic laboratory. Cases with previously known chromosomal abnormal-ities, parental samples, and prenatal specimens were again excluded from the data collection.
Mosaicism Assessment
The ability of the oligo platform to detect mosaicism was assessed on 48 patients previously known to carry mosaic abnormalities at levels as low as 5%. The altera-tions studied included a variety of interstitial, terminal, and whole-chromosome copy-number abnormalities, as well as marker chromosomes. The mosaic alteration in each patient was initially assessed by BAC array and the level of mosaicism determined by interphase FISH ana-lysis when possible. In a separate experiment, mosaicism was assessed using a dilution of cells from a male with trisomy 21 with normal male control cells, as previously described [19]. After FISH verification of the dilutions, DNA was extracted from the diluted cells, labeled and hybridized to the custom-designed oligo array as described above.
Results
Platform comparison study
From the 466 cases analyzed by the BAC array, using the previously described algorithm, we excluded 347 cases that only had aberrations located within regions that contained no genes and/or aberrations that had been established to be normal population variants by Signature Genomic Laboratories or identified in the Toronto Database of Genomic Variants (DGV, http:// projects.tcag.ca/variation/). After these cases were excluded, 138 copy number alterations in 119 cases (25.5% of the original 466 cases) remained that required FISH analysis. These aberrations included subtelomeric and pericentromeric gains for which FISH was required to exclude an unbalanced translocation or a marker chromosome. After FISH was performed, 60 aberrations in 52 cases were classified as normal variants because marker chromosomes and derivative chromosomes were not identified and because these alterations were located within regions where common copy number variation is known to occur. Thus, alterations of potential clinical significance according to our algorithm were identified in 67 cases, a detection rate of 14.4%. Of these cases, 56 (12.0%) were considered to contain clinically significant copy number alterations (Table 1), and 11 (2.4%) were considered to contain copy number variants of unclear clinical significance for which parental analyses were recommended to further clarify the abnormality (Table 2). aCGH and FISH analysis performed on parental samples revealed that six alterations of unclear signifi-cance were inherited from a carrier parent and one was ade novoevent in the proband. The origin of the other four unclear alterations could not be determined.
Using the oligo array, we identified 1,337 copy number variations among the same 466 cases. Using the algo-rithm previously described, we excluded 1,172 aberra-tions that were located within regions that had no gene content or those that were common copy number var-iants. After these exclusions were made, 165 aberrations in 138 cases (29.6%) remained that required FISH analy-sis. After FISH analysis was performed, aberrations of potential clinical significance were identified in 73 cases, a detection rate of 15.7%. Of these, the same 56 (12.0%) cases that were identified by the BAC platform were con-sidered to contain clinically significant alterations (Table 1) and 17 (3.7%) were determined to contain copy num-ber variants of unclear clinical significance.
Table 1 Cases with Alterations of Clinical Significance Identified by BAC and Oligo aCGH
Pt. # Chr Band Start pos. End pos. Gain/Loss Size # of BACs # of Oligos
21637 chr16 p11.2 29,563,985 30,066,187 Loss 502,202 5 46
21992 chr16 p11.2 29,563,985 30,066,187 Loss 502,202 5 46
22013 chr16 p11.2 29,563,985 30,066,187 Loss 502,202 5 46
21993 chr10 q25.2q25.3 114,306,207 114,925,368 Loss 619,161 3 36
21756 chr2 q35 219,418,281 220,060,969 Loss 642,688 2 43
22002 chr2 q37.3 239,664,393 240,400,008 Loss 735,615 3 82
22334 chr10 q25.2q25.3 114,024,053 115,677,301 Gain 1,653,248 3 53
21688 chr16 p13.11p12.3 15,056,257 16,742,812 Gain 1,686,555 3 61
21667 chr17 p12 14,052,297 15,742,271 Gain 1,689,974 3 67
21896 chr4 q35.2 189,407,487 191,133,809 Loss 1,726,322 8 147
22269 chr2 q12.3q13 107,945,041 109,784,684 Loss 1,839,643 6 102
21640 chr19 q13.42 59,272,450 61,239,237 Gain 1,966,787 8 135
22117 chr9 q33.1 118,991,777 121,063,590 Gain 2,071,813 3 67
22066 chr8 p12p11.21 38,303,146 40,515,492 Gain 2,212,346 6 104
21786 chr1 q21.1 144,973,942 147,421,814 Gain 2,447,872 5 63
22237 chr1 q21.1 144,973,942 147,421,814 Gain 2,447,872 5 63
22310 chr22 q11.21 17,299,742 19,770,655 Loss 2,470,913 13 205
22050 chr22 q11.21 17,007,819 19,770,655 Loss 2,762,836 13 208
21936 chr1 q21.1 144,973,942 147,966,185 Gain 2,992,243 5 65
21719 chr2 q31.1 169,823,689 172,870,083 Loss 3,046,394 8 119
22128 chr4 q34.3 179,065,989 182,435,119 Loss 3,369,130 3 91
22006 chr17 p11.2 16,723,071 20,145,604 Loss 3,422,533 18 311
22174 chr1 q41q42.12 221,260,860 224,709,317 Loss 3,448,457 9 178
21971 chr22 q11.23q12.2 24,025,269 28,008,109 Loss 3,982,840 3 111
22073 chr15 q11.2q13.1 21,208,177 26,194,049 Loss 4,985,872 11 281
21687 chr16 q12.2q21 51,912,655 57,173,018 Loss 5,260,363 15 261
21975 chr5 p15.2p14.3 13,514,464 18,988,928 Loss 5,474,464 3 122
21555 chr7 p22.3p22.1 153,644 6,230,285 Gain 6,076,641 32 434
21547 chr2 q24.3q31.1 168,702,606 174,842,496 Loss 6,139,890 11 226
21755 chr11 p12p11.2 37,540,680 43,940,573 Loss 6,399,893 14 298
21761 chr3 p14.1p12.3 70,738,914 77,275,908 Loss 6,536,994 6 151
22151 chr15 q11.2q13.1 18,809,804 26,194,049 Gain 7,384,245 14 331
22322 chr8 p21.3p12 22,954,212 30,630,828 Loss 7,676,616 9 224
21889 chr2 q33.1q34 202,901,021 211,366,732 Gain 8,465,711 13 281
21723 chr5 q23.1q23.3 121,487,477 130,306,377 Loss 8,818,900 4 204
22337 chr1 p36.22p36.13 9,476,880 19,436,653 Loss 9,959,773 21 436
21795 chr1 p34.2p32.3 41,201,837 55,191,500 Gain 13,989,663 17 440
20986 chr12 p13.33p12.3 84,918 17,505,135 Gain 17,420,217 46 800
21957 chr11 q23.3q25 116,478,434 134,419,382 Gain 17,940,948 40 784
21596 chr1 q25.1q32.1 173,519,967 203,663,817 Gain 30,143,850 25 814
22055 chr3 p14.1p13 71,164,161 71,958,845 Loss 794,684 3 46
21566* chr17 p13.2p13.1 6,081,457 6,904,679 Loss 823,222 3 14
21558 chr22 q13.33 48,567,185 49,517,230 Loss 950,045 6 54
21770 chr8 p23.3 202,505 1,411,517 Loss 1,209,012 5 96
22254 chr8 p23.2 2,604,280 3,966,809 Loss 1,362,529 9 140
detected by the BAC array was 1.12 Mb (range: 289 kb -1.42 Mb).
In two cases, the oligo microarray identified additional complexity that was not recognized by the BAC array. In patient 21566, the BAC array identified one intersti-tial deletion of 17p13.2p13.1, whereas oligo array analy-sis identified that deletion and an additional interstitial deletion in the same band (data not shown). In patient 21897, the BAC array identified a 6.8 Mb terminal dele-tion of 5p, whereas oligo array analysis identified that deletion and a 1.4 Mb duplication proximal to the deleted region (Figure 1).
Prospective Diagnostic Comparison
Of the 3,443 diagnostic specimens analyzed using our whole-genome BAC array, 605 (17.6%) had copy num-ber alterations. Using the previously described algo-rithm, 365 (10.6%) had abnormalities that were classified as clinically significant, whereas 240 (6.9%) had copy number variants of unclear clinical significance.
Of the 3,096 diagnostic specimens analyzed using our whole-genome oligo array during the same time period, 698 (22.5%) had copy number alterations. Using the
previously described algorithm, 477 (15.9%) of these cases were determined to contain alterations considered to be clinically significant and 221 (7.0%) were deter-mined to contain copy number variants of unclear clini-cal significance (Table 4).
The increased number of cases with clinically signifi-cant alterations detected by the oligo array was found to be statistically significant using a Fisher’s Exact Test (OR = 1.5359, p < .0001). The increased number of cases with alterations of unclear significance detected by the oligo array was not statistically significant (OR = 1.0259, p = 0.8090).
Mosaicism Assessment
All but three of the 48 previously known mosaic altera-tions were detected by the oligo array. FISH analysis estimated that the proportion of uncultured cells carry-ing the alteration was 24% in the first case, while the proportion in cultured cells was 6%. In the second case, 5% of cells were found to carry the alteration by FISH (data not shown). The proportion of cells carrying the alteration in the third case could not be determined because FISH confirmation was not possible on the
Table 2 Cases with Alterations of Unclear Significance Identified by BAC and Oligo aCGH
Pt. # Chr Band Start pos. End pos. Gain/Loss Size # of BACs # of Oligos Inheritance
22365 chr9 p23 9,881,385 9,984,838 Loss 103,453 2 15 Paternal
21702 chr16 p12.2 21,486,897 21,641,890 Loss 154,993 2 16 Paternal
21883 chr16 p12.1 21,974,396 22,338,234 Gain 363,838 3 49 Maternal
21860 chr16 p12.1 21,907,270 22,338,234 Loss 430,964 3 50 Unknown
22009 chr22 q11.21 19,069,125 19,770,655 Loss 701,530 4 70 Paternal
22102 chr16 p13.11 14,981,044 16,166,985 Gain 1,185,941 3 60 Maternal
22246 chr10 p11.22 31,591,310 32,792,762 Loss 1,201,452 2 40 Unknown
21893 chrX p11.32 45,930,652 46,382,140 Gain 451,488 3 34 Maternal
22273 chrX q28 153,355,101 154,317,591 Gain 962,490 5 46 Unknown
10245 chr3 p14.1 67,727,841 69,101,769 Loss 1,373,928 2 25 Unknown
22348 chr13 q22.2 74,989,699 75,378,640 Loss 388,941 3 51 De novo Table 1: Cases with Alterations of Clinical Significance Identified by BAC and Oligo aCGH(Continued)
21710 chr15 q13.2q13.3 28,741,818 30,186,356 Loss 1,444,538 3 64
21722 chr15 q13.2q13.3 28,741,818 30,226,376 Loss 1,484,558 3 65
21739 chr15 q13.2q13.3 28,741,818 30,226,376 Loss 1,484,558 3 65
21787 chr15 q13.2q13.3 28,741,818 30,226,376 Loss 1,484,558 3 65
21897* chr5 p15.2 8,511,592 9,888,817 Gain 1,377,225 34 29
21884 chrX q28 152,676,750 153,059,428 Gain 382,678 3 44
21592 chrX p22.33q28 701 154,888,083 Gain 154,887,382 325 6888
22087 chrY p11.32 262,578 57,715,879 Gain 57,453,301 49 49
22285 chrX p21.1 31,759,551 31,830,811 Loss 71,260 2 11
22244 chr22 q13.33 49,342,961 49,514,486 Loss 171,525 2 56
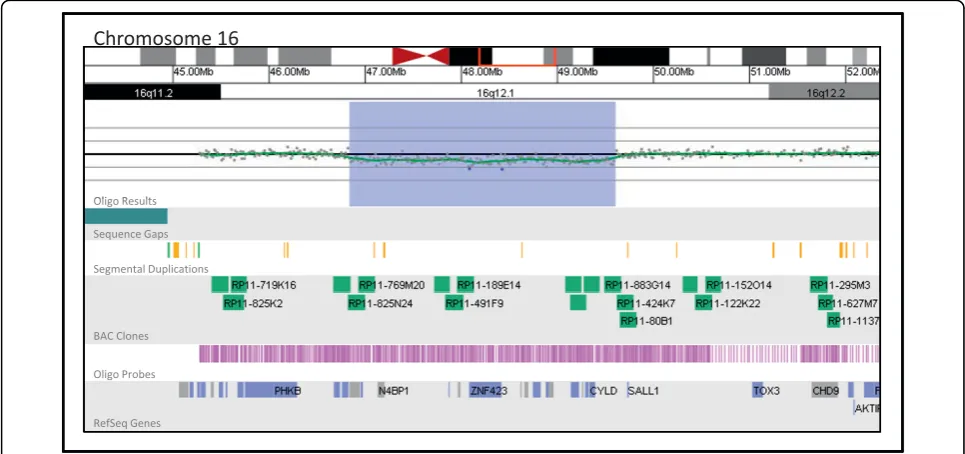
sample received by our laboratory. Certain alterations, such as tetrasomy 12p, were successfully detected in proportions of cells as low as 10% by the oligo array, although this low threshold of detection was facilitated by the tetrasomic nature of the rearrangement; the 4:2 ratio of patient to control DNA in this case was more readily detected than the 3:2 ratio typically associated with duplications. Figure 2 shows a 2.77 Mb interstitial deletion at 16q12.1 present in 23% of cultured meta-phase cells that was detected by the oligo array.
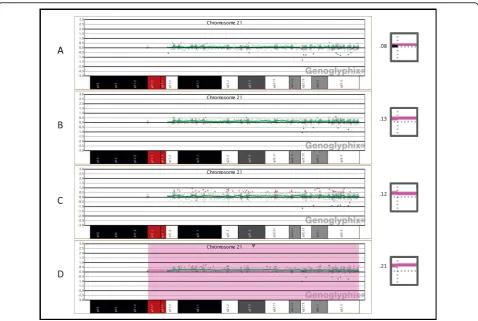
In the dilution series of trisomy 21 cells, shifts in the aCGH data were distinguishable down to levels as low as 10%, but could only be readily detected at a level of 30% or greater (Figure 3). As the proportion of trisomy
21 cells was increased from 10% to 30%, the average log2 ratio of chromosome 21 increased from 0.08 to
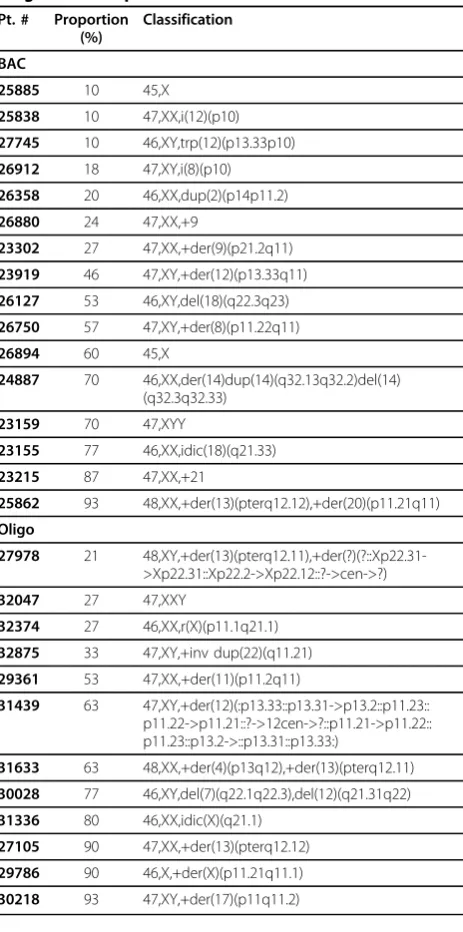
0.21. During the prospective diagnostic comparison, 16 cases analyzed using the BAC array contained mosaic alterations, whereas only 12 mosaic cases were identified using the oligo array (Table 5). The increased number of mosaic abnormalities detected by the BAC array was determined to be not statistically significant (OR = 1.1999, p = 0.7066).
Discussion
BAC and oligo array platforms each have unique advan-tages and disadvanadvan-tages in a diagnostic setting; these may include turnaround times, genomic coverage, and
Figure 1Identification by oligonucleotide microarray of additional complexity missed by BAC microarray.(A)BAC microarray results showing a single-copy loss of 34 BAC clones from the terminus of 5p, approximately 6.8 Mb in size (chr5: 387,034-7,150,950, based on UCSC 2006 hg 18 assembly). Probes are ordered on the x axis according to physical mapping positions, with the p-arm probes to the left and q-arm probes to the right.(B)shows oligonucleotide microarray results of the terminal deletion shown in (A) in addition to single-copy gain of 29 probes from 5p, approximately 1.38 Mb in size (chr5: 8,511,592-9,888,817, based on UCSC 2006 hg 18 assembly). Probes are ordered as in the BAC array. Regions shaded in blue represent deletions detected by microarray, whereas duplications are shaded in pink.
Table 3 Cases with Alterations of Unclear Significance Detected by Oligo Array but not Identified by BAC Array
Pt. # Chr Band Start pos. End pos. Gain/Loss Size # of Oligos
9756 chr2 p25.1 11,097,126 12,515,559 Loss 1,418,433 19
9886 chr1 q42.12 222,702,622 223,461,255 Loss 758,633 16
10141 chr2 q32.3q33.1 196,729,308 197,880,950 Loss 1,151,642 30
10114 chr15 q26.3 97,299,441 97,745,782 Gain 446,341 16
10292 chr7 p14.3 33,202,932 33,492,136 Loss 289,204 5
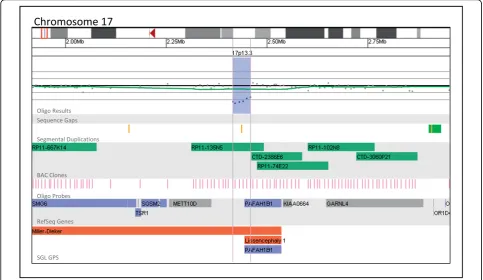
costs. One of the most important characteristics of each platform is the detection rate of clinically significant alterations. Our results demonstrate that our whole-genome oligo array was able to detect such alterations in 15.4% of patients tested, compared to the BAC array detection rate of 10.6%, a statistically significant differ-ence (Fisher’s Exact Test, p < 0.0001). The alterations that constitute the 4.8% difference in detection rate between the BAC and oligo arrays are either too small to be detected by the BAC array but are not below the resolution of the oligo platform (Figure 4) or fall within gaps in the BAC array coverage (Figure 5). Figure 4 shows a 44 kb deletion of 17p13.3 detected in a patient referred to our laboratory for convulsions. This deletion encompasses the first exon ofPAFAH1B1(LIS1). While it is not known whether this deletion results in a null allele or simply a truncated gene product, hemizygous deletions and mutations of this gene are found in patients with isolated lissencephaly type 1 (OMIM
607432) and have been linked to epileptic seizures and convulsions [20,21]. Although RP11-135N5 provides coverage of this region on the BAC array, FISH analysis using this clone could not confirm the deletion in any cells because of the deletion’s small size compared to the FISH probe used. Thus, this clinically significant deletion could only have been reliably detected using the oligo platform. Although oligo-based aCGH has the power to detect alterations smaller than the size of a BAC probe, BAC-based aCGH has an advantage in that the analysis makes evident the appropriate probe to be used for FISH confirmation. In addition, this probe is usually readily available because of its inclusion on the microarray platform and will have a high rate of suc-cessful confirmation. When oligonucleotide-based aCGH is performed, BAC probes must be specifically selected for the FISH confirmation of each small abnormality that is detected. Once a probe has been selected, it must also be specially prepared or ordered before FISH can be performed. This process increases both the time it takes to perform FISH confirmation of oligo aCGH results and the cost associated with the analysis.
Figure 5 shows a 2.9 Mb deletion of 6q14.1 detected in a patient referred to our laboratory for developmental delay and dysmorphic features. This deletion encom-passes eight genes:PHIP,HMGN3, LCA5,SH3BGRL2, ELOVL4,TTK,BCKDHB, two of which are known to be associated with human disease [22-24]. Although this Table 4 Summary of the Prospective Diagnostic
Comparison
BAC Oligo
Total 3,443 3,096
Abnormal 605 (17.6%) 698 (22.5%)
Significant 365 (10.6%) 477 (15.4%)
Unclear 240 (7.0%) 221 (7.1%)
Mosaic 16 (0.5%) 12 (0.4%)
2.9 Mb deletion is likely to be clinically significant, it lies within a gap in the coverage of our BAC array and could only be detected using the oligo platform because of its more uniform backbone coverage.
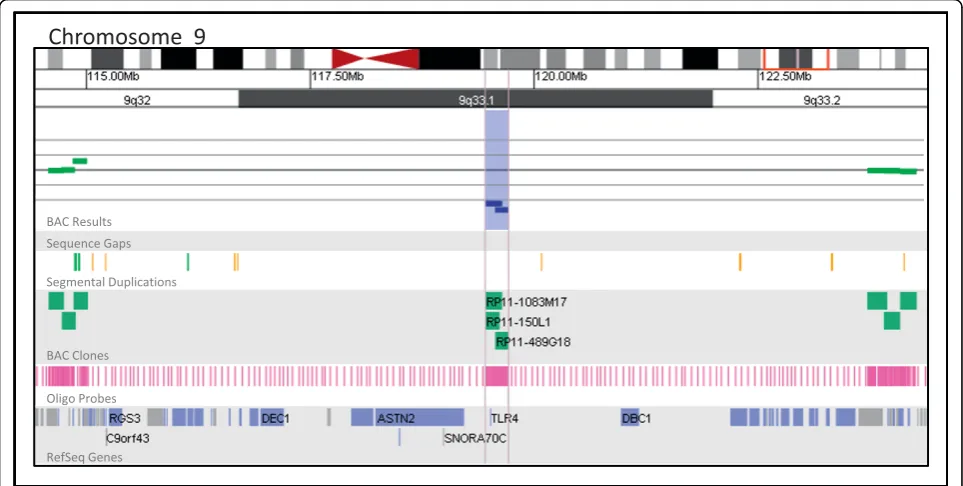
The detection rate of alterations of unclear clinical significance is also a concern during the selection of a microarray platform in a clinical diagnostic setting. Our data suggest that both the oligo and BAC platforms detect similar numbers of abnormalities of unclear sig-nificance (7.0% by BAC and 7.1% by oligo), although the circumstances leading to an unclear clinical interpreta-tion may vary between the platforms. On the BAC plat-form, unclear results are often associated with gaps in coverage which prevent the precise determination of the breakpoints and gene content of an abnormal region. This lack of information prohibits definitive interpreta-tion of the clinical significance of the alterainterpreta-tion. Figure 6
presents a 262 kb deletion of 9q33.1 detected by BAC array in a patient referred for developmental delay, dys-morphic features, and multiple congenital anomalies. The boundaries of this alteration as defined by BAC array include only one gene,TLR4[25]. However, gaps in BAC coverage on both sides of the alteration span 4.5 Mb proximally and 4.0 Mb distally. As a result of these coverage gaps, this alteration, though estimated to be just 262 kb, may be as large as 8.7 Mb and include up to 48 additional genes. The design of BAC arrays with dense clone coverage is possible; however, probe density is limited by the availability of BAC clones and the presence of potentially interfering genomic architec-ture such as segmental duplications. In addition, BAC-based microarrays will not reliably detect abnormalities smaller than the size of an individual probe–80-200 kb, on average, for BAC clones.
Figure 3Oligonucleotide microarray analysis of artificially derived mosaic trisomy 21 samples.(A)10% trisomy 21 showing a very subtle copy-number gain for all clones on chromosome 21. The profile was generated using DNA extracted from a mixture of blood which contained 10% WBCs from a trisomy 21 subject and 90% WBCs from a normal male individual.(B)15% trisomy 21, generated as in (A), showing a very subtle copy-number gain for all clones on chromosome 21.(C)20% trisomy 21, generated as in (A) showing a subtle copy-number gain for all clones on chromosome 21.(D)30% trisomy 21, generated as in (A), showing a clear copy-number gain for all clones on chromosome 21. The inset images to the right of each array plot show the average log2ratio of all probes mapping to chromosome 21, with the horizontal dotted
line representing a log2ratio of zero and the vertical dotted line representing the centromere. A pink bar plotted above the horizontal line
represents a copy-number gain of all probes on chromosome 21. To the left of each inset image is the average log2ratio at the specified
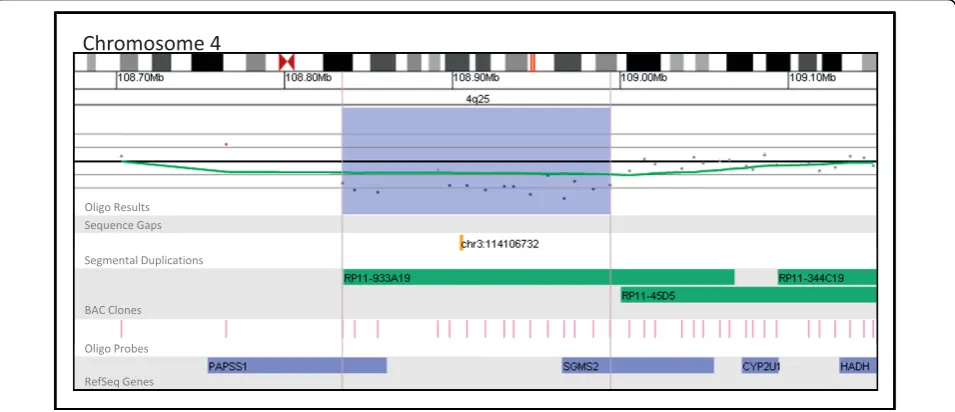
Although gaps in coverage and limited breakpoint-resolving power are primarily a concern for BAC plat-forms, both oligo and BAC platforms produce results that are unclear because a lack of published evidence prevents a conclusive association between the gene con-tent of an alteration and the clinical features of the patient from being made. Figure 7 presents a 160 kb deletion of 4q25 detected by oligo array in a patient referred for developmental delay. Follow-up analysis performed on this patient’s parents revealed that this alteration wasde novo in origin. This alteration deletes two genes, PAPSS1 andSGMS2. While mutations or
alterations of these genes have not been associated with disease in humans, it has been shown that PAPSS1 plays a key role in post-translational modification and SGMS2 mediates the production of sphingomyelin [26,27]. Thus, although the gene content and inheritance pattern of this deletion suggest a causative role in the patient’s clinical features, a lack of published information linking the genes affected by this alteration with a distinct phe-notype prevents a clear interpretation from being made based on only aCGH results. This type of unclear result, although more prominent with oligo platforms (4.2% by BAC vs. 7.1% by oligo), is an element of all aCGH ana-lysis regardless of platform and accentuates the need for databases containing aCGH results in combination with phenotypic information. Although the number of char-acterized genetic disorders and genomic regions is rapidly increasing, the clinical consequences of altera-tions involving much of the genome still remain unclear. The increase in the number of copy number altera-tions identified by higher-resolution whole-genome arrays underscores the need for a variety of tools to facilitate the interpretation of array results in a clinical diagnostic setting. We propose the use of an algorithm such as the one outlined here in conjunction with data-bases of normal population variants, clinically significant alterations, and those of unclear significance. Although such databases can provide invaluable context for the analysis of aCGH data, care must be taken by the diag-nostician when comparing their data to pre-existing databases of copy-number variations. For example, data in the DGV are pooled from a variety of sources, plat-forms, and populations using a variety of different con-trols and without independent verification, and thus may not be appropriate for comparison in all situations. Furthermore, recent evidence suggests that most data in the DGV overestimate the size of the regions involved because they are dependent primarily on BAC array data, which has a tendency to overestimate the true size of small aberrations [28]. Thus, the most useful CNV databases may be those generated by individual labora-tories using identical reference controls and array plat-forms. Based on our experience, we have constructed a database of abnormal copy number aberrations identi-fied by BAC and oligo aCGH in our laboratory and a database of copy-number variations thought to have no significance. Such databases are essential for under-standing the various copy number aberrations identified by microarray analysis.
Genotype-phenotype correlations in a diagnostic set-ting must address a variety of factors including gene con-tent, potential position effects, aberration size, and inheritance patterns. These factors often present conflict-ing evidence about the potential clinical significance of a rare alteration. For instance, the size of an abnormality is Table 5 Mosaic Alterations Detected in the Prospective
Diagnostic Comparison
Pt. # Proportion (%)
Classification
BAC
25885 10 45,X
25838 10 47,XX,i(12)(p10)
27745 10 46,XY,trp(12)(p13.33p10)
26912 18 47,XY,i(8)(p10)
26358 20 46,XX,dup(2)(p14p11.2)
26880 24 47,XX,+9
23302 27 47,XX,+der(9)(p21.2q11)
23919 46 47,XY,+der(12)(p13.33q11)
26127 53 46,XY,del(18)(q22.3q23)
26750 57 47,XY,+der(8)(p11.22q11)
26894 60 45,X
24887 70 46,XX,der(14)dup(14)(q32.13q32.2)del(14) (q32.3q32.33)
23159 70 47,XYY
23155 77 46,XX,idic(18)(q21.33)
23215 87 47,XX,+21
25862 93 48,XX,+der(13)(pterq12.12),+der(20)(p11.21q11)
Oligo
27978 21 48,XY,+der(13)(pterq12.11),+der(?)(?::Xp22.31->Xp22.31::Xp22.2->Xp22.12::?->cen->?)
32047 27 47,XXY
32374 27 46,XX,r(X)(p11.1q21.1)
32875 33 47,XY,+inv dup(22)(q11.21)
29361 53 47,XX,+der(11)(p11.2q11)
31439 63 47,XY,+der(12)(:p13.33::p13.31->p13.2::p11.23:: p11.22->p11.21::?->12cen->?::p11.21->p11.22:: p11.23::p13.2->::p13.31::p13.33:)
31633 63 48,XX,+der(4)(p13q12),+der(13)(pterq12.11)
30028 77 46,XY,del(7)(q22.1q22.3),del(12)(q21.31q22)
31336 80 46,XX,idic(X)(q21.1)
27105 90 47,XX,+der(13)(pterq12.12)
29786 90 46,X,+der(X)(p11.21q11.1)
Figure 4Oligonucleotide microarray characterization of an interstitial deletion at 17p13.3. The zoomed-in microarray plot shows a single-copy loss of six probes from the short arm of chromosome 17 at 17p13.3, approximately 44.0 kb in size (chr17: 2,415,074-2,459,051, based on UCSC 2006 hg 18 assembly). Probes are ordered on the x axis according to physical mapping positions, with the most distal 17p13.3 probes to the left and the most proximal 17p13.3 probes to the right. Below is a schematic of the deletion region. The deletion disrupts thePAFAH1B1/ LIS1gene.
commonly used as justification for its proposed clinical consequences; however, this association is not always straightforward. High-resolution microarray analysis rou-tinely detects abnormalities smaller than 500 kb that dis-rupt clinically significant genes and have clear phenotypic impact (Figure 4); conversely, numerous examples of common copy-number variants have been observed that are relatively large but lie in regions with sparse gene content. In addition, although it is generally assumed thatde novoabnormalities are causative and inherited abnormalities are not, this is not always the case. There are a number of regions of the genome where both inherited andde novocopy number altera-tions have been identified, some of which result in mild phenotypes that may be inherited from parents who have a milder or subclinical, presentation. For example, dele-tions of distinct regions of 1q21 have been associated with both thrombocytopenia absent radius (TAR) syn-drome and a variable phenotype including microcephaly/ macrocephaly, developmental delay, cardiac abnormal-ities, and schizophrenia [29-31], but in many instances aberrations of these regions are inherited from phenoty-pically normal parents [32]. Another example is the 16p11.2 region associated with a range of cognitive, developmental, and speech delays, behavioral issues, and
autism, deletions and duplications of which can be inher-ited orde novo[33-36]. In regions such as these, copy number changes may unmask recessive alleles or work in conjunction with various genetic modifiers, perhaps even other CNVs, to produce a clinical phenotype. Potentially, non-paternity may also confound genotype-phenotype correlation for copy number alterations in these complex regions of the genome. These reasons underscore the need for thorough databases of normal population var-iants and clinically significant alterations complete with genotype-phenotype correlations. Such databases expe-dite the process of determining the potential significance of copy-number alterations in a diagnostic setting; aid in the elucidation of new microdeletion/duplication syn-dromes and new regions of benign copy-number varia-tion; and help reduce the burden of expensive, time-consuming, and difficult follow-up necessitated by the increased number of alterations of unclear clinical signifi-cance detected by microarray analysis.
We [19] and others [37] have shown that mosaicism can be detected at low frequencies of chromosomally abnormal cells using BAC-based aCGH; however, the ability of oligo platforms to reliably detect mosaic abnormalities has not yet been well established. Our current assessments demonstrate that aCGH using
either BAC or oligo platforms can easily detect mosai-cism of 30% or greater for a variety of alterations and that levels as low as 10% can be detected with both plat-forms under optimal conditions. In addition, our retro-spective analysis showed that there is no significant difference between the two types of platforms in the number of mosaic abnormalities detected in a clinical diagnostic setting (p = 0.7066). However, BAC-based arrays may still have a greater ability to detect mosaic abnormalities present at very low levels (less than 20%), perhaps due to the routine use of dye-swap experiments which can be cost-prohibitive with oligo arrays but pro-mote the visual identification of mosaic abnormalities. The sensitivity of the BAC array is demonstrated by the detection in three cases of abnormalities in only 10% of cells during the retrospective study, whereas the lowest level of mosaicism detected by our oligo array was 21% (Table 5). The ability of an aCGH platform to detect mosaic abnormalities also depends largely on the effec-tiveness of the software used to analyze the data, as low-level mosaic alterations are difficult to identify using only visual inspection (Figure 3). For this reason, it is important to select analysis software which facilitates the identification of mosaic alterations.
These data suggest high-resolution oligo-based aCGH detects a higher proportion of clinically significant abnormalities than BAC-based aCGH. Our results also demonstrate the ability of microarray-based CGH to reli-ably produce high-yield results in a clinical setting using differing platforms, array designs, and analysis algorithms,
supporting the validity of array CGH as a first-tier diag-nostic screening tool [38]. Finally, the prevalence of copy number variants of unclear clinical significance detected on both platforms underscores the need for the develop-ment of readily accessible diagnostic tools in the form of databases of documented chromosome abnormalities to aid in the interpretation of microarray data.
Acknowledgements
We thank Aaron Theisen (Signature Genomic Laboratories, Spokane, WA) for his careful edits of the paper and all of the laboratory staff at Signature Genomics for conducting the aCGH and FISH experiments.
Authors’contributions
NN wrote the manuscript; BST analyzed the molecular cytogenetics results; BAB, BCB and LGS designed and coordinated the study. All authors have read and approved the final manuscript.
Competing interests
NN, BST, BCB, BAB and LGS are employees of Signature Genomic Laboratories, a subsidiary of PerkinElmer.
Received: 16 March 2010 Accepted: 29 June 2010 Published: 29 June 2010
References
1. Shaffer LG, Bejjani BA, Torchia B, Kirkpatrick S, Coppinger J, Ballif BC:The identification of microdeletion syndromes and other chromosome abnormalities: Cytogenetic methods of the past, new technologies for the future.Am J Med Genet C Semin Med Genet2007,145C:335-345. 2. Shevell MI, Bejjani BA, Srour M, Rorem EA, Hall N, Shaffer LG:Array
comparative genomic hybridization in global developmental delay.Am J Med Genet B Neuropsychiatr Genet2008,147B:1101-1108.
3. Ballif BC, Hornor SA, Jenkins E, Madan-Khetarpal S, Surti U, Jackson KE, Asamoah A, Brock PL, Gowans GC, Conway RL, Graham JM Jr, Medne L, Zackai EH, Shaikh TH, Geoghegan J, Selzer RR, Eis PS, Bejjani BA, Shaffer LG: Figure 7Oligonucleotide microarray characterization of an interstitial deletion at 4q25. The zoomed-in microarray plots shows a single-copy loss of 15 oligonucleotide probes from the long arm of chromosome 4 at 4q25, approximately 159.6 kb in size (chr4: 108,834,399-108,994,048, based on UCSC 2006 hg 18 assembly). Probes are ordered on the x axis according to physical mapping positions, with proximal 4q25 clones to the left and distal 4q25 clones to the right. Below is a schematic of the deletion region. The deletion disrupts thePAPSS1and
Discovery of a previously unrecognized microdeletion syndrome of 16p11.2-p12.2.Nat Genet2007,39:1071-1073.
4. Ballif BC, Theisen A, McDonald-McGinn DM, Zackai EH, Hersh JH, Bejjani BA, Shaffer LG:Identification of a previously unrecognized microdeletion syndrome of 16q11.2q12.2.Clin Genet2008,74:469-475.
5. Koolen DA, Vissers LE, Pfundt R, de Leeuw N, Knight SJ, Regan R, Kooy RF, Reyniers E, Romano C, Fichera M, Schinzel A, Baumer A, Anderlid BM, Schoumans J, Knoers NV, van Kessel AG, Sistermans EA, Veltman JA, Brunner HG, de Vries BB:A new chromosome 17q21.31 microdeletion syndrome associated with a common inversion polymorphism.Nat Genet2006,38:999-1001.
6. Sharp AJ, Hansen S, Selzer RR, Cheng Z, Regan R, Hurst JA, Stewart H, Price SM, Blair E, Hennekam RC, Fitzpatrick CA, Segraves R, Richmond TA, Guiver C, Albertson DG, Pinkel D, Eis PS, Schwartz S, Knight SJ, Eichler EE:
Discovery of previously unidentified genomic disorders from the duplication architecture of the human genome.Nat Genet2006,
38:1038-1042.
7. Sharp AJ, Selzer RR, Veltman JA, Gimelli S, Gimelli G, Striano P, Coppola A, Regan R, Price SM, Knoers NV, Eis PS, Brunner HG, Hennekam RC, Knight SJ, de Vries BB, Zuffardi O, Eichler EE:Characterization of a recurrent 15q24 microdeletion syndrome.Hum Mol Genet2007,16:567-572.
8. Shaw-Smith C, Pittman AM, Willatt L, Martin H, Rickman L, Gribble S, Curley R, Cumming S, Dunn C, Kalaitzopoulos D, Porter K, Prigmore E, Krepischi-Santos AC, Varela MC, Koiffmann CP, Lees AJ, Rosenberg C, Firth HV, de Silva R, Carter NP:Microdeletion encompassing MAPT at chromosome 17q21.3 is associated with developmental delay and learning disability.Nat Genet2006,38:1032-1037.
9. Vissers LE, van Ravenswaaij CM, Admiraal R, Hurst JA, de Vries BB, Janssen IM, van der Vliet WA, Huys EH, de Jong PJ, Hamel BC,
Schoenmakers EF, Brunner HG, Veltman JA, van Kessel AG:Mutations in a new member of the chromodomain gene family cause CHARGE syndrome.Nat Genet2004,36:955-957.
10. Sharp AJ:Emerging themes and new challenges in defining the role of structural variation in human disease.Hum Mutat2009,30:135-144. 11. Cytrynbaum CS, Smith AC, Rubin T, Weksberg R:Advances in overgrowth
syndromes: clinical classification to molecular delineation in Sotos syndrome and Beckwith-Wiedemann syndrome.Curr Opin Pediatr2005,
17:740-746.
12. Gropman AL, Elsea S, Duncan WC Jr, Smith AC:New developments in Smith-Magenis syndrome (del 17p11.2).Curr Opin Neurol2007,
20:125-134.
13. Ballif BC, Theisen A, Coppinger J, Gowans GC, Hersh JH, Madan-Khetarpal S, Schmidt KR, Tervo R, Escobar LF, Friedrich CA, McDonald M, Campbell L, Ming JE, Zackai EH, Bejjani BA, Shaffer LG:Expanding the clinical phenotype of the 3q29 microdeletion syndrome and characterization of the reciprocal microduplication.Mol Cytogenet2008,1:8.
14. Coppinger J, McDonald-McGinn D, Zackai E, Shane K, Atkin JF, Asamoah A, Leland R, Weaver DD, Lansky-Shafer S, Schmidt K, Feldman H, Cohen W, Phalin J, Powell B, Ballif BC, Theisen A, Geiger E, Haldeman-Englert C, Shaikh TH, Saitta S, Bejjani BA, Shaffer LG:Identification of familial and de novo microduplications of 22q11.21-q11.23 distal to the 22q11.21 microdeletion syndrome region.Hum Mol Genet2009,18:1377-1383. 15. Shaffer LG, Theisen A, Bejjani BA, Ballif BC, Aylsworth AS, Lim C,
McDonald M, Ellison JW, Kostiner D, Saitta S, Shaikh T:The discovery of microdeletion syndromes in the post-genomic era: review of the methodology and characterization of a new 1q41q42 microdeletion syndrome.Genet Med2007,9:607-616.
16. Bejjani BA, Saleki R, Ballif BC, Rorem EA, Sundin K, Theisen A, Kashork CD, Shaffer LG:Use of targeted array-based CGH for the clinical diagnosis of chromosomal imbalance: Is less more?Am J Med Genet A2005,
134:259-267.
17. Bejjani BA, Shaffer LG, Ballif BC:The use of microarray technology for cytogenetics.Methods Mol Biol2010,632:125-139.
18. Traylor RN, Fan Z, Hudson B, Rosenfeld JA, Shaffer LG, Torchia BS, Ballif BC:
Microdeletion of 6q16.1 encompassing EPHA7 in a child with mild neurological abnormalities and dysmorphic features: case report.Mol Cytogenet2009,2:17.
19. Ballif BC, Rorem EA, Sundin K, Lincicum M, Gaskin S, Coppinger J, Kashork CD, Shaffer LG, Bejjani BA:Detection of low-level mosaicism by array CGH in routine diagnostic specimens.Am J Med Genet A2006,
140:2757-2767.
20. Lo Nigro C, Chong CS, Smith AC, Dobyns WB, Carrozzo R, Ledbetter DH:
Point mutations and an intragenic deletion in LIS1, the lissencephaly causative gene in isolated lissencephaly sequence and Miller-Dieker syndrome.Hum Mol Genet1997,6:157-164.
21. Williams SN, Locke CJ, Braden AL, Caldwell KA, Caldwell GA:Epileptic-like convulsions associated with LIS-1 in the cytoskeletal control of neurotransmitter signaling in Caenorhabditis elegans.Hum Mol Genet
2004,13:2043-2059.
22. Chuang JL, Wynn RM, Moss CC, Song JL, Li J, Awad N, Mandel H, Chuang DT:Structural and biochemical basis for novel mutations in homozygous Israeli maple syrup urine disease patients: a proposed mechanism for the thiamin-responsive phenotype.J Biol Chem2004,
279:17792-17800.
23. Edelmann L, Wasserstein MP, Kornreich R, Sansaricq C, Snyderman SE, Diaz GA:Maple syrup urine disease: identification and carrier-frequency determination of a novel founder mutation in the Ashkenazi Jewish population.Am J Hum Genet2001,69:863-868.
24. Nobukuni Y, Mitsubuchi H, Akaboshi I, Indo Y, Endo F, Yoshioka A, Matsuda I:Maple syrup urine disease. Complete defect of the E1 beta subunit of the branched chain alpha-ketoacid dehydrogenase complex due to a deletion of an 11-bp repeat sequence which encodes a mitochondrial targeting leader peptide in a family with the disease.
J Clin Invest1991,87:1862-1866.
25. Poltorak A, He X, Smirnova I, Liu MY, Van Huffel C, Du X, Birdwell D, Alejos E, Silva M, Galanos C, Freudenberg M, Ricciardi-Castagnoli P, Layton B, Beutler B:Defective LPS signaling in C3H/HeJ and C57BL/ 10ScCr mice: mutations in Tlr4 gene.Science1998,282:2085-2088. 26. Huitema K, van den Dikkenberg J, Brouwers JF, Holthuis JC:Identification
of a family of animal sphingomyelin synthases.EMBO J2004,23:33-44. 27. Xu ZH, Otterness DM, Freimuth RR, Carlini EJ, Wood TC, Mitchell S, Moon E,
Kim UJ, Xu JP, Siciliano MJ, Weinshilboum RM:Human 3’ -phosphoadenosine 5’-phosphosulfate synthetase 1 (PAPSS1) and PAPSS2: gene cloning, characterization and chromosomal localization.
Biochem Biophys Res Commun2000,268:437-444.
28. Bailey JA, Kidd JM, Eichler EE:Human copy number polymorphic genes.
Cytogenet Genome Res2008,123:234-243.
29. Brunetti-Pierri N, Berg JS, Scaglia F, Belmont J, Bacino CA, Sahoo T, Lalani SR, Graham B, Lee B, Shinawi M, Shen J, Kang SH, Pursley A, Lotze T, Kennedy G, Lansky-Shafer S, Weaver C, Roeder ER, Grebe TA, Arnold GL, Hutchison T, Reimschisel T, Amato S, Geragthy MT, Innis JW, Obersztyn E, Nowakowska B, Rosengren SS, Bader PI, Grange DK,et al:Recurrent reciprocal 1q21.1 deletions and duplications associated with microcephaly or macrocephaly and developmental and behavioral abnormalities.Nat Genet2008,40:1466-1471.
30. Stefansson H, Rujescu D, Cichon S, Pietilainen OP, Ingason A, Steinberg S, Fossdal R, Sigurdsson E, Sigmundsson T, Buizer-Voskamp JE, Hansen T, Jakobsen KD, Muglia P, Francks C, Matthews PM, Gylfason A, Halldorsson BV, Gudbjartsson D, Thorgeirsson TE, Sigurdsson A, Jonasdottir A, Bjornsson A, Mattiasdottir S, Blondal T, Haraldsson M, Magnusdottir BB, Giegling I, Moller HJ, Hartmann A, Shianna KV,et al:Large recurrent microdeletions associated with schizophrenia.Nature2008,
455:232-236.
31. Klopocki E, Schulze H, Strauss G, Ott CE, Hall J, Trotier F, Fleischhauer S, Greenhalgh L, Newbury-Ecob RA, Neumann LM, Habenicht R, Konig R, Seemanova E, Megarbane A, Ropers HH, Ullmann R, Horn D, Mundlos S:
Complex inheritance pattern resembling autosomal recessive inheritance involving a microdeletion in thrombocytopenia-absent radius syndrome.Am J Hum Genet2007,80:232-240.
32. Mefford HC, Sharp AJ, Baker C, Itsara A, Jiang Z, Buysse K, Huang S, Maloney VK, Crolla JA, Baralle D, Collins A, Mercer C, Norga K, de Ravel T, Devriendt K, Bongers EM, de Leeuw N, Reardon W, Gimelli S, Bena F, Hennekam RC, Male A, Gaunt L, Clayton-Smith J, Simonic I, Park SM, Mehta SG, Nik-Zainal S, Woods CG, Firth HV,et al:Recurrent rearrangements of chromosome 1q21.1 and variable pediatric phenotypes.N Engl J Med2008,359:1685-1699.
33. Kumar RA, KaraMohamed S, Sudi J, Conrad DF, Brune C, Badner JA, Gilliam TC, Nowak NJ, Cook EH Jr, Dobyns WB, Christian SL:Recurrent 16p11.2 microdeletions in autism.Hum Mol Genet2008,17:628-638. 34. Marshall CR, Noor A, Vincent JB, Lionel AC, Feuk L, Skaug J, Shago M,
Sloman L, Summers A, Gibbons CA, Teebi A, Chitayat D, Weksberg R, Thompson A, Vardy C, Crosbie V, Luscombe S, Baatjes R,et al:Structural variation of chromosomes in autism spectrum disorder.Am J Hum Genet
2008,82:477-488.
35. Weiss LA, Shen Y, Korn JM, Arking DE, Miller DT, Fossdal R, Saemundsen E, Stefansson H, Ferreira MA, Green T, Platt OS, Ruderfer DM, Walsh CA, Altshuler D, Chakravarti A, Tanzi RE, Stefansson K, Santangelo SL, Gusella JF, Sklar P, Wu BL, Daly MJ:Association between microdeletion and microduplication at 16p11.2 and autism.N Engl J Med2008,358:667-675. 36. Rosenfeld JA, Coppinger J, Bejjani BA, Girirajan S, Eichler EE, Shaffer LG,
Ballif BC:Speech Delays and Behavioral Problems are the Predominant Features in Individuals with Developmental Delays and 16p11.2 Microdeletions and Microduplications.J Neurodev Disord2009,0:1-13. 37. Cheung SW, Shaw CA, Scott DA, Patel A, Sahoo T, Bacino CA, Pursley A, Li J,
Erickson R, Gropman AL, Miller DT, Seashore MR, Summers AM, Stankiewicz P, Chinault AC, Lupski JR, Beaudet AL, Sutton VR,et al:
Microarray-based CGH detects chromosomal mosaicism not revealed by conventional cytogenetics.Am J Med Genet A2007,143:1679-1686. 38. Miller DT, Adam MP, Aradhya S, Biesecker LG, Brothman AR, Carter NP,
Church DM, Crolla JA, Eichler EE, Epstein CJ, Faucett WA, Feuk L, Friedman JM, Hamosh A, Jackson L, Kaminsky EB, Kok K, Krantz ID, Kuhn RM, Lee C, Ostell JM, Rosenberg C, Scherer SW, Spinner NB, Stavropoulos DJ, Tepperberg JH, Thorland EC, Vermeesch JR, Waggoner DJ, Watson MS,et al:Consensus statement: chromosomal microarray is a first-tier clinical diagnostic test for individuals with developmental disabilities or congenital anomalies.Am J Hum Genet86:749-764.
doi:10.1186/1755-8166-3-11
Cite this article as:Neillet al.:Comparative analysis of copy number detection by whole-genome BAC and oligonucleotide array CGH.
Molecular Cytogenetics20103:11.
Submit your next manuscript to BioMed Central and take full advantage of:
• Convenient online submission
• Thorough peer review
• No space constraints or color figure charges
• Immediate publication on acceptance
• Inclusion in PubMed, CAS, Scopus and Google Scholar
• Research which is freely available for redistribution