RESEARCH
A 3D subject-specific model of the spinal
subarachnoid space with anatomically realistic
ventral and dorsal spinal cord nerve rootlets
Lucas R. Sass
1, Mohammadreza Khani
1, Gabryel Connely Natividad
1, R. Shane Tubbs
3, Olivier Baledent
2and Bryn A. Martin
1,4*Abstract
Background: The spinal subarachnoid space (SSS) has a complex 3D fluid-filled geometry with multiple levels of anatomic complexity, the most salient features being the spinal cord and dorsal and ventral nerve rootlets. An accu-rate anthropomorphic representation of these features is needed for development of in vitro and numerical models of cerebrospinal fluid (CSF) dynamics that can be used to inform and optimize CSF-based therapeutics.
Methods: A subject-specific 3D model of the SSS was constructed based on high-resolution anatomic MRI. An expert operator completed manual segmentation of the CSF space with detailed consideration of the anatomy. 31 pairs of semi-idealized dorsal and ventral nerve rootlets (NR) were added to the model based on anatomic reference to the magnetic resonance (MR) imaging and cadaveric measurements in the literature. Key design criteria for each NR pair included the radicular line, descending angle, number of NR, attachment location along the spinal cord and exit through the dura mater. Model simplification and smoothing was performed to produce a final model with minimum vertices while maintaining minimum error between the original segmentation and final design. Final model geometry and hydrodynamics were characterized in terms of axial distribution of Reynolds number, Womersley num-ber, hydraulic diameter, cross-sectional area and perimeter.
Results: The final model had a total of 139,901 vertices with a total CSF volume within the SSS of 97.3 cm3. Volume of the dura mater, spinal cord and NR was 123.1, 19.9 and 5.8 cm3. Surface area of these features was 318.52, 112.2 and 232.1 cm2 respectively. Maximum Reynolds number was 174.9 and average Womersley number was 9.6, likely indicat-ing presence of a laminar inertia-dominated oscillatory CSF flow field.
Conclusions: This study details an anatomically realistic anthropomorphic 3D model of the SSS based on high-res-olution MR imaging of a healthy human adult female. The model is provided for re-use under the Creative Commons Attribution-ShareAlike 4.0 International license (CC BY-SA 4.0) and can be used as a tool for development of in vitro and numerical models of CSF dynamics for design and optimization of intrathecal therapeutics.
Keywords: Spinal subarachnoid space, Intrathecal drug delivery, 3D reconstruction, Cerebrospinal fluid, Spinal cord, Dura mater, Nerve roots, Spinal cord injury, Neurapheresis, Cerebrospinal fluid hypothermia
© The Author(s) 2017. This article is distributed under the terms of the Creative Commons Attribution 4.0 International License (http://creativecommons.org/licenses/by/4.0/), which permits unrestricted use, distribution, and reproduction in any medium, provided you give appropriate credit to the original author(s) and the source, provide a link to the Creative Commons license, and indicate if changes were made. The Creative Commons Public Domain Dedication waiver (http://creativecommons.org/ publicdomain/zero/1.0/) applies to the data made available in this article, unless otherwise stated.
Background
Detailed analysis of cerebrospinal fluid (CSF) dynamics is thought to be of importance to help understand diseases
of the central nervous system such as Chiari malforma-tion [1], hydrocephalus [2, 3] and intracranial hyperten-sion [4]. CSF therapeutic interventions have also been investigated such as intrathecal drug delivery [5], CSF fil-tration or “neurapheresis” (also previously termed liquor-pheresis) [6, 7] and CSF hypothermia (cooling) treatment [8]. The exact relation, if any, of CSF dynamics to these disorders and treatments is under investigation. There
Open Access
*Correspondence: brynm@uidaho.edu
4 Department of Biological Engineering, University of Idaho, 875 Perimeter Dr. MC0904, Moscow, ID 83844-0904, USA
are many opportunities for researchers to make a contri-bution to the field.
A significant contribution to our understanding of CSF dynamics has been made by the use of computational fluid dynamics (CFD) modeling; an engineering tech-nique that allows detailed analysis of the CSF flow field that is not possible by MRI measurements or invasive means. In addition, CFD allows for variational analysis, where specific parameters in the model can be altered to understand their distinct contribution. Major CFD-based contributions to our knowledge of CSF physiology have been made in the areas of CSF ventricular dynamics [9], drug transport [10, 11], filtration [12], alterations in brain pathologies [13–15], spinal cord pathology [16] and wave mechanics [17, 18].
Computational fluid dynamics modeling relies on accu-rate representation of boundary conditions that are diffi-cult to define because of the intricate spinal subarachnoid space (SSS) geometry, complex CSF flow field and lack of material property information about the central nervous system tissues. Each CFD modeling approach has neces-sitated varying degrees of boundary condition simpli-fication with respect to anatomy and physiology. When considering anatomy, CFD models that attempt to accu-rately imitate the spinal geometry are generally built from subject-specific MRI scans. However, even for experts in spinal neuroanatomy, magnetic resonance (MR) imag-ing resolution and artifacts make subject-specific ana-tomical reconstruction of the SSS difficult, particularly for engineers who often have limited anatomical knowl-edge. Herein, we provide to the research community an open-source subject-specific 3D model of the com-plete SSS with idealized spinal cord nerve rootlets (NR) licensed under the Creative Commons Attribution-Shar-eAlike 4.0 International license (CC BY-SA 4.0). This also includes the in vivo measured CSF flow waveforms along the spine. The open-source model can allow multiple researchers a tool to investigate and compare results for CSF dynamics related phenomena and technologies such as pharmacokinetics of intrathecal drug distribution, neurapheresis and hypothermia.
Methods
Subject selection
A single, representative healthy, 23-year-old, female Cau-casian subject was enrolled in this study. The subject had no previous history of neurological or cardiovascular disorders.
MRI CSF flow measurement protocol
All MRI measurements were obtained with a Gen-eral Electric 3T scanner (Signa HDxt, software 15.0_ M4_0910.a). CSF flow data were collected at three
vertebral levels, C2–C3, C7–T1 and T10–T11, using phase-contrast MRI with retrospective electrocardio-gram (ECG) gating and 32 cardiac phases [14]. Each slice had a thickness of 5.0 mm and an in-plane resolution of 0.54 × 0.54 mm. Orientation of the slice was made per-pendicular to the CSF flow direction and positioned verti-cally by intersection with a vertebral disk (i.e. C2–C3). A flip angle, TR, TE and VENC was used with a value of 25°, 13.4, 8.26 and 8 cm/s respectively. Detailed information on imaging parameters is provided by Baledent et al. [19].
CSF flow quantification
Oscillatory cardiac-related CSF flow was quantified for the axial locations located at the vertebral disk at the C2– C3, C7–T1 and T10–T11 vertebral levels. As detailed in our previous studies [14, 20], Matlab was used to com-pute the CSF flow waveform, Q(t), based on integration of
the pixel velocities with Q(t) = ∑Apixel [Vpixel(t)], where Apixel is the area of one MRI pixel, Vpixel is the velocity for the corresponding pixel, and Q(t) is the summation of the
flow for each pixel of interest. A smooth distribution of CSF flow along the spine was achieved by interpolating CSF flow between each axial measurement location [21]. Similar to previous studies, the diastolic CSF flow cycle phase was extended in cases when necessary [22]. For correcting eddy current offsets, the cyclic net CSF flow was offset to produce zero net flow over a complete flow cycle [14].
MRI CSF space geometry protocol
To collect geometric measurements with improved CSF signal, 3D fast imaging employing steady state acquisition (3D FIESTA) was used, and acquisitions were realized with free breathing. The coils used were the HD Neck-Spine Array with 16 Channels for the spine and the 29 element phased array for the upper-neck. Images were collected in three volumes, from the top of the brain to C7, from C5 to T9, and from T9 to S5, with each sec-tion containing 140, 104 and 104 sagittal T2-weighted images respectively. The field of view (FOV) size was 30 cm × 30 cm × 7 cm for the craniocervical volume, and 30 cm × 30 cm × 5.25 cm for both the thoracic and lumbosacral volumes. In-plane voxel spacing was 0.547 × 0.547 mm and slice thickness was 1 mm with slice spacing set at 0.499 mm. Echo times (TE) were 1.944, 2.112, 2.100 and repetition times (TR) were 5.348, 5.762, 5.708 for the craniocervical, thoracic, and lum-bosacral volumes respectively. Total imaging time for the three levels was ~ 45 min.
CSF space segmentation
segment the MRI data. Similar to our previous work [24], the cervical, thoracic and lumbar MR image sets were manually segmented in the axial orientation using the semi-automatic contrast-based segmentation tool. The segmented region extended from the foramen magnum to the end of the dural sac. One expert operator com-pleted the segmentation, as our previous study showed strong inter-operator reliability of SSS geometric param-eters [24]. A second expert operator reviewed the images to confirm region selection, and in areas of disagreement, discussed in detail with respect to the anatomy. Hyper-intensities in the T2-weighted image sets near the epi-dural space were excluded from the model segmentation
(Fig. 1). MRI data were not collected in high-resolution
for the entire brain, and thus the cortical and ventricular CSF spaces were not included in the model. After com-pletion, each segmentation was exported as an .STL file with Gaussian smoothing option applied (standard devia-tion = 0.80 and maximum approximation error = 0.03).
Model alignment
The open source program, Blender (Version 2.77a, Amster-dam, Netherlands), was used for the majority of mesh mod-ifications and all modeling operations in this study. After segmentation, the .STL files generated were imported into Blender. Because of the global reference coordinate set by the MRI, segmentations generated from different image series were automatically registered. However, 3D rigid
body translation (~ 5 mm maximum) was required to align each model section due to a small degree of subject move-ment between the MR image acquisitions. These transla-tions were performed based on a visual best fit.
Geometry remeshing and smoothing
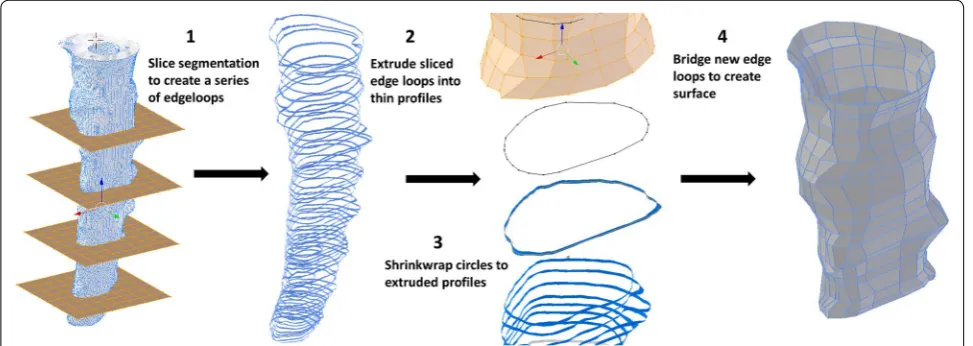
The following operations were completed to create a lowest-resolution semi-regular surface mesh of the spi-nal cord and dura while maintaining an accurate repre-sentation of the original geometry. After alignment, the triangulated .STL segmentations were converted to quad-rilateral meshes using the automatic conversion tool “tris to quads” in Blender. The spinal cord and dural surfaces were separated, and an array of planes was placed along the entire spinal segmentation at a roughly orthogonal orientation to the spinal trajectory. Vertical spacing of these planes was determined by choosing an inter-plane interval (~ 5 mm) that preserved surface contours; this required a minimum of three planes to preserve a change in surface concavity. The circumferential contour of the spinal cord and dura was obtained at each plane using the “intersect (knife)” operation in Blender. The original geometry was then removed. Each surface contour was then vertically extruded ~ 1 mm. Simple circle meshes were place at each contour using the “add circle” com-mand, the “shrink wrap” modifier was then used to form these circles around each profile. The number of vertices in the circles wrapped to the dural and spinal cord pro-files was specified to be 55 and 32 respectively. These parameters were determined based on visual inspec-tion of the shrink-wrap fit at the largest profile diameter located at the foramen magnum. Manual adjustment of individual vertices was made to preserve a uniform ver-tex distribution and surface contour at each slice. To cre-ate a continuous quadrilcre-ateral mesh of both the spinal
cord and dura, the “bridge edge loops” command was used between adjacent contours (Fig. 2).
Manual adjustments were then made by sculpting the remeshed surfaces within the “sculpt mode” workspace in Blender to produce ~ 50% visual interference with the original segmentation surface (Fig. 3). To further improve surface accuracy, a combination of a shrink-wrap and “smooth” modifiers were used simultaneously. Importantly, the “keep above surface” option and “offset” options on the shrink-wrap modifier were used. The val-ues for shrink-wrap offset and smoothing factor in their respective modifier menus must be determined by a trial and error method for each unique mesh until the desired smoothness is justified with overall volume. In this study, values of 0.04 and 0.900 were used for offset and smooth-ing factor respectively.
Nerve root modeling
The 31 NR pairs, starting from the craniocervical junc-tion, were modeled using the following methodology. For each rootlet, a “circle” mesh was extruded from the SC junction to the dural exit location in Blender. The cur-vature, radicular line (RL) and descending angle (DA) for each rootlet were determined based on the subject specific segmentation, average cadaveric measurements from the literature and anatomic reference imagery [25–
28] (Fig. 4). The exact method varied by location due to variations in the completeness of the data types; these differences are described below. Note: the 31st nerve root, or coccygeal nerve did not bifurcate into a nerve root pair until after leaving the intrathecal CSF space.
In the left side of the cervical spine, segmentations of the NR were possible to obtain directly from the ana-tomic MR imaging. These were imported and aligned with the existing model in Blender. A “circle” mesh was
extruded along each segmented path and the diameter of this circle was defined as the average NR diameter or thickness from cadaveric measurements for each loca-tion. Additionally, in the cervical spine the spinal entry point of each rootlet cylinder was scaled in the cra-nial direction (~ 150%) along the spinal cord to create a blended transition. Finally, cervical rootlets were mir-rored left to right and small adjustments were made to fit them to the correct exit points on the right side of the dura. Mirroring was applied as the NR intersection loca-tion at the spinal cord and dura was nearly identical for the left and right side NR.
In the thoracic spine, segmentations were only able to inform NR entry and exit points, and by extension, DA. It is possible that NR points in the thoracic spine were dif-ficult to visualize within this region due to image blurring stemming from respiratory-related tissue motion. NR
morphology in the thoracic spine is a steeply descending and tightly packed bundle. Therefore, to reduce unneces-sary mesh complexity, a standard NR set was developed as a simplified cylinder with a diameter based on the average NR bundle size in the thoracic region. In addition to this main cylinder, a secondary cylinder was incorpo-rated at the SC entry point to more closely imitate NR branching near the spinal cord. This cylinder extends from just below the primary rootlet entry point to a loca-tion approximately one-third of way along the primary rootlet; overall a steeply descending deltoid morphol-ogy is created. As in the cervical spine, a blended transi-tion was created at the SC entry point for each NR. This standard NR set was mirrored left to right of the SC and duplicated along the SC for the entire thoracic region.
In the lumbosacral spine, the NR form the cauda equina. High MR image contrast made complete seg-mentations of this region possible and NR modeling was completed as in the cervical spine. NR were again simpli-fied as a single cylinder of average diameter. Because of this, RLs for this region were not possible to define.
Geometric analysis
Geometric parameters were calculated along the com-plete spinal mesh at 1 mm intervals [21]. SSS cross-sec-tional area, Acs = Ad − Ac − Anr, was determined based on cross-sectional area of the NR (Anr), SC (Ac) and dura (Ad). Hydraulic diameter for internal flow within a tube, DH = 4Acs/Pcs, was determined based on the cross-sec-tional area and wetted perimeter, Pcs = Pd + Pc + Pnr. Wetted perimeter was computed as the sum of the NR (Pnr), SC (Pc) and dura (Pd) perimeters. Each of these parameters was calculated within a user defined func-tion compiled in ANSYS FLUENT (Ver. 18.1, ANSYS inc, Canonsburg, PA). Note, for geometric analysis, the coc-cygeal nerve (spinal nerve) was considered to be a part of the spinal cord.
Hydrodynamic analysis
The hydrodynamic environment at 1 mm slice intervals along the entire spine was assessed by Reynolds num-ber based on peak flow rate, Re= QsysDH
νAcs , and
Womers-ley number based on hydraulic diameter. For Reynolds number, Qsys is the temporal maximum of the local flow at each axial interval along the spine obtained by inter-polation from the experimental data and ν is the kin-ematic viscosity of the fluid. Similar to previous studies, CSF viscosity was assumed to be that of water at body temperature. To evaluate the presence of laminar flow, (Re < 2300), similar to previous studies in CSF and bio-fluids mechanics, Reynolds number was evaluated at peak systolic flow along the spine. Womersley number, α= D2h
√
ω/ν, where ω is the angular velocity of the
volume flow waveform ω = 2π/T, was used to quantify the ratio of unsteady inertial forces to viscous forces. This ratio was previously found to be large relative to viscous forces by Loth et al. [29]. A value greater than 5
for Womersley number indicates transition from para-bolic to “m-shaped” velocity profiles for oscillatory flows [30]. CSF pulse wave velocity (PWV) was quantified as an indicator of CSF space compliance. Timing of peak sys-tolic CSF flow rate along the spine was determined based on our previously published method [31]. In brief, a lin-ear fit was computed based on the peak systolic flow rate arrival time with the slope being equivalent to the PWV.
Results
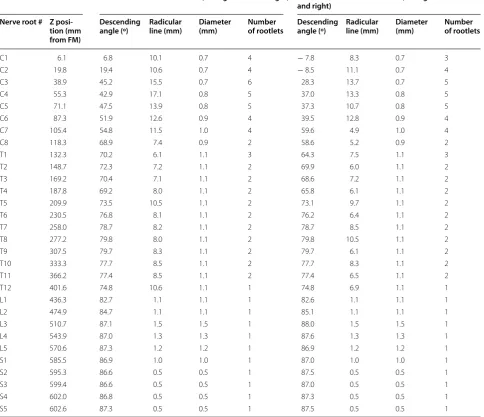
The final model includes the 31 pairs of dorsal and ven-tral NR, spinal cord with coccygeal nerve and dural wall (Fig. 4). Final values for the vertical location where the NR join into the dura (Z position), radicular line, descending angle, root thickness, and number of rootlets for both dorsal and ventral NR are provided (Table 1). The percent difference of the final remeshed dura volume compared to the original dura segmentation was 2.7% (original segmentation volume = 100.5 cm3 and a final
remeshed volume = 103.2 cm3). Addition of NR reduced
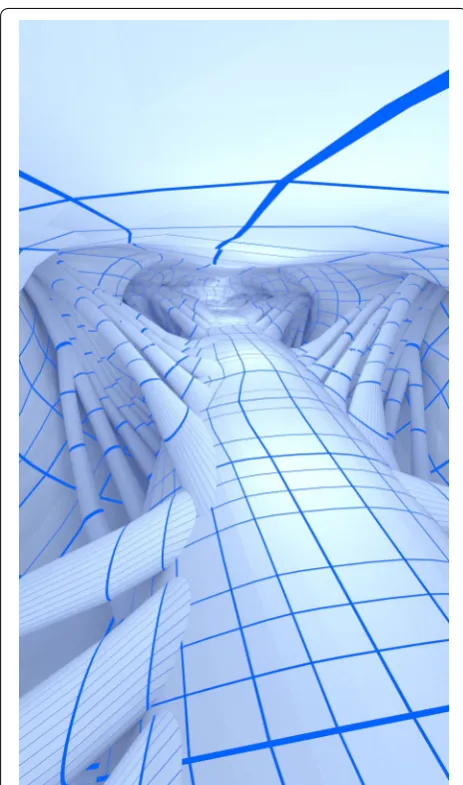
the final remeshed volume to 97.3 cm3. A 3D
visualiza-tion of the internal geometry is shown in Fig. 5.
Geometric parameters
Total intrathecal CSF volume below the foramen mag-num was 97.3 cm3 (Table 3). Volumes of the dura mater,
spinal cord and 31 NR pairs were 123.0, 19.9 and 5.8 cm3
respectively. The surface areas for the dura mater, spinal cord and NR were 318.5, 112.2 and 232.1 cm2
respec-tively. The average cross-sectional areas of the dura mater, spinal cord and NR were 2.03, 0.33 and 0.10 cm2
respectively. The length of the spinal cord down to the conus and spinal dura mater were ~44.8 cm and 60.4 cm respectively. Note, geometric parameters for the spinal cord were computed based on the spinal cord with the coccygeal nerve included as one continuous structure.
3D model files
Both quadrilateral and triangulated meshes for NR, spi-nal cord, and dura are provided (six files in total) with Creative Commons Attribution-ShareAlike 4.0 Inter-national (CC BY-SA 4.0) license (Additional file 1, note: file units are in millimeters). The number of polygons in the quadrilateral meshes of the NR, spinal cord and dura wall was 61,749, 35,905 and 27,281 respectively for a total of 124,935 quadrangles. The number of polygons in the triangulated meshes of the NR, spinal cord, and dura were 199,372, 71,870 and 54,613 respectively for a total of 325,855 triangles. In addition, to allow reduced order modeling of intrathecal CSF flow [32], a 1D graph of model x, y, z-coordinates for the dura and spinal cord centroids are provided in a Additional file 1. This file also contains the corresponding numeric values for all
geometric and hydrodynamic parameters at 1 mm inter-vals along the spine.
CSF flow
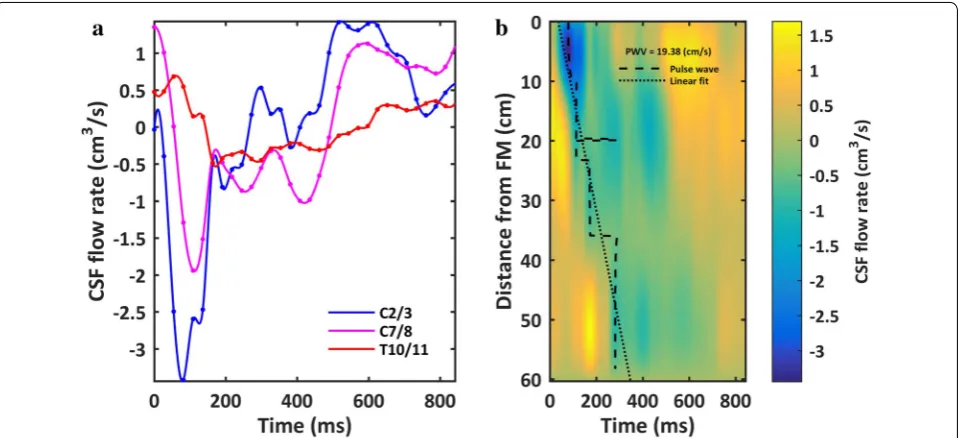
Peak-to-peak CSF flow amplitude measured at the C2– C3, C7–C8 and T10–T11 was 4.75, 3.05 and 1.26 cm3/s
respectively (Fig. 6a). These were measured at an axial position relative to the model end (foramen magnum) of 4.0, 12.5, and 35.4 cm respectively. Based on the inter-polated CSF flow waveform between MRI measurement locations, the maximum peak and mean CSF velocities were present at 38 mm (~ C4–C5, Fig. 7f). Minimum value of peak and mean CSF velocities occurred in the lower lumbar spine and within the thoracic spine from 390 to 410 mm (~ T7–T10, Fig. 7f).
Cerebrospinal fluid flow oscillation had a decreasing magnitude and considerable variation in waveform shape along the spine (Fig. 6a). Spatial temporal distribution of CSF flow rate along the SSS showed that maximum CSF flow rate occurred caudal to C3–C4 at ~ 40 mm (Fig. 6b). CSF pulse wave velocity (PWV) was estimated to be 19.4 cm/s (Fig. 6b).
Hydrodynamic parameters
Average Reynolds and Womersley number was 68.5 and 9.6 respectively. Womersley number ranged from 1.6 to 22.96 (Table 2, Fig. 7d). Maximum Womersley num-ber was present near the foramen magnum (α = 22.96). Womersley number had local minima within the cer-vical spine and just rostral to the intrathecal sac.
Table 1 Anatomic measurements obtained from the final 3D spine model
Dorsal rootlet measurements (average of left and right) Ventral rootlet measurements (average of left and right)
Nerve root # Z posi-tion (mm from FM)
Descending
angle (º) Radicular line (mm) Diameter (mm) Number of rootlets Descending angle (º) Radicular line (mm) Diameter (mm) Number of rootlets
C1 6.1 6.8 10.1 0.7 4 − 7.8 8.3 0.7 3
C2 19.8 19.4 10.6 0.7 4 − 8.5 11.1 0.7 4
C3 38.9 45.2 15.5 0.7 6 28.3 13.7 0.7 5
C4 55.3 42.9 17.1 0.8 5 37.0 13.3 0.8 5
C5 71.1 47.5 13.9 0.8 5 37.3 10.7 0.8 5
C6 87.3 51.9 12.6 0.9 4 39.5 12.8 0.9 4
C7 105.4 54.8 11.5 1.0 4 59.6 4.9 1.0 4
C8 118.3 68.9 7.4 0.9 2 58.6 5.2 0.9 2
T1 132.3 70.2 6.1 1.1 3 64.3 7.5 1.1 3
T2 148.7 72.3 7.2 1.1 2 69.9 6.0 1.1 2
T3 169.2 70.4 7.1 1.1 2 68.6 7.2 1.1 2
T4 187.8 69.2 8.0 1.1 2 65.8 6.1 1.1 2
T5 209.9 73.5 10.5 1.1 2 73.1 9.7 1.1 2
T6 230.5 76.8 8.1 1.1 2 76.2 6.4 1.1 2
T7 258.0 78.7 8.2 1.1 2 78.7 8.5 1.1 2
T8 277.2 79.8 8.0 1.1 2 79.8 10.5 1.1 2
T9 307.5 79.7 8.3 1.1 2 79.7 6.1 1.1 2
T10 333.3 77.7 8.5 1.1 2 77.7 8.3 1.1 2
T11 366.2 77.4 8.5 1.1 2 77.4 6.5 1.1 2
T12 401.6 74.8 10.6 1.1 1 74.8 6.9 1.1 1
L1 436.3 82.7 1.1 1.1 1 82.6 1.1 1.1 1
L2 474.9 84.7 1.1 1.1 1 85.1 1.1 1.1 1
L3 510.7 87.1 1.5 1.5 1 88.0 1.5 1.5 1
L4 543.9 87.0 1.3 1.3 1 87.6 1.3 1.3 1
L5 570.6 87.3 1.2 1.2 1 86.9 1.2 1.2 1
S1 585.5 86.9 1.0 1.0 1 87.0 1.0 1.0 1
S2 595.3 86.6 0.5 0.5 1 87.5 0.5 0.5 1
S3 599.4 86.6 0.5 0.5 1 87.0 0.5 0.5 1
S4 602.0 86.8 0.5 0.5 1 87.3 0.5 0.5 1
Maximum Reynolds number was 174.9 and located at C3–C4.
Discussion
The intrathecal CSF space is a complex 3D fluid-filled geometry with multiple levels of anatomic complex-ity, the most salient features being the spinal cord, dura mater and dorsal and ventral spinal cord NR. An accu-rate anthropomorphic representation of these features is needed as a tool for development of in vitro and numeri-cal models of CSF dynamics that can be used to inform and optimize CSF-based therapeutics. In this paper, we provide a detailed and downloadable anthropomorphic 3D model (Additional file 1) of the intrathecal CSF space that is licensed for re-use under the Creative Commons
Attribution-ShareAlike 4.0 International license (CC BY-SA 4.0). CSF flow data, measured by PCMRI, is pro-vided as a validation data set for numerical modeling. The model is characterized in terms of axial distribution of intrathecal CSF dynamics with detailed information on various hydrodynamic parameters including Reyn-olds number, Womersley number, hydraulic diameter and CSF velocities. Herein, we discuss the model in terms of its segmentation, remeshing, key modeling considera-tions and comparison to previous anatomic and mod-eling studies and in vivo CSF dynamics measurements.
Segmentation of the intrathecal CSF space
A variety of software exists to help reconstruct MRI DICOM image files in 3D. Many segmentation software platforms provide automatic segmentation algorithms that can deliver relatively quick visualizations but these segmentations are often not suitable to create 3D models that can be used for CFD modeling or easily exported for 3D printing [33]. In this study, we used the open-source program ITK-SNAP (“The Insight Segmentation and Registration Toolkit”, http://www.itk.org) that supports automatic, semi-automatic and manual approaches. The final model was constructed based on manual segmen-tation of each slice along the spine by an expert opera-tor previously trained in intrathecal CSF segmentation procedures.
Despite the popularity of CFD studies conducted in the SSS, there is a lack of detailed information on intrathecal segmentation methods based on anatomic MR imaging. The craniocervical junction is highly vascularized with relatively large blood vessels that transverse the region, including the vertebral arteries (3.7 mm diameter for the left vertebral artery and 3.4 mm diameter for the right vertebral artery [34]) and the anterior spinal artery (0.3– 1.3 mm diameter [35]). Spinal cord NR can sometimes be seen as dark regions crossing the SSS (Fig. 1d–f). Their length and obliqueness increases progressively moving towards the feet [36]. Denticulate ligaments are located between adjacent sets of NR in the cervical and thoracic spinal cord segments. These structures are too small to be quantified by MRI (thickness of ~ 0.1 mm) but may also appear as slightly darkened regions of SSS on each side of the spinal cord. The CSF on the anterior or pos-terior side of the spinal cord near the foramen magnum may appear dark in coloration due to flow void artifacts resulting from elevated CSF velocities at this region (and others along the SSS, Fig. 1). Although these regions can appear relatively dark on MR imaging, they should be considered as fluid.
Along the entire spine, the epidural space can appear hyper intense due to the presence of epidural fat (Fig. 1e– f). Care should be taken to not confuse these areas with
CSF as it can be difficult to visualize the relatively thin dura mater that separates the two spaces. This ambigu-ity often confounds automatic segmentation tools and thresholding should be reviewed in detail to ensure accu-racy. From our experience, no presently available auto-mated algorithm can avoid over-segmentation of epidural fat, as there can be virtually no border visible between these two regions at many locations along the spine due to MR image resolution limits that do not allow visualiza-tion of the relatively thin dura.
The cauda equina begins around the conus medullaris that is located near the lower border of the first lumbar vertebra. This structure is formed by the long rootlets of the lumbar, sacral and coccygeal nerves that run verti-cally downward to their exit. Similar to the spinal cord NR, ligaments and blood vessels, these small bundles of nerves are not possible to accurately quantify with the current MR image resolution through segmentation alone. In the presented model, they are modeled as curv-ing cylinders as described in our methods with reference to cadaveric studies in the literature and visual interpre-tation and measurement of NR insertion at the spinal cord and dura.
Modeling considerations with small anatomy
Although the spinal cord and dura mater were easily visible, smaller structures such as NR were not clearly discernible in the MRI scans used in this study. In our previous study [36], we grossly modeled spinal cord NR as single airfoil shaped structures within the cervical spine only. For the present complete spine model for a
healthy subject, we individually modeled the number of nerve rootlets at all vertebral levels (see Fig. 4 for ana-tomic depiction of nerve rootlets and Table 1 for number of nerve rootlets). The nerve rootlets were each placed with reference to the high-resolution MR imaging, 3D segmented geometry and published cadaveric measure-ments and images in the literature. Because no single source contained enough information to fully reconstruct the NR geometry, the final model does not strictly adhere to any single set of tabular parameters, but rather, is a best judgment based on the collective information (see Table 1 for parameters). Furthermore, due to limita-tions in the data as well as the time intensive nature of the modeling process, NR were mirrored left to right along the spinal cord. The duplicate side was subjected to < 3.0 mm translation as necessary to best fit rootlets to the spinal and dural geometry. NR vertical positioning is only referenced by the corresponding vertebral level in the literature. Therefore, vertical positioning was based solely on segmentation data marking SSS entry and exits locations. The resulting model is subject-specific in terms of NR location and orientation, but idealized in terms of the exact structure (Fig. 4).
Volumetric differences in geometry
A large portion of this work is centered on the quadri-lateral remeshing of the spinal and dural surfaces. In this case, introducing volumetric error was a primary con-cern during this process. This was largely compensated by selectively increasing mesh resolution in areas with higher degree of curvature while reducing resolution in
locations with little curvature. However, discrepancies still occurred and it was necessary to further modify the entire surface fit as described in the “Methods”. Excluding the NR, which were not originally segmented, the final difference between segmented and remeshed SSS vol-umes is 2.7% (Fig. 3). Our previous study showed inter-operator volumetric error for SSS CSF segmentation to be < 2.7% [24], a value comparable to the percent differ-ence in the remeshed volume for the present study. In an in vitro cervical SSS model, segmentation inaccuracy was quantified to be 15% larger than the original geometry STL file used to create the model [37]. In combination, these findings indicate a high-degree of segmentation and remeshing reliability, but do not rule out the possibility
for significant degree of segmentation inaccuracy. Unfor-tunately, the true SSS geometry is not known and there-fore not possible to validate for accuracy.
Comparison of model CSF volume to measurements in the literature
While the provided model is subject-specific, it can be compared to other MRI-based studies to help under-stand its similarity to the general population. Overall, the provided model had a SSS volume of 97.34 cm3 and
showed a strong similarity with the previous studies cited that, on average, reported SSS volume to be 90.3 cm3
[38–45]. Table 3 gives a review of studies that used MRI to quantify the volume of anatomical features within the
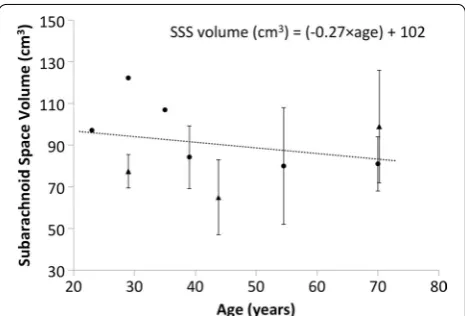
full spine and lumbosacral spine for healthy subjects. In collection, these published studies indicate a decreas-ing trend in CSF volume with age given by: SSSvolume(ml )
= ( − 0.27 × age) + 102 (Fig. 8). The provided model had a volume that was on the higher end of the average reported values, however it was also for a relatively young 23-year-old subject (Table 3). It should be noted that the model was based on high-resolution 0.5 mm isotropic MR images, whereas all cited studies were based on MR images with considerably lower resolution. In addition, many of these studies used axial images with ~ 8 mm slice spacing and a relatively large slice thickness.
The provided subject-specific 3D model was based on a combination of subject-specific MR imaging (Fig. 1) and cadaveric measurements by Bozkurt et al. [25], Zhou et al. [26], Hauck et al. [27] and Lang et al. [28]. The cadaveric studies used to define the NR specifications were selected based on their completeness of information that included spinal cord NR descending angle, radicu-lar line and diameter. As expected, a local enradicu-largement of the spinal cord cross-sectional area was present near the lumbosacral (L2–S2) and cervical (C5–T1) enlarge-ments located near 13 and 40 cm respectively below the
Table 2 Summary of geometric and hydrodynamic param-eters obtained from the final 3D spine model
a Average, maximum and minimum values are based 1 mm slice intervals along
the entire spine including the coccygeal nerve
Parameter Average ± std.
Maxi-mum Mini-mum
Perimeter SCa (cm) 1.85 ± 1.00 4.62 0.14
Perimeter DM (cm) 5.26 ± 1.01 11.59 1.25 Perimeter NR (cm) 3.84 ± 2.81 10.08 0.00 Perimeter SSS (cm) 10.96 ± 3.12 19.91 1.6 Area SCa (cm2) 0.33 ± 0.23 1.34 0.00
Area DM (cm2) 2.03 ± 0.79 6.95 0.04
Area NR (cm2) 0.10 ± 0.08 0.28 0.00
Area SSS (cm2) 1.61 ± 0.65 5.62 0.04
Hydraulic diameter HD (cm) 0.59 ± 0.14 1.40 0.10
Re 68.46 ± 39.00 174.9 0.00
α 9.59 ± 2.27 22.96 1.64
Usys (cm/s) − 0.83 ± 0.51 N/A − 2.16
Udia (cm/s) 0.83 ± 0.34 1.47 N/A Qsys (cm3/s) − 1.29 ± 0.87 N/A − 3.44
Qdia (cm3/s) 1.22 ± 0.39 1.69 N/A
PWV (cm/s) 19.4 N/A N/A
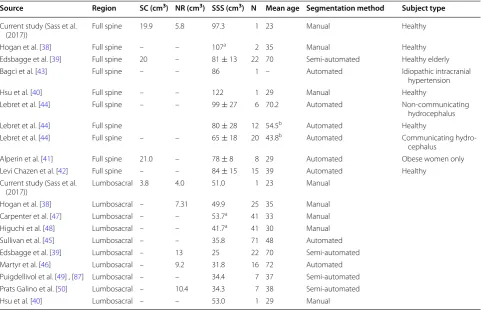
Table 3 Review of studies that include volumetric quantification of anatomic regions within the spine using MR imaging
a Indicates studies where NR volume was included in the calculation
b Value obtained from personal correspondence with author
Source Region SC (cm3) NR (cm3) SSS (cm3) N Mean age Segmentation method Subject type
Current study (Sass et al.
(2017)) Full spine 19.9 5.8 97.3 1 23 Manual Healthy
Hogan et al. [38] Full spine – – 107a 2 35 Manual Healthy
Edsbagge et al. [39] Full spine 20 – 81 ± 13 22 70 Semi-automated Healthy elderly Bagci et al. [43] Full spine – – 86 1 – Automated Idiopathic intracranial
hypertension
Hsu et al. [40] Full spine – – 122 1 29 Manual Healthy
Lebret et al. [44] Full spine – – 99 ± 27 6 70.2 Automated Non-communicating hydrocephalus Lebret et al. [44] Full spine 80 ± 28 12 54.5b Automated Healthy
Lebret et al. [44] Full spine – – 65 ± 18 20 43.8b Automated Communicating
hydro-cephalus Alperin et al. [41] Full spine 21.0 – 78 ± 8 8 29 Automated Obese women only Levi Chazen et al. [42] Full spine – – 84 ± 15 15 39 Automated Healthy
Current study (Sass et al.
(2017)) Lumbosacral 3.8 4.0 51.0 1 23 Manual
Hogan et al. [38] Lumbosacral – 7.31 49.9 25 35 Manual Carpenter et al. [47] Lumbosacral – – 53.7a 41 33 Manual
Higuchi et al. [48] Lumbosacral – – 41.7a 41 30 Manual
foramen magnum (Fig. 7). These locations corresponded to the expected enlargement due to gray matter increase within those regions.
The exact 3D structure of the 31 NR pairs and coc-cygeal nerve were idealized based on the literature as it was not possible to extract their exact detailed geom-etry directly from MR imaging. However, it was possible to place each NR pair on a subject-specific basis at the insertion point in the spinal cord and exit point at the dura (details in “Methods”). The resulting model had a total NR volume of 5.8 cm3. This value is similar to that
quantified by Hogan et al. (1996) and Martyr et al. (2011) with 7.31 and 9.2 cm3 respectively [38, 46]. The relatively
smaller volume in our model is likely due to the smaller size of NR between the L2–S2 levels in comparison to Hogan’s cadaveric measurements [40]. In addition to the noted wide individual variability, Hogan et al. [38] esti-mated NR volume assuming estimate root lengths from relatively low resolution MRI data. Other studies quanti-fying cauda equina volume also based their results solely on estimations from MRI segmentations [39, 45–50].
Total CSF volume in healthy adults
Total CSF volume in healthy adults has been reported to be ~ 150 mL in many standard medical textbooks [42, 51, 52] and recently published review articles [53,
54]. This value has become ubiquitous within the lit-erature to the point of often not being cited with refer-ence to any empirical study. Methods for CSF volume estimation by relatively crude casting techniques were originally applied [55]. These estimates were later criti-cized as being prone to significant degree of error [56,
57]. Review of more recent literature using non-invasive MRI-based methods indicates that total CSF volume in healthy adults to range from ~ 250 to 400 cm3 [42, 58–61]. The difference in CSF volume determined from MRI versus invasive techniques is likely an underlying reason for the discrepancy. The referenced CSF volu-metric studies using non-invasive techniques with high-resolution MR imaging may provide a more accurate estimate of total CSF volume. However, invasive meas-urements provide a lower bound for total CSF volume. More research is needed to fully establish detailed infor-mation about CSF volumetric distribution throughout the intracranial cisterns and subarachnoid space of the brain and spine.
Comparison of 3D model with previous geometries used for CFD modeling
At present, all models of the spinal SSS rely on varying degrees of simplification or idealization, often neglecting realistic spinal canal geometry and/or microanatomy. The simplest geometries are coaxial circular annuli employed by Lockey et al. [62], Berkouk et al. [63], Hettiarachchi et al. [64] and Elliott [65] that in some cases also included pathological variations, as well as in Bertram et al. [17] which used an idealized axial distribution for SSS area. Stockman [66] used an elliptical annuli and included microanatomical features, whereas Kuttler [67] mod-eled an elliptical annulus based on work by Loth et al. [29] who created a SSS from realistic SSS cross sections. The axial distribution of our model spinal cord and dura shows strong similarity to Loth et al. [29], Fig. 3, with a peak SSS area located at the FM and dural sac lumbar enlargement (Fig. 7b). Hsu et al. [40], Pahlavian et al. [36] and Tangen et al. [10, 12] developed CFD models with a subject specific geometry of the SSS reconstructed from MR data. The Pahlavian and Tangen CFD models also included varying degrees of NR detail. Pahlavian ideal-ized NR as smooth airfoil-shaped flat objects and limited the model to the cervical spine. Yiallourou et al. [68] con-ducted a CFD study to investigate alterations in crani-ocervical CSF hydrodynamics in healthy controls versus patients with Chiari malformation. In that study, NR were not included in the CFD geometry. The CFD-based velocity profile results were found to lack similarity with in vivo 4D Flow MRI measurements. It was concluded that NR or other relatively small anatomic features are likely needed to accurately reflect CSF velocities within the cervical spine.
The geometric model presented in this study contrib-utes NR microanatomy as discreet rootlets and cauda equina within a complete subject-specific SSS geometry. The model geometry is provided in a downloadable for-mat with the dura, spinal cord and NR as separate files
in the .STL (triangular) and .OBJ (quadrilateral) formats (six files in total). This allows modification of each sur-face separately for modeling purposes. For example, the model could be altered locally to increase the thecal sac volume during upright posture.
CSF dynamics quantification
The computed parameters for CSF dynamics in terms peak flow rate, mean velocity and Reynolds number (Fig. 7) compare favorably to previous studies. The meas-ured CSF flow rate waveforms (Fig. 6a) had similar mag-nitude as previous studies in the literature by Loth et al. [29], Linninger et al. [69] and Greitz [70, 71]. For those studies, average value of the peak CSF velocity at C2 ver-tebral level was ~ 2.5 cm/s. In the present model, peak CSF velocity at C2 vertebral level was 2.16 cm/s (Fig. 7f, towards feet). CSF pulse wave velocity (PWV), was esti-mated to be 19.4 cm/s in the healthy subject based on feature points of the CSF flow waveform measured along the entire spine (Fig. 6b). This value is lower than those previously reported in the literature that include 4.6 ± 1.7 m/s by Kalata et al. in the cervical spine [31] and ~ 40 m/s by Greitz in a patient [72]. It is difficult to directly compare these results with the present study, as they varied in technique, measurement location and type of subject.
Peak Reynolds number was predicted to be 175 and located within the cervical spine. This value suggests the presence of laminar CSF flow throughout the intrathe-cal space. However, it should be noted that that the SSS is a highly complex geometry that also contains micro-scopic structures called arachnoid trabeculae that were not included in the flow calculations. Previous biofluids studies have shown that geometric complexity can allow flow to become partially turbulent at Re > 600 in a steno-sis [73], at Re 200–350 in aneurysms [74, 75], in the heart [76] and within CSF in the SSS [77, 78]. More research is needed to define the nature of CSF flow dynamics with respect to turbulence.
Cerebrospinal fluid flow data was collected at three dis-tinct axial locations along the spine for a single subject. Data from these three locations was spatial-temporally interpolated (Fig. 6b) and used in combination with the geometry to quantify axial distribution of CSF dynam-ics along the spine (Fig. 7). While only representative of the single subject analyzed, the provided parameters give insight into CSF dynamics for a single healthy sub-ject within a complete SC model containing detailed nerve root geometry. For example, the detailed geometry showed that Reynolds number varies significantly along the spine due to the presence of NR (see Fig. 7d Reynolds number variation in cervical spine). Note: validation of
numerical models using the provided downloadable CSF flow waveform data should only take into account CSF flow rates measured at the three distinct axial locations (Fig. 6a). Interpolated values are not empirical data to be used for validation purposes.
Limitations
The provided anthropomorphic model of intrathecal CSF has several important limitations. Our model included the dorsal and ventral spinal cord NR with semi-idealized geometry that was mirrored across the spinal cord for a healthy subject. For a diseased case, such as in patients with syringomyelia or Chiari malformation, it is expected that the exact NR position may be altered. In the case of syringomyelia, the SSS has been found to narrow near the syrinx [79] and would likely result in local displacement of NR towards the dura. The present model may not be relevant for representing such a diseased case.
We sought to render the NR structures as near as pos-sible to reality based on a combination of referencing the in vivo MR imaging and cadaveric measurements in the literature. However, the resulting model cannot be considered truly subject-specific, as the exact locations and geometry of each NR was not possible to directly visualize. Higher resolution MRI would be required to construct such a model. In addition, several additional anatomic features are missing in the model including: denticulate ligaments and tiny blood vessels that trans-verse the intrathecal CSF spaces. Additional work could be made to add these features to the model in an ideal-ized way.
The provided model only includes CSF within the intrathecal space. This was due to MRI scanning time limitations. The protocol used in the present study required 45 min of scanning time to obtain the necessary high-resolution complete spine imaging. Future studies should quantify the entire CSF space geometry in detail to allow modeling of Chiari malformation and other intracranial central nervous system diseases.
Conclusions
This study provides an anatomically realistic anthropo-morphic 3D model of the complete intrathecal space based on high-resolution MR imaging of a healthy human adult female. The axial distribution of CSF dynamics within the model are quantified in terms of key hydrodynamic and geometric variables and likely indicate laminar CSF flow throughout the SSS. The model (Additional file 1) is provided for re-use under the Creative Commons Attribution-ShareAlike 4.0 International license (CC BY-SA 4.0) and can be used as a tool for development of in vitro and numerical models of CSF dynamics for design and optimization of intrath-ecal drug delivery, CSF filtration, CSF hypothermia and central nervous system diseases of the SC such as syrin-gomyelia and spinal arachnoiditis.
Abbreviations
3D: three-dimensional; ASA: anterior spinal artery; CFD: computational fluid dynamics; CSF: cerebrospinal fluid; DM: dura mater; DA: descending angle; ES: epidural space; FIESTA: fast imaging employing steady-state acquisition; FM: foramen magnum; FOV: field of view; LV: left vertebral artery; MR: magnetic resonance; MRI: magnetic resonance imaging; NR: nerve rootlets; PWV: pulse wave velocity; RL: radicular line; RV: right vertebral artery; SC: spinal cord; SSS: spinal subarachnoid space; TE: echo time; TR: repetition time.
Authors’ contributions
Study conception and design: BAM. Acquisition of data: OB, RST, GCN, LRS, MK. Analysis and interpretation of data: BAM, LRS, RST, OB, MK, GCN. Drafting of manuscript: BAM, LRS. Critical revision: BAM, LRS, RST, OB, MK, GCN. All authors read and approved the final manuscript.
Author details
1 Neurophysiological Imaging and Modeling Laboratory, University of Idaho, 875 Perimeter Dr. MC1122, Moscow, ID 83844-1122, USA. 2 Bioflow Image, Service de Biophysique et de Traitement de l’Image médicale, Bâtiment des écoles, CHU Nord Amiens-Picardie, Place Victor Pauchet, 80054 Amiens Cedex 1, France. 3 Seattle Science Foundation, 200 2nd Ave N, Seattle, WA 98109, USA. 4 Department of Biological Engineering, University of Idaho, 875 Perim-eter Dr. MC0904, Moscow, ID 83844-0904, USA.
Acknowledgements None.
Competing interests
BAM has received research funding from Alcyone Lifesciences Inc., Minnetro-nix Inc. and Voyager Therapeutics.
Consent for publication
All authors have approved the manuscript submission. The content of this manuscript has not been published, or submitted for publication elsewhere.
Ethics approval and consent to participate
MRI data collection for this study was approved by the local institutional review board in Amiens, France and satisfied all local and international
Additional file
Additional file 1. 3D computer aided design files for the spinal cord, dura and nerve roots in .OBJ and .STL file format. Summary of geometric and hydrodynamic results for the spinal cord, dura and nerve roots in .XLSX format.
regulations for human subject research. All data was de-identified before data transfer to the University of Idaho for analysis.
Funding
This work was supported by an Intuitional Development Award (IDeA) from the National Institute of General Medical Sciences (NIGMS) of the National Institutes of health (NIH) under Grant #P20GM1033408 and #4U54GM104944-04TBD, The National Institutes of Mental Health Grant #1R44MH112210-01A1, and University of Idaho Vandal Ideas Project.
Publisher’s Note
Springer Nature remains neutral with regard to jurisdictional claims in pub-lished maps and institutional affiliations.
Received: 30 August 2017 Accepted: 1 December 2017
References
1. Bunck AC, Kroeger JR, Juettner A, Brentrup A, Fiedler B, Crelier GR, Martin BA, Heindel W, Maintz D, Schwindt W, Niederstadt T. Magnetic resonance 4D flow analysis of cerebrospinal fluid dynamics in Chiari I malformation with and without syringomyelia. Eur Radiol. 2012;22:1860–70.
2. Bradley WG Jr, Scalzo D, Queralt J, Nitz WN, Atkinson DJ, Wong P. Normal-pressure hydrocephalus: evaluation with cerebrospinal fluid flow meas-urements at MR imaging. Radiology. 1996;198:523–9.
3. Woodworth GF, McGirt MJ, Williams MA, Rigamonti D. Cerebrospinal fluid drainage and dynamics in the diagnosis of normal pressure hydrocepha-lus. Neurosurgery. 2009;64:919–25 (discussion 925–916).
4. Sklar FH, Beyer CW Jr, Ramanathan M, Cooper PR, Clark WK. Cerebrospinal fluid dynamics in patients with pseudotumor cerebri. Neurosurgery. 1979;5:208–16.
5. Papisov MI, Belov VV, Gannon KS. Physiology of the intrathecal bolus: the leptomeningeal route for macromolecule and particle delivery to CNS. Mol Pharm. 2013;10:1522–32.
6. Abhi V, Minnetronix I. Devices and systems for access and navigation of cerebrospinal fluid space. 2016. Patent US20160051801 A1. https://www. google.com/patents/US20160051801
7. Finsterer J, Mamoli B. Cerebrospinal fluid filtration in amyotrophic lateral sclerosis. Eur J Neurol. 1999;6:597–600.
8. Meylaerts SA, Kalkman CJ, de Haan P, Porsius M, Jacobs MJ. Epidural versus subdural spinal cord cooling: cerebrospinal fluid temperature and pressure changes. Ann Thorac Surg. 2000;70:222–7 (discussion 228). 9. Siyahhan B, Knobloch V, de Zelicourt D, Asgari M, Schmid Daners M,
Poulikakos D, Kurtcuoglu V. Flow induced by ependymal cilia dominates near-wall cerebrospinal fluid dynamics in the lateral ventricles. J R Soc Interface. 2014;11:20131189.
10. Tangen KM, Hsu Y, Zhu DC, Linninger AA. CNS wide simulation of flow resistance and drug transport due to spinal microanatomy. J Biomech. 2015;48:2144–54.
11. Stockman HW. Effect of anatomical fine structure on the flow of cerebrospinal fluid in the spinal subarachnoid space. J Biomech Eng. 2006;128:106–14.
12. Tangen K, Narasimhan NS, Sierzega K, Preden T, Alaraj A, Linninger AA. Clearance of subarachnoid hemorrhage from the cerebrospinal fluid in computational and in vitro models. Ann Biomed Eng. 2016;44:3478–94. 13. Clarke EC, Fletcher DF, Stoodley MA, Bilston LE. Computational fluid
dynamics modelling of cerebrospinal fluid pressure in Chiari malforma-tion and syringomyelia. J Biomech. 2013;46:1801–9.
14. Martin BA, Kalata W, Shaffer N, Fischer P, Luciano M, Loth F. Hydrodynamic and longitudinal impedance analysis of cerebrospinal fluid dynamics at the craniovertebral junction in type I Chiari malformation. PLoS ONE. 2013;8:e75335.
15. Helgeland A, Mardal KA, Haughton V, Reif BA. Numerical simulations of the pulsating flow of cerebrospinal fluid flow in the cervical spinal canal of a Chiari patient. J Biomech. 2014;47:1082–90.
in the spinal subarachnoid space: a modelling study. J Biomech. 2012;45:1186–91.
17. Bertram CD, Bilston LE, Stoodley MA. Tensile radial stress in the spinal cord related to arachnoiditis or tethering: a numerical model. Med Biol Eng Comput. 2008;46:701–7.
18. Elliott NSJ, Bertram CD, Martin BA, Brodbelt AR. Syringomyelia: a review of the biomechanics. J Fluids Struct. 2013;40:1–24.
19. Baledent O, Henry-Feugeas MC, Idy-Peretti I. Cerebrospinal fluid dynamics and relation with blood flow: a magnetic resonance study with semiauto-mated cerebrospinal fluid segmentation. Investig Radiol. 2001;36:368–77. 20. Martin BA, Kalata W, Loth F, Royston TJ, Oshinski JN. Syringomyelia hydro-dynamics: an in vitro study based on in vivo measurements. J Biomech Eng Trans Asme. 2005;127:1110–20.
21. Khani M, Xing T, Gibbs C, Oshinski JN, Stewart GR, Zeller JR, Martin BA. Nonuniform moving boundary method for computational fluid dynamics simulation of intrathecal cerebrospinal flow distribution in a Cynomolgus Monkey. J Biomech Eng. 2017;139:081005.
22. Yiallourou T, Schmid Daners M, Kurtcuoglu V, Haba-Rubio J, Heinzer R, Fornari E, Santini F, Sheffer DB, Stergiopulos N, Martin BA. Continuous positive airway pressure alters cranial blood flow and cerebrospinal fluid dynamics at the craniovertebral junction. Interdiscip Neurosurg Adv Tech Case Manag. 2015;2:152–9.
23. Yushkevich PA, Piven J, Hazlett HC, Smith RG, Ho S, Gee JC, Gerig G. User-guided 3D active contour segmentation of anatomical structures: signifi-cantly improved efficiency and reliability. Neuroimage. 2006;31:1116–28. 24. Martin BA, Yiallourou TI, Pahlavian SH, Thyagaraj S, Bunck AC, Loth F, Shef-fer DB, Kroger JR, Stergiopulos N. Inter-operator reliability of magnetic resonance image-based computational fluid dynamics prediction of cerebrospinal fluid motion in the cervical spine. Ann Biomed Eng. 2016;44:1524–37.
25. Bozkurt M, Canbay S, Neves GF, Akture E, Fidan E, Salamat MS, Baskaya MK. Microsurgical anatomy of the dorsal thoracic rootlets and dorsal root entry zones. Acta Neurochir. 2012;154:1235–9.
26. Zhou MW, Wang WT, Huang HS, Zhu GY, Chen YP, Zhou CM. Microsurgical anatomy of lumbosacral nerve rootlets for highly selective rhizotomy in chronic spinal cord injury. Anat Rec. 2010;293:2123–8.
27. Hauck EF, Wittkowski W, Bothe HW. Intradural microanatomy of the nerve roots S1–S5 at their origin from the conus medullaris. J Neurosurg Spine. 2008;9:207–12.
28. Lang J, Bartram CT. Fila radicularia of the ventral and dorsal radices of the human spinal cord. Gegenbaurs Morphol Jahrb. 1982;128:417–62. 29. Loth F, Yardimci MA, Alperin N. Hydrodynamic modeling of cerebrospinal
fluid motion within the spinal cavity. J Biomech Eng. 2001;123:71–9. 30. San O, Staples AE. An improved model for reduced-order physiological
fluid flows. J Mech Med Biol. 2012;12:1250052.
31. Kalata W, Martin BA, Oshinski JN, Jerosch-Herold M, Royston TJ, Loth F. MR measurement of cerebrospinal fluid velocity wave speed in the spinal canal. IEEE Trans Biomed Eng. 2009;56:1765–8.
32. Martin BA, Reymond P, Novy J, Baledent O, Stergiopulos N. A coupled hydrodynamic model of the cardiovascular and cerebrospinal fluid system. Am J Physiol Heart Circ Physiol. 2012;302:H1492–509.
33. De Leener B, Taso M, Cohen-Adad J, Callot V. Segmentation of the human spinal cord. MAGMA. 2016;29:125–53.
34. Seidel E, Eicke BM, Tettenborn B, Krummenauer F. Reference values for vertebral artery flow volume by duplex sonography in young and elderly adults. Stroke. 1999;30:2692–6.
35. Biglioli P, Roberto M, Cannata A, Parolari A, Fumero A, Grillo F, Maggioni M, Coggi G, Spirito R. Upper and lower spinal cord blood supply: the continuity of the anterior spinal artery and the relevance of the lumbar arteries. J Thorac Cardiovasc Surg. 2004;127:1188–92.
36. Pahlavian SH, Yiallourou T, Tubbs RS, Bunck AC, Loth F, Goodin M, Raisee M, Martin BA. The impact of spinal cord nerve roots and denticulate liga-ments on cerebrospinal fluid dynamics in the cervical spine. PLoS ONE. 2014;9:e91888.
37. Thyagaraj S, Pahlavian SH, Sass LR, Loth F, Vatani M, Choi JW, Tubbs RS, Giese D, Kroger JR, Bunck AC, Martin BA. An MRI-compatible hydrody-namic simulator of cerebrospinal fluid motion in the cervical spine. IEEE Trans Biomed Eng. 2017. 10.1109/TBME.2017.2756995
38. Hogan QH, Prost R, Kulier A, Taylor ML, Liu S, Mark L. Magnetic resonance imaging of cerebrospinal fluid volume and the influence of body habitus and abdominal pressure. Anesthesiology. 1996;84:1341–9.
39. Edsbagge M, Starck G, Zetterberg H, Ziegelitz D, Wikkelso C. Spinal cerebrospinal fluid volume in healthy elderly individuals. Clin Anat. 2011;24:733–40.
40. Hsu Y, Hettiarachchi HD, Zhu DC, Linninger AA. The frequency and magnitude of cerebrospinal fluid pulsations influence intrathecal drug distribution: key factors for interpatient variability. Anesth Analg. 2012;115:386–94.
41. Alperin N, Bagci AM, Lee SH, Lam BL. Automated quantitation of spinal CSF volume and measurement of craniospinal CSF redistribution follow-ing lumbar withdrawal in idiopathic intracranial hypertension. AJNR Am J Neuroradiol. 2016;37:1957–63.
42. Levi Chazen J, Dyke JP, Holt RW, Horky L, Pauplis RA, Hesterman JY, David Mozley P, Verma A. Automated segmentation of MR imaging to deter-mine normative central nervous system cerebrospinal fluid volumes in healthy volunteers. Clin Imaging. 2017;43:132–5.
43. Bagci AM, Ranganathan S, Gomez JR, Lam BL, Alperin N. Automated quantitation of CSF volumes in central nervous system by MRI. In: Proceedings of the International Society for Magnetic Resonance in Medicine. 2012.
44. Lebret A, Hodel J, Rahmouni A, Decq P, Petit E. Cerebrospinal fluid volume analysis for hydrocephalus diagnosis and clinical research. Comput Med Imaging Graph. 2013;37:224–33.
45. Sullivan JT, Grouper S, Walker MT, Parrish TB, McCarthy RJ, Wong CA. Lum-bosacral cerebrospinal fluid volume in humans using three-dimensional magnetic resonance imaging. Anesth Analg. 2006;103:1306–10. 46. Martyr JW, Song SJ, Hua J, Burrows S. The correlation between cauda
equina nerve root volume and sensory block height after spinal anaes-thesia with glucose-free bupivacaine. Anaesanaes-thesia. 2011;66:590–4. 47. Carpenter RL, Hogan QH, Liu SS, Crane B, Moore J. Lumbosacral
cerebrospinal fluid volume is the primary determinant of sensory block extent and duration during spinal anesthesia. Anesthesiology. 1998;89:24–9.
48. Higuchi H, Hirata J, Adachi Y, Kazama T. Influence of lumbosacral cerebro-spinal fluid density, velocity, and volume on extent and duration of plain bupivacaine spinal anesthesia. Anesthesiology. 2004;100:106–14. 49. Puigdellivol-Sanchez A, Prats-Galino A, Reina MA, Maches F, Hernandez
JM, De Andres J, van Zundert A. Three-dimensional magnetic resonance image of structures enclosed in the spinal canal relevant to anesthetists and estimation of the lumbosacral CSF volume. Acta Anaesthesiol Belg. 2011;62:37–45.
50. Prats-Galino A, Reina MA, Puigdellivol-Sanchez A, Juanes Mendez JA, De Andres JA, Collier CB. Cerebrospinal fluid volume and nerve root vulner-ability during lumbar puncture or spinal anaesthesia at different vertebral levels. Anaesth Intensiv Care. 2012;40:643–7.
51. Guyton AC, Hall JE. Textbook of medical physiology. 9th ed. Philadelphia: W.B. Saunders; 1996.
52. Davson H, Segal MB. Physiology of the CSF and blood-brain barriers. Boca Raton: CRC Press; 1996.
53. Johanson CE, Duncan JA 3rd, Klinge PM, Brinker T, Stopa EG, Silverberg GD. Multiplicity of cerebrospinal fluid functions: new challenges in health and disease. Cerebrospinal Fluid Res. 2008;5:10.
54. Sakka L, Coll G, Chazal J. Anatomy and physiology of cerebrospinal fluid. Eur Ann Otorhinolaryngol Head Neck Dis. 2011;128:309–16.
55. Last RJ, Tompsett DH. Casts of the cerebral ventricles. Br J Surg. 1953;40:525–43.
56. Wyper DJ, Pickard JD, Matheson M. Accuracy of ventricular volume estimation. J Neurol Neurosurg Psychiatry. 1979;42:345–50.
57. Grant R, Condon B, Lawrence A, Hadley DM, Patterson J, Bone I, Teasdale GM. Human cranial CSF volumes measured by MRI: sex and age influ-ences. Magn Reson Imaging. 1987;5:465–8.
58. Hodel J, Lebret A, Petit E, Leclerc X, Zins M, Vignaud A, Decq P, Rahmouni A. Imaging of the entire cerebrospinal fluid volume with a multistation 3D SPACE MR sequence: feasibility study in patients with hydrocephalus. Eur Radiol. 2013;23:1450–8.
59. Courchesne E, Chisum HJ, Townsend J, Cowles A, Covington J, Egaas B, Harwood M, Hinds S, Press GA. Normal brain development and aging: quantitative analysis at in vivo MR imaging in healthy volunteers. Radiol-ogy. 2000;216:672–82.
• We accept pre-submission inquiries
• Our selector tool helps you to find the most relevant journal
• We provide round the clock customer support
• Convenient online submission
• Thorough peer review
• Inclusion in PubMed and all major indexing services
• Maximum visibility for your research
Submit your manuscript at www.biomedcentral.com/submit
Submit your next manuscript to BioMed Central
and we will help you at every step:
61. Pfefferbaum A, Mathalon DH, Sullivan EV, Rawles JM, Zipursky RB, Lim KO. A quantitative magnetic resonance imaging study of changes in brain morphology from infancy to late adulthood. Arch Neurol. 1994;51:874–87.
62. Lockey P, Poots G, Williams B. Theoretical aspects of the attenuation of pressure pulses within cerebrospinal-fluid pathways. Med Biol Eng. 1975;13:861–9.
63. Berkouk K, Carpenter PW, Lucey AD. Pressure wave propagation in fluid-filled co-axial elastic tubes. Part 1: basic theory. J Biomech Eng. 2003;125:852–6.
64. Hettiarachchi HD, Hsu Y, Harris TJ Jr, Penn R, Linninger AA. The effect of pulsatile flow on intrathecal drug delivery in the spinal canal. Ann Biomed Eng. 2011;39:2592–602.
65. Elliott NS. Syrinx fluid transport: modeling pressure-wave-induced flux across the spinal pial membrane. J Biomech Eng. 2012;134:031006. 66. Stockman HW. Effect of anatomical fine structure on the
disper-sion of solutes in the spinal subarachnoid space. J Biomech Eng. 2007;129:666–75.
67. Kuttler A, Dimke T, Kern S, Helmlinger G, Stanski D, Finelli LA. Understand-ing pharmacokinetics usUnderstand-ing realistic computational models of fluid dynamics: biosimulation of drug distribution within the CSF space for intrathecal drugs. J Pharmacokinet Pharmacodyn. 2010;37:629–44. 68. Yiallourou TI, Kroger JR, Stergiopulos N, Maintz D, Martin BA, Bunck AC.
Comparison of 4D phase-contrast MRI flow measurements to compu-tational fluid dynamics simulations of cerebrospinal fluid motion in the cervical spine. PLoS ONE. 2012;7:e52284.
69. Linninger AA, Tsakiris C, Zhu DC, Xenos M, Roycewicz P, Danziger Z, Penn R. Pulsatile cerebrospinal fluid dynamics in the human brain. IEEE Trans Biomed Eng. 2005;52:557–65.
70. Greitz D. Cerebrospinal fluid circulation and associated intracranial dynamics. A radiologic investigation using MR imaging and radionuclide cisternography. Acta Radiol Suppl. 1993;386:1–23.
71. Greitz D, Franck A, Nordell B. On the pulsatile nature of intracranial and spinal CSF-circulation demonstrated by MR imaging. Acta Radiol. 1993;34:321–8.
72. Greitz D, Ericson K, Flodmark O. Pathogenesis and mechanics of spinal cord cysts—a new hypothesis based on magnetic resonance studies of cerebrospinal fluid dynamics. Int J Neuroradiol. 1999;5:61–78. 73. Ahmed SA, Giddens DP. Pulsatile poststenotic flow studies with laser
Doppler anemometry. J Biomech. 1984;17:695–705.
74. Valen-Sendstad K, Steinman DA. Mind the gap: impact of computational fluid dynamics solution strategy on prediction of intracranial aneurysm hemodynamics and rupture status indicators. AJNR Am J Neuroradiol. 2014;35:536–43.
75. Valen-Sendstad K, Mardal KA, Mortensen M, Reif BAP, Langtangen HP. Direct numerical simulation of transitional flow in a patient-specific intracranial aneurysm. J Biomech. 2011;44:2826–32.
76. Tagliabue A, Dede L, Quarteroni A. Complex blood flow patterns in an idealized left ventricle: a numerical study. Chaos. 2017;27:093939. 77. Jain K, Universität Siegen. universi-Universitätsverlag Siegen. Transition to
turbulence in physiological flows: direct numerical simulation of hemo-dynamics in intracranial aneurysms and cerebrospinal fluid hydrodynam-ics in the spinal canal. 1st ed. Siegen: universi-Universitätsverlag Siegen; 2016.
78. Jain K, Ringstad G, Eide PK, Mardal KA. Direct numerical simulation of transitional hydrodynamics of the cerebrospinal fluid in Chiari I malfor-mation: the role of cranio-vertebral junction. Int J Numer Method Biomed Eng. 2017;33.
79. Thompson A, Madan N, Hesselink JR, Weinstein G, del Rio AM, Haughton V. The cervical spinal canal tapers differently in patients with Chiari I with and without syringomyelia. AJNR Am J Neuroradiol. 2016;37:755–8. 80. Chen L, Beckett A, Verma A, Feinberg DA. Dynamics of respiratory and
cardiac CSF motion revealed with real-time simultaneous multi-slice EPI velocity phase contrast imaging. Neuroimage. 2015;122:281–7. 81. Takizawa K, Matsumae M, Sunohara S, Yatsushiro S, Kuroda K.
Charac-terization of cardiac- and respiratory-driven cerebrospinal fluid motion based on asynchronous phase-contrast magnetic resonance imaging in volunteers. Fluids Barriers CNS. 2017;14:25.
82. Yatsushiro S, Sunohara S, Takizawa K, Matsumae M, Kajihara N, Kuroda K. Characterization of cardiac- and respiratory-driven cerebrospinal fluid motions using correlation mapping with asynchronous 2-dimensional phase contrast technique. In: Engineering in Medicine and Biology Society (EMBC), 2016 IEEE 38th Annual International Conference. 2016. p. 3867–70.
83. Yildiz S, Thyagaraj S, Jin N, Zhong X, Heidari Pahlavian S, Martin BA, Loth F, Oshinski J, Sabra KG. Quantifying the influence of respiration and cardiac pulsations on cerebrospinal fluid dynamics using real-time phase-con-trast MRI. J Magn Reson Imaging. 2017;46:431–9.
84. Penrod KE. A stereoscopic atlas of human anatomy-Bassett DL. J Med Educ. 1959;34:75.
85. File:Slide5rer.JPG-Wikimedia Commons. https://commons.wikimedia.org/ wiki/File:Slide5rer.JPG.
86. Filum terminale-Wikipedia. 2017. https://en.m.wikipedia.org/wiki/Filum_ terminale. Accessed 1 June 2017.


![Fig. 4 Complete spinal geometry showing detail in the cervical (green), thoracic (blue), lumbar (violet), and sacral (red) regions compared to anatomic imagery of respective locations [84–86]](https://thumb-us.123doks.com/thumbv2/123dok_us/216545.1515107/6.595.54.293.82.588/complete-geometry-cervical-thoracic-compared-anatomic-respective-locations.webp)