R E S E A R C H
Open Access
Simulation and qualitative analysis of
glucose variability, mean glucose, and
hypoglycemia after subcutaneous insulin
therapy for stress hyperglycemia
Richard J. Strilka
1*, Mamie C. Stull
1, Michael S. Clemens
1, Stewart C. McCaver
2and Scott B. Armen
3*Correspondence: [email protected] 1Department of Trauma and Critical Care Surgery, San Antonio Military Medical Center, 3551 Roger Brooke Drive, Fort Sam Houston, San Antonio, TX, USA
Full list of author information is available at the end of the article
Abstract
Background: The critically ill can have persistent dysglycemia during the “subacute” recovery phase of their illness because of altered gene expression; it is also not uncommon for these patients to receive continuous enteral nutrition during this time. The optimal short-acting subcutaneous insulin therapy that should be used in this clinical scenario, however, is unknown. Our aim was to conduct a qualitative numerical study of the glucose-insulin dynamics within this patient population to answer the above question. This analysis may help clinicians design a relevant clinical trial. Methods: Eight virtual patients with stress hyperglycemia were simulated by means of a mathematical model. Each virtual patient had a different combination of insulin resistance and insulin deficiency that defined their unique stress hyperglycemia state; the rate of gluconeogenesis was also doubled. The patients received 25 injections of subcutaneous regular or Lispro insulin (0-6 U) with 3 rates of continuous nutrition. The main outcome measurements were the change in mean glucose concentration, the change in glucose variability, and hypoglycemic episodes. These end points were interpreted by how the ultradian oscillations of glucose concentration were affected by each insulin preparation.
Results: Subcutaneous regular insulin lowered both mean glucose concentrations and glucose variability in a linear fashion. No hypoglycemic episodes were noted. Although subcutaneous Lispro insulin lowered mean glucose concentrations, glucose variability increased in a nonlinear fashion. In patients with high insulin resistance and nutrition at goal,“rebound hyperglycemia”was noted after the insulin analog was rapidly metabolized. When the nutritional source was removed, hypoglycemia tended to occur at higher Lispro insulin doses. Finally, patients with severe insulin resistance seemed the most sensitive to insulin concentration changes.
Conclusions: Subcutaneous regular insulin consistently lowered mean glucose concentrations and glucose variability; its linear dose-response curve rendered the preparation better suited for a sliding-scale protocol. The longer duration of action of subcutaneous regular insulin resulted in better glycemic-control metrics for patients who were continuously postprandial. Clinical trials are needed to examine whether
(Continued on next page)
(Continued from previous page)
these numerical results represent the glucose-insulin dynamics that occur in intensive care units; if present, their clinical effects should be evaluated.
Keywords: Stress hyperglycemia, Subcutaneous insulin, Glucose variability, Mean glucose, Hypoglycemia, Computer simulation
Background
Stress hyperglycemia (SH) of critical illness is a multifaceted disease that involves elevated hepatic gluconeogenesis [1–3], increased insulin resistance (IR) [4–9], and insulin defi-ciency (ID) [5, 10]. These factors are dynamic and evolve during critical illness. In com-bination, they produce a heterogeneous disorder marked by hyperglycemia that affects 30–50 % of intensive-care patients although some may have occult diabetes [11–13]. Optimal SH therapy would minimize glucose variability (GV) [14–16], prevent hyper-glycemia [17, 18], and not cause hypohyper-glycemia [19, 20] because all three factors have a similar mortality risk [21].
Literature review suggests that patients with SH have variable responses to the same insulin treatment [16]. Disease heterogeneity may partially explain why only certain sub-groups, such as trauma patients, seem to benefit from tight glycemic control (TGC) [22, 23]. In general, TGC studies have been plagued by frequent hypoglycemia [22, 24] and worsened mortality [25]. One current treatment recommendation for SH is to begin therapy with an insulin infusion when glucose concentrations exceed 150 mg/dL, with an absolute goal of less than 180 mg/dL [16]. As the patient recovers, the insulin infu-sion is changed to a subcutaneous (SQ) insulin sliding scale after vasopressors have been removed, peripheral edema has resolved, and no further nutrition interruptions have been planned. Nevertheless, SH may persist for weeks because of altered gene expression that results in long-term changes in glucose metabolism [26]. Therefore, an improved understanding of SQ insulin therapies may benefit critically ill patients in the subacute phase of their illness. Although SQ insulin therapy has been successfully used in criti-cal care [27, 28], the optimal short-acting insulin preparation is unknown; moreover,GV
after SQ insulin therapy has not been examined.
SQ Lispro insulin improves mean glucose concentration (MGC) in diabetes while minimizing postprandial hypoglycemia [29, 30]. When an otherwise healthy diabetic patient eats a meal, endogenous insulin concentrations spike and follow a narrow “bell shape” curve [31]. Clinical [32] and computational studies [33] confirm that SQ Lispro insulin tends to outperform SQ regular insulin in this patient population because of the shorter duration of action that more closely mimics the body’s response to a food bolus. On the other hand, patients with SH who are receiving continuous nutrition may have a very different response to short-acting insulin preparations, given that they are continually postprandial. Assuming stable values for IR, ID, gluconeogenesis and the continuous nutrition rate, their hyperglycemia would result from a uniformly amplified glucose ultradian oscillation.
critically ill patients with SH to identify the optimal short-acting SQ insulin therapy that should be used in this clinical scenario. In addition, the effects of SH disease hetero-geneity on the patients’ response to different short-acting SQ insulin therapies were also examined.
Methods
In the last decades, several mathematical models have been proposed and studied with the aim of better understanding the dynamics of the glucose-insulin axis, so that safer and more effective insulin administration practices could be developed to treat diabetes mellitus [33–39]. This work has meet with success and has culminated in a recent clinical trial of an artificial pancreas [40]. These analytical methods can be modified to model the effects of SQ insulin when used against SH in the Intensive Care Unit [41]. The analysis will be qualitative because the model used has not been validated against human data gathered from the critically ill; however, closely related models have reproduced results from clinical trials involving diabetes and SQ insulin therapies [33, 42].
The glucose-insulin system in functional form
The model used in this study [38, 41] applies delay differential equations to incorporate the time delays required to simulate the finite response time of the pancreas and liver to secrete insulin and glucose, respectively. The delay differential equations were derived from the principle of mass conservation for both the glucose concentration,G(t), and the insulin concentration,I(t), for any time t. The principle states that the rate of change in
G(t)must equal the glucose production,Gp(t), minus glucose utilization,Gu(t). Similarly,
the rate of change ofI(t)must equal the insulin production,Ip(t), minus insulin clearance,
Ic(t). In equation format, this principle reads as follows:
dG(t)
dt =Gp(t)−Gu(t), (2.1a) dI(t)
dt =Ip(t)−Ic(t), (2.1b)
where
Gp(t)=Gin(t)+×f5(I(t−τ2))×f6(G(t)), (2.2a)
Gu(t)=f2(G(t))+β×f3(G(t))×f4(I(t))+f7(G(t)−330), (2.2b)
Ip(t)=Iin(t)+α×f1(G(t−τ1)), (2.2c)
Ic(t)=diI(t), (2.2d)
and dtd is the derivative with respect to time. The functions f1 through f7 are highly
nonlinear and describe different characteristics of the glucose-insulin axis; their explicit forms are presented below. They describe the body’s glucose production and utilization as well as insulin production and clearance. Note thatGin(t)in Eq. (2.2a) denotes
glu-cose absorption from either enteral nutrition or an intravenous source. Insulin absorption from an exogenous source is represented byIin(t)in Eq. (2.2c); this function will be used
to represent the different SQ insulin therapies. The purpose of each of thefifunctions is
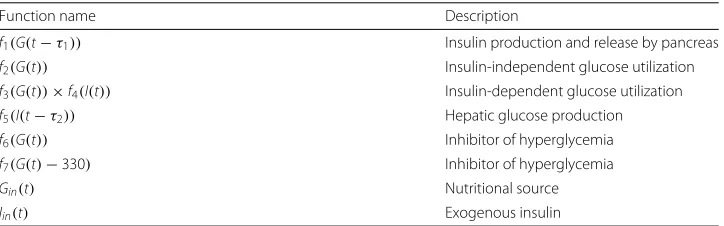
Table 1Descriptions of the functionsf1throughf7,Gin(t)andIin(t)
Function name Description
f1(G(t−τ1)) Insulin production and release by pancreas
f2(G(t)) Insulin-independent glucose utilization f3(G(t))×f4(I(t)) Insulin-dependent glucose utilization f5(I(t−τ2)) Hepatic glucose production f6(G(t)) Inhibitor of hyperglycemia
f7(G(t)−330) Inhibitor of hyperglycemia
Gin(t) Nutritional source
Iin(t) Exogenous insulin
physiological experiments may be found in [34]. Equation (2.1) were solved as described previously [41].
Model parameters and what they represent
The model incorporates 6 adjustable parameters:τ1,τ2,di,α,β, and, which have been
boldfaced in Eq. (2.2) for easy identification; their value determines the specific patho-physiology of the patient being simulated. Each parameter affects only a portion of the glucose-insulin axis; this principle is summarized in Table 2. A detailed description of each model parameter follows next.
The model was validated for normal physiology and diabetes (that is, for normal rates of gluconeogenesis or = 1 in Eq. (2.2a)) by showing that detailed glucose measure-ments from several healthy subjects and patients with type 1 or type 2 diabetes can be reproduced when the parameter values are appropriately chosen [38]. The model cor-rectly captures the effects of insulin therapy and a nutritional source. The reverse process was also found to be valid because an unknown patient’s corresponding parameter values can be used to correctly diagnose the patient’s underlying pathophysiology [38].
Type 1 diabetes was mainly captured by decreasing the term that describes insulin secretion by a constant,α, in Eq. (2.2c). Similarly, type 2 diabetes was primarily modeled by decreasing the term that describes insulin-dependent glucose utilization by another constant,β, in Eq. (2.2b). Whenαandβare appropriately chosen and less than one, the virtual patient will either secrete a suboptimal amount of insulin or demonstrateIR.
SH in critical illness is the result of at least 4 factors: increased gluconeogenesis [1–3], increased IR [4–9], ID from decreased pancreatic insulin secretion (IDp) [10],
andIDfrom increased insulin clearance (IC) [5, 10]. Each factor was incorporated into our model. For example, an increase in the hepatic glucose production term by a con-stant(whereis greater than unity, Eq. (2.2a)) increases gluconeogenesis [41]. It was assumed that the shape off5 (the function that represents gluconeogenesis) does not
Table 2A summary of the 6 parameters of the model and their purpose
Parameter name Description
τ1 Time delay, endogenous insulin secretion
τ2 Time delay, endogenous glucose secretion
β Amplitude, insulin-dependent glucose utilization α Amplitude, endogenous insulin production
Amplitude, gluconeogenesis
change with elevated rates of gluconeogenesis because it has been shown that the shapes of the fi functions are more important than their exact functional form in
reproduc-ing the correct glucose-insulin dynamics [43]: a reasonable assumption for a qualitative study.
Insulin resistance in SH was modeled by decreasing the rate of insulin-dependent glu-cose utilization, as with type 2 diabetes by settingβ <1. Reduced insulin secretion in SH was also simulated in the same fashion as with type 1 diabetes by fixingα < 1. Finally, critical illness has been shown to increaseICby 50–70 % in human studies [5, 10]. Exper-iments have demonstrated that the process of insulin degradation is proportional to its concentration, and this proportionality constant isdiin Eq. (2.2d) [44]. Thus, increasing
diby 50 % increases theIC, which we defined asIC50.
It is the time delays that allow the model to reproduce the naturally occurring glucose-insulin ultradian oscillations [35, 36]. They describe the time required for the body to produce and secrete insulin,τ1inf1(G(t−τ1)), as well as to produce and secrete glucose,
τ2inf5(I(t−τ2)).
How the model parameter values were chosen
The amount ofIR,IDpand increasedICthat occurs in SH varies among patients and is
not well defined. To proceed, we have slightly modified the validatedα,β anddivalues
that were found to represent normal physiology (seesim1 in [38]) to define low normal pancreatic insulin secretion (mildIDp), mildIRand high normal IC, respectively. Next, we
decreased the modifiedαandβvalues by 25 % to represent severeIRand severeIDp. This
defined the pancreatic dysfunction and the decreased insulin-dependent glucose utiliza-tion severity in our virtual patients. For reference, the validatedαandβ values required to accurately model type 1 and type 2 diabetes are an additional 20 % smaller than the parameter values used to represent severeIDpand severeIR[38]. Thus, we assumed that
the level of pathology being simulated was reasonable in that the glucose dynamics pro-duced wound not be abnormally divergent from clinically familiar pathology. Finally, we used the experimentally determined observation on humans thatICmay be increased by 50–70 % in critical illness [10] to justify increasing the high normaldivalue by 50 % (called
IC50). A summary of the model parameters with their associated descriptors is found in
Table 3. We have limited the data analysis to include only qualitative trends in the measur-able quantities: the change-in-MGCand the change-in-GV versus the dose of SQ insulin injected, as well as hypoglycemic episodes.
For the time delays, normal values were used [38]; however, they were chosen so that all of the 8 virtual patients simulated had a maximum glucose value between 150 and 170 mg/dL [41]. This approach facilitated interpatient comparison of the change-in-MGCand change-in-GV.
Modeling SQ insulin
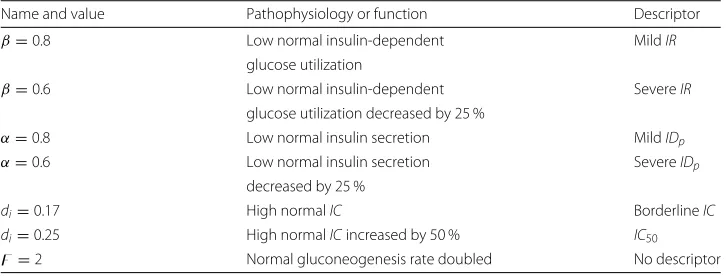
Table 3Summary of model parameter values, description of the resultant pathophysiology, with associated descriptor
Name and value Pathophysiology or function Descriptor β=0.8 Low normal insulin-dependent MildIR
glucose utilization
β=0.6 Low normal insulin-dependent SevereIR
glucose utilization decreased by 25 %
α=0.8 Low normal insulin secretion MildIDp α=0.6 Low normal insulin secretion SevereIDp
decreased by 25 %
di=0.17 High normalIC BorderlineIC
di=0.25 High normalICincreased by 50 % IC50 =2 Normal gluconeogenesis rate doubled No descriptor
SQ insulin injections, Iin(t) in Eq. (2.2c), were modeled with simple, linear
piece-wise functions [33, 41]. For example, 5 min after a SQ injection of Lispro insulin, the absorption was assumed to linearly increase to a maximum value during the first 30 min, followed by a linear decrease to nearly zero by minute 120; this was followed by a small residual tail for the remaining 120 mins. The main form of this function is a triangle with an area that represents the total number of SQ Lispro insulin units injected. The explicit functional forms that represent the SQ insulin injections are shown next.
The SQ Lispro insulin injections were modeled with [33, 41]:
ILis(t)= ⎧ ⎪ ⎪ ⎪ ⎪ ⎨ ⎪ ⎪ ⎪ ⎪ ⎩
0.25 for 0≤t≤5, 0.25+
1+30t−−305
for 5≤t<30, 0.25+1−120t−−3030 for 30≤t<120,
0.25 for 120≤t≤240.
(2.3)
Similarly, for the SQ regular insulin injections, the following function was used [33, 41]:
IReg(t)= ⎧ ⎪ ⎪ ⎪ ⎨ ⎪ ⎪ ⎪ ⎩
0.25 for 0≤t≤30, 0.25+1+ t−90120 for 30≤t<120, 0.25+1−0.5× t−120120 for 120≤t<240, 0.25+0.5×1− t−240240 for 240≤t≤480.
(2.4)
In both functions,trepresents time; the time of injection ist=0.
Measuring the change-in-GV and change-in-MGC
MGCwas calculated as the sum of glucose concentrations that occur each second after the beginning of the simulations (t= 0) divided by the total number of glucose concen-trations used in the sum; the time over which the calculation is performed was 750 mins (the duration of each simulation).
GV does not have a standard definition [46]; this reflects the lack of solid knowledge on what exactly in abnormal glucose-insulin dynamics causes an increase in adverse out-comes that has been associated with increasedGV in literature. In several retrospective studies, different indices have been proposed; for example, glucose variability index [47], standard deviation [15, 48], glycemic lability index [49] and mean amplitude of glucose excursions [50]. It has to be mentioned that blood glucose values are seldom normally distributed, a mathematical condition for use of standard deviation [51]. In literature, this limitation is mostly ignored. In a systemic review of GV, and its effect on mor-tality, each study reviewed found at least one measure ofGV that was associated with mortality [52].
A definition of GV well suited for this study is the mean absolute glucose change [53, 54]. This is the simple summation of all absolute changes in glucose concentrations, divided by the time over which measurements were taken. In this way, two excur-sions of identical extent, but differing in duration, contribute differently to the overall sum of variability. The downside of such a measure in clinical practice is that noise, a particular problem in continuous glucose concentration monitoring, is hard to sep-arate from the signal [55]. Concerning the data gathered from computer models of glucose-insulin dynamics two observations are relevant: (1) there is no noise within the data generated by simulation and (2) the time over which glucose measurements are made can be constructed to be identical. In such a scenario, time may be sup-pressed in the mean absolute glucose change calculation, as it is the same for eachGV
measurement.
We thus have chosen to define GV as the average distance between adjacent local maximum and local minimum values in a patient’sG(t)data (i.e. mean absolute glucose change); the time over which the calculation is performed was again 750 mins. Because allGV measurements occurred over exactly the same relatively short time interval, the change-in-GVswere not normalized by the time over which the data was gathered. Finally, the local maximum/minimum values in theG(t)data were designated as peaks/troughs.
Modeling continuous nutrition
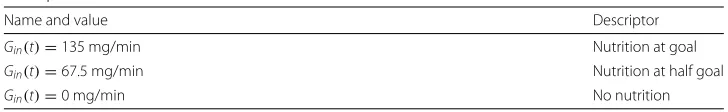
The 3 rates of continuous nutrition,Gin(t)in Eq. (2.2a), were 135 mg/min (nutrition at
goal), 67.5 mg/min (nutrition at half goal), and 0 mg/min (no nutrition); see Table 4 for a summary. For example,G(t)= 135 mg/min is equivalent to 82.2 mL/h of Glucerna®1.2 Cal, which would provide 2367 calories and 194 g of net carbohydrates in 24 h.
Table 4A summary of the different rates of continuous nutrition studied with an associated descriptor
Name and value Descriptor
Gin(t)=135 mg/min Nutrition at goal Gin(t)=67.5 mg/min Nutrition at half goal
Explicit forms of the glucose-insulin metabolic functions
For completeness, the explicit forms of thefifunctions are presented:
f1(G(t−τ1))= Rc
1+exp((c1−(G(t−τ1)/Vg))(1/e1))
, (2.5a)
f2(G(t))= Ub×[ 1−exp(−(G(t)/c2Vg)] , (2.5b)
f3(G(t))= G(t) c3Vg
, (2.5c)
f4(I(t))= Uo+
Uc−Uo
1+exp(−κlog((I(t)/c4)(1/Vc)+(1/Etc)))
, (2.5d)
f5(I(t−τ2))= Rg
1+exp(e1((I(t−τ2)/Vp)−c5))
, (2.5e)
f6(G(t))= 1
exp(γ ((G(t)/c3Vg)−c6))
, (2.5f)
f7(G(t)−330)= Sb+
Sc−Sb
1+exp(δ(((G(t)−330)/c3Vg)−c7))
. (2.5g) The associated constant values within each function are derived from human physio-logical data [34] and have been presented in tabulated form [38, 41].
Results
The results are grouped in subsections by insulin therapy, patient pathophysiology, and the rate of the nutritional source. In general, graphs depicting the change-in-MGCshow a decrease inMGCwhen a data point is below they= 0 line and an increase when the data point is abovey= 0. The same is true for the change-in-GV graphs. Note that all insulin injections were timed to be given at a glucose concentration peak.
SQ Lispro insulin, the 4 borderlineICpatients, and nutrition at goal
This subsection contains the change-in-GV and change-in-MGCdata for the 4 patients with borderlineIC. All patients received nutrition at goal, and SQ Lispro insulin was used to treat their hyperglycemia.
SQ Lispro insulin injections were noted to lowerGV when the insulin dose was less than 4 U (Fig. 1a). In the 2 patients with mildIR,GV remained relatively unaffected by the dose because the change-in-GV curves were nearly flat and neary = 0. For the 2 patients with severeIR, however, theGVincreased when the doses were greater than 4 U. Insulin resistance also affected the shape of the change-in-MGCcurves (Fig. 1b). Patients
with mildIRhad a change-in-MGCcurve that decreased linearly as the SQ Lispro insulin dose increased, which was an intuitive result. Nevertheless, patients with severeIRhad
MGCs that were not significantly decreased as the dose of SQ Lispro insulin was increased beyond 4 U. This result implies thatIRsignificantly affected the response of the glucose-insulin axis to an SQ ultrashort glucose-insulin analog. In comparison, changingIDpfrom mild to
severe did not significantly alter the effect of SQ Lispro insulin on eitherMGCorGV. To interpret the change-in-MGCand change-in-GV graphs in terms of the underly-ing glucose concentration dynamics, the detailedG(t)data were examined for 2 selected patients: 1 with mildIRand another with severeIR. Both patients had mildIDp, and 5 U of
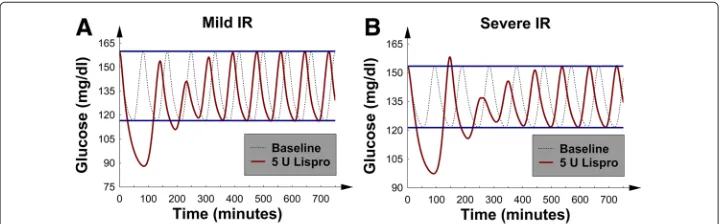
SQ Lispro insulin was injected at a glucose concentration peak at timet=0. For syntax, the first peak and first trough occurred just after the insulin injection, and this conven-tion is used below. The corresponding baselineG(t)data (no insulin injected) were also plotted for comparison. For the patient with mildIR(Fig. 2a), the firstG(t)trough was significantly less than the baseline trough. Additionally, the first and second peaks were significantly decreased. These factors combined to lower bothGVandMGC.
The more interesting behavior was exhibited by the patient with severeIR(Fig. 2b). The first glucose concentration peak was seen to be larger than its corresponding pre-insulin baseline peak, and we termed this behavior “rebound hyperglycemia.” Furthermore, the first glucose concentration trough after the injection was significantly lower than the cor-responding baseline trough. These 2 factors combined to decrease MGC but increase
GV. The “rebound hyperglycemia” first appeared at 4 U and worsened as the dose of SQ Lispro insulin was increased. Because of the “rebound hyperglycemia”, the change-in-MGC curves (Fig. 1b) began to flatten when theIRwas severe and the dose of SQ increased above 4 U. This picture signaled a nonlinear dose-response relation between SQ Lispro insulin andMGCin patients with severeIR: a potential important observa-tion for the design of sliding-scale SQ Lispro insulin protocols for such patients. No episodes of hypoglycemia were noted; however, the significantly decreased first trough in Fig. 2b suggests that SQ Lispro insulin may be particularly likely to cause hypo-glycemia. It is important to mention that “rebound hyperglycemia” was also seen when type 2 diabetics were modeled with a validated numerical model that simulated diabet-ics receiving continuous nutrition while being treated with SQ Lispro insulin for their hyperglycemia [42].
Fig. 2G(t), glucose concentration versus time, after 5 U of SQ Lispro insulin were injected att=0; baseline
G(t)was also plotted for comparison. Both patients were receiving nutrition at goal.aThe patient with mild
IR, mildIDpand borderlineIC.bThe patient with severeIR, mildIDpand borderlineIC; note the “rebound
Fig. 3The 4 patients with borderlineICand nutrition at goal.aThe change-in-GVversus number of SQ regular insulin units injected.bThe change-in-MGCversus number of SQ regular insulin units injected
In general,IRseems to have rendered the glucose-insulin axis more sensitive to pertur-bations caused by SQ ultrashort insulin analogs; this result was evidenced by the “rebound hyperglycemia” and increased GV. It is important to note that hourly glucose checks would be required to identify an increase inGVin an analogous real patient.
SQ regular insulin, the 4 borderlineICpatients, and nutrition at goal
The same group of 4 patients from the previous subsection (the 4 patients with borderline
ICwho were receiving nutrition at goal) were next given SQ regular insulin at exactly the same time point as the previous SQ Lispro insulin injections; this approach facilitated a comparison between the 2 insulin preparations.
Figure 3a and b show linear decreases inGV andMGCwith an increasing SQ regu-lar insulin dose. This picture demonstrated a linear dose-response relation between SQ regular insulin andMGC/GV; a linear dose-response is presumed optimal for a sliding-scale SQ insulin protocol. To interpret these metrics in terms of the glucose concentration dynamics, theG(t)data were again examined; Fig. 4a shows a patient with mildIRand mildIDp. The results revealed that the first 5 glucose concentration peaks were lowered;
this finding is consistent with the duration of action of SQ regular insulin.
In contrast to SQ Lispro insulin, the same well-behaved dynamics occurred in the patient with severe IR; again, the first several glucose concentration peaks were sup-pressed (Fig. 4b). Furthermore, SQ regular insulin only minimally decreased the glucose concentrations troughs as compared to SQ Lispro insulin (Figs. 2 and 4). This finding suggests that SQ regular insulin would be less likely to cause hypoglycemia, as compared
Fig. 4G(t), glucose concentration versus time, after 5 U of regular insulin were injected att=0; baseline
G(t)was also plotted for comparison. Both patients were receiving nutrition at goal and had mildIDpand
to SQ Lispro insulin (at least, for the patients examined thus far). Finally, bothMGCand
GV were similarly lowered regardless of theIRorIDpvalue. Unlike SQ Lispro insulin,
SQ regular insulin did not cause “rebound hyperglycemia” at higher doses. In addition, no episodes of hypoglycemia were noted.
In this subsection, the response of the glucose-insulin axis to perturbation by a short SQ insulin preparation appeared better behaved as compared to the effects of the ultra-short SQ Lispro insulin (see the previous subsection). Thus, the difference between the onset/duration of action of the insulin preparations significantly affects the response of the glucose-insulin axis to SQ insulin therapies as measured byGV andMGC. Similar results were observed in a validated numerical study of patients with type 2 diabetes who received continuous enteral feeding [42].
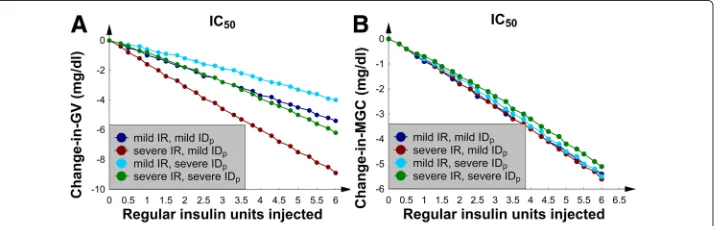
SQ Lispro insulin, the 4 patients withIC50, and nutrition at goal
To examine the consequences of increasingICto pathological levels, the second set of 4 patients with IC50 (borderline ICincreased by 50 %) was studied next; this analysis
allowed for a comparison of the glucose dynamics in the patients with borderlineICand
IC50after SQ Lispro insulin therapy. As before, nutrition was at goal.
A direct comparison of the borderlineICandIC50change-in-GV curves (Figs. 1a and
5a) shows that the glucose dynamics remained qualitatively similar between the 2 patient groups. In both sets of curves,GV first decreased and then increased after approximately 4 U. In contrast, the change-in-GVwas an order of magnitude smaller in theIC50patient
group. This result was due to the additional mechanism (an increased IC) that wors-enedIDand blunted the patient’s response to the same SQ Lispro insulin dose. TheIC50
change-in-MGCcurves (Fig. 5b) were different from the corresponding change-in-MGC
graphs with borderlineIC(Fig. 1b) because theMGCdecreased in a monotonic fashion and never flattened.
To demonstrate that the qualitative behavior of the measurables remained similar between the borderlineICandIC50patient groups, the effects of increasing the SQ Lispro
insulin dose on a patient with severeIRwere examined. In particular, Fig. 6a and b show the effects of 3 and 6 U of SQ Lispro insulin, respectively, which were injected in the patient with severeIRand mildIDp. The graphs show that as the dose of SQ Lispro insulin
increased, theG(t)curves began to resemble the curves that were found in the patient with severe IR, mild IDp, and borderlineIC (Fig. 2b). That is, the first peak after the
Fig. 5The 4 patients withIC50(50 % increase in IC from borderlineIC) and nutrition at goal.aThe change-in-GV
Fig. 6G(t), glucose concentration versus time. BaselineG(t)was also plotted for comparison. The patient had severeIR, mildIDpandIC50with nutrition at goal.G(t)aftera3 U of SQ Lispro insulin were injected at t=0 and afterb6 U of SQ Lispro insulin were injected att=0
SQ Lispro insulin injection nearly returned to its baseline value, just avoiding “rebound hyperglycemia”; note, this phenomenon occurred at the higher insulin doses. Therefore, the underlying glucose-insulin dynamics remained qualitatively similar between the bor-derlineICandIC50patient groups; albeit, the effects of SQ Lispro insulin were blunted
by the higherICvalues. In fact, “rebound hyperglycemia” could be produced when the SQ Lispro insulin dose exceeded 6 U (data not shown). Finally, changingIDpfrom mild
to severe did not significantly affect the change-in-MGCand change-in-GV curves; this finding is similar to the data in the corresponding borderlineICsubsection.
SQ regular insulin, the 4 patients withIC50, and nutrition at goal
Next, the previous 4 numerical experiments were repeated; however, the insulin prepa-ration was changed to regular insulin. In the 4 patients with IC50, Fig. 7a and b show
that bothGV andMGCdecreased in a linear manner as the SQ regular insulin dose was increased. The correspondingG(t)graphs were similar to those patients with borderline
ICpresented in Fig. 4; therefore, theG(t)data for theIC50patients are not shown.
More-over, the linear dose-response relation between SQ regular insulin andMGCwas found to be similar to the dependence shown in Fig. 3b: again, presumed optimal for a sliding-scale SQ insulin protocol. Now familiar, changing IDp from mild to severe did not
signifi-cantly affect the change-in-MGCand change-in-GVcurves. Furthermore, we noted that increasing theICfrom borderline toIC50resulted in approximately a 50 % decrease in the
size of the change-in-GVand change-in-MGCcurves (compare Figs. 3 and 7).
Fig. 7The 4 patients withIC50and nutrition at goal.aThe change-in-GVversus number of SQ regular insulin
Both SQ insulin preparations, all 8 patients, and nutrition at half goal
It is not uncommon for patients to require a decrease in the rate of their enteral feedings because of intolerance; therefore, all of the above experiments were repeated but with the rate of nutrition halved, or nutrition at half goal. All 8 patients are discussed within this subsection.
For the 4 patients with borderlineIC, both insulin preparations decreasedMGCin a linear manner (Fig. 8a and b). Nevertheless, SQ Lispro insulin and SQ regular insulin had an opposite effect onGV. SQ Lispro insulin increasedGVas the dose increased (Fig. 9a), whereas SQ regular insulin decreasedGV (Fig. 9b). TheG(t)data showed that the main effect of SQ Lispro insulin was to significantly decrease the first glucose concentration trough after the injection, suggesting that SQ Lispro insulin has the larger risk of causing hypoglycemia when the rate of continuous nutrition is decreased, when compared to SQ regular insulin. After this, the first postinjection glucose concentration peak returned to its baseline value, nearly causing “rebound hyperglycemia”. This phenomenon decreased
MGCbut increasedGV. The SQ regular insulin injection, however, smoothly decreased several glucose concentration peaks, thus decreasing bothMGCandGV, just as in Fig. 3; therefore, theG(t)data are not shown.
Increasing theICfrom borderline toIC50decreased the magnitude of the change-in-MGCand change-in-GV curves; this pattern was seen in the corresponding subsections when the nutrition was at goal. Because the qualitative shapes of the curves were similar to those in the previous subsections, the data are not shown.
Finally, there were no episodes of either hypoglycemia or “rebound hyperglycemia” in any patient, and theIDpvalue again did not significantly affect the change-in-MGCand
change-in-GVcurves.
Both SQ insulin preparations, all 8 patients, and no nutrition
Either because of a required procedure or feeding intolerance, patients sometimes need their enteral feedings held. To examine this clinical scenario, the nutritional source was removed, and the simulations were repeated; all 8 patients are discussed within this subsection.
The main effect of removing the nutritional source on the baseline simulations was a decrease in the glucose concentration troughs that was greater than the decrease in the corresponding glucose concentration peaks. In the comparison with the nutrition-at-goal simulations, the baseline glucose concentration troughs were approximately
Fig. 9The 4 patients with borderlineICand nutrition at half goal.aThe change-in-GVversus number of SQ Lispro insulin units injected.bThe change-in-GVversus number of SQ regular insulin units injected
20 mg/dL lower. The change-in-GV and change-in-MGC curves were quantitatively similar to the corresponding curves in the nutrition-at-half-goal subsection (data not shown).
The most remarkable finding in this subsection was that SQ Lispro insulin (but not regular insulin) caused hypoglycemia (glucose concentrations near 60 mg/dL). This effect was seen in the 4 patients with borderlineICwhen the dose exceeded 4 U; the effect occurred in part because the baseline troughs were lowered when the nutritional source was removed.
Finally, increasing the IC from borderline to IC50 decreased the magnitude of the
change-in-GV and change-in-MGCcurves. TheIDpvalue again had minimal effects on
the glucose dynamics.
Discussion
To the best of our knowledge, SQ Lispro insulin and SQ regular insulin have not been compared in SH patients receiving continuous nutrition. The numerical study that included this comparison, unfortunately, did not involve analysis ofID [41], which we have included here. Our 3 main findings are:
1 SQ Lispro insulin tended to increaseGV even if MGC was decreased, and at times,
it did so in a nonlinear manner. Hourly glucose checks would be required to uncover this phenomenon in a corresponding real patient.
2 SQ regular insulin tended to decreaseMGC and GV in a linear manner, with
respect to its dose, suggesting that this preparation is better suited for a sliding-scale SQ protocol, as compared to SQ Lispro insulin.
3 Higher SQ Lispro insulin doses produced hypoglycemia when the patients’
nutritional sources were discontinued; SQ regular insulin did not cause hypoglycemia in any simulation.
Glucose variability
Because it is associated with negative clinical outcomes,GV was chosen as a primary end point [14, 15, 21, 48, 49, 52, 53, 56, 57]. Glucose fluctuations produce changes in plasma osmolality that can lead to cellular and organ dysfunction, thus increasing mor-bidity [58]. Oxidative stress, which is enhanced by glucose fluctuations more than by sustained hyperglycemia [59], may be a unifying mechanism underpinning vasoconstric-tion, microvascular thrombosis, and inflammation associated with elevatedGV[60]. One study of surgical critical-care patients showed that the highest mortality rate is observed whenGV and hyperglycemia were both present; that study also revealed thatGV is the more important outcome predictor [53]. Such studies have led some to argue that glucose management protocols should focus on bothMGCandGV as treatment targets [61].
There seem to be no clinical studies that involve measurement ofGV after administra-tion of short-acting SQ insulin preparaadministra-tions within the time frame examined here. This is probably because sliding-scale SQ insulin regimens imply sampling of glucose values every 3-6 h. The data presented in Figs. 2, 4 and 6 show that one glucose measurement per hour would be required to detect the increase inGV uncovered by our numerical simulations. Therefore, the ability of a typical sliding-scale insulin protocol to capture the effects of SQ Lispro insulin onGV is limited.
Effects of insulin resistance
TheGV data suggested that patients with severeIRare the most sensitive to changes in exogenous insulin concentrations. “Rebound hyperglycemia” occurred only in the patients with severeIRwhen the continuous nutrition was at goal. This result suggests that these patients are at a higher risk of developing elevatedGV from an insulin therapy, particularly if the insulin concentration changes with sufficient amplitude. This notion is consistent with the numerical works that examined the effects of insulin infusion rate changes on patients with SH [62] and on patients with type 2 diabetes who were receiv-ing continuous enteral feedreceiv-ings and SQ insulin therapy [42]. It should be noted, that the model used to examine the diabetics is the one used in this study, albeit with = 1 (normal rate of gluconeogenesis); furthermore, the model parameters used were validated against actual patients’ glucose concentration data. Currently, there is no easy method of directly measuring theIRand what constitutes severely elevatedIRis poorly defined. Computer-based insulin protocols that individually construct patient centered insulin therapies can provide theIRdata [63], which may indicate impending infection if theIR
is elevated in patients without diabetes [64, 65].
We hypothesize thatIRis an important metric for the categorization of SH disease states because our virtual patients’ glucose dynamics varied significantly according to its value. Perhaps severeIR, and its associated altered glucose mechanics, may partially explain why the treatment of SH in the TGC era correlated negatively with GV (as mea-sured by standard deviation) [15]. Furthermore, patients with various relative values ofIR
significant association between glucose variability or mortality in either the SPRINT or TGC arm [66].
Effects of insulin deficiency
Unlike IR, worsening IDdid not correlate with increased GV. Severe ID, which was a result of decreased pancreatic insulin secretion and an elevatedIC, was associated with smaller decreases inMGCandGV after both insulin therapies, as compared to patients with borderlineID.
Importance of time scales
We posit thatGV may be increased by an insulin therapy when the time scale over which the insulin concentration changes is of the same order, or smaller, than the period of the patient’s glucose ultradian oscillation. A similar mechanism (uncovered by a validated numerical study) was speculated to be present in type 2 diabetics who were receiving continuous enteral feedings and SQ insulin therapies for their hyperglycemia [42].
We arrived at this hypothesis after comparing two length scales that were present in each simulation: the period of the patient’s ultradian glucose concentration oscillations and the duration of action of the insulin preparation. The period of the ultradian oscil-lations in glucose represented the time needed by the glucose-insulin feedback system to maintain glucose concentrations within a particular range and variability. When the change in exogenous insulin concentration within this time frame was large, the glu-cose concentrations fluctuated, andGV increased. In particular, the SQ Lispro insulin absorption/concentration profile increased in the first 35 min after the injection and then decreased to nearly zero over the next 90 min, nearly matching the period of the patients’ ultradian glucose concentration oscillations. In comparison, SQ regular insulin reaches its maximum after nearly 1 ultradian period, and almost 2 ultradian periods are required for its concentration to reach zero [33, 41].
Effects of the rate of nutrition
The rate of the continuous nutritional source also affected the patient’s response to the SQ insulin therapies. For the doses examined, SQ regular insulin loweredMGCandGV with-out causing hypoglycemia. SQ Lispro insulin caused hypoglycemia only at higher doses if the nutritional source was discontinued. This result is consistent with recent clinical [67] and numerical [42] studies of patients with diabetes who received continuous gastric feeds. It is also important to note that the rate of continuous nutrition also played a role in whether SQ Lispro insulin produced “rebound hyperglycemia”.
Limitations
This study has several limitations. First, although the model was validated for type 1 and type 2 diabetes, it had not been validated on human data gathered from the criti-cally ill. As such, we have discussed only the qualitative aspects of our data. This study should be followed with a randomized controlled clinical study that directly compares SQ Lispro insulin and SQ regular insulin in patients with SH receiving continuous nutrition before a clinical recommendation can be made.GV should remain a primary end point, which would require continuous glucose monitoring or glucose checks every hour for evaluation [77]. Finally, this study did not address insulin stacking, which may also cause hypoglycemia [78].
Conclusion
SH and different SQ insulin therapies can be studied using a mathematical model of the glucose-insulin feedback system. This type of study allows for qualitative analysis ofMGC,
GV, and hypoglycemia after SQ injections of Lispro and regular insulins. The model yields insights into the dynamics of glucose metabolism that would be difficult to ascertain oth-erwise. The model may also guide the design of future clinical trials in, for example, the benefit of hourly glucose checks to measureGV if an ultrashort insulin preparation is used for SH (particularly, if severe IR is present).
SQ regular insulin consistently loweredMGCandGV in a linear fashion, thus making the preparation better suited for a sliding-scale protocol. In terms of GV and hypo-glycemia, the inferior performance of SQ Lispro insulin was a result of its shorter duration of action; thus, SQ Lispro insulin may not be the best choice for patients who are continually postprandial.
Clinical trials are needed to examine whether these theoretical results represent the glucose-insulin dynamics that occur in intensive care units. If such dynamics are present, their clinical effects should be evaluated.
Finally, patients with severe IR were the most prone to an increase in GV from a change in exogenous insulin concentrations. Severe IR may be an indicator of the underlying-glucose-dynamics’ sensitivity to perturbations inherent in some insulin ther-apies, particularly to the ultrashort SQ insulin analogs in the background of continuous enteral feedings.
Abbreviations
SH: stress hyperglycemia; IR: insulin resistance; ID: insulin deficiency; GV: glucose variability; TGC: tight glycemic control; SQ: subcutaneous; MGC: mean glucose concentration; IC: insulin clearance; IC50: borderline insulin clearance increased by 50 %; IDp: insulin deficiency from decreased pancreatic insulin secretion.
Competing interests
The authors declare that they have no competing interests.
Authors’ contributions
Study design: RJS. Computer program design, construction and implementation: RJS. Data interpretation: RJS, MCS, MSC, SCM and SBA. Drafting the manuscript: RJS, MCS, MSC, SCM and SBA. Revising the manuscript content: RJS and SBA. Approving the final version of the manuscript: RJS, MCS, MSC, SCM, and SBA. All authors read and approved the final manuscript.
Authors’ information
RJS holds a PhD in computational physics along with a MD degree.
Acknowledgements
Disclaimers
The views expressed are those of the authors and do not reflect the official policy or position of the Department of the Air Force, Department of the Army, Department of Defense, or the US Government.
Author details
1Department of Trauma and Critical Care Surgery, San Antonio Military Medical Center, 3551 Roger Brooke Drive, Fort Sam Houston, San Antonio, TX, USA.2Walter Reed National Military Medical Center, 8901 Rockville Pike, Bethesda, MD, USA.3Division of Trauma, Acute Care and Critical Care Surgery, Pennsylvania State College of Medicine, 500 University Drive, Hershey, PA, USA.
Received: 12 September 2015 Accepted: 20 January 2016
References
1. Jeevanandam M, Young D, Schiller W. Glucose turnover, oxidation, and indices of recycling in severely traumatized patients. J Trauma. 1990;30(5):582–9.
2. McGuinness O, Fugiwara T, Murrell S, Bracy D, Neal D, O’Connor D, et al. Impact of chronic stress hormone infusion on hepatic carbohydrate metabolism in the conscious dog. Am J Physiol. 1993;265(2):314–22. 3. Fujiwara T, Cherrington A, Neal D, McGuinness O. Role of cortisol in the metabolic response to stress hormone
infusion in the conscious dog. Metabolism. 1996;45(5):571–8.
4. Andrews C, Walker B. Glucocorticoids and insulin resistance: old hormones, new targets. Clin Sci. 1999;96:513–23. 5. Black P, Brooks D, Bessey P, Wolfe R, Wilmore D. Mechanisms of insulin resistance following injury. Ann Surg.
1982;196(4):420–35.
6. Thorell A, Efendic S, Gutniak M, Häggmark T, Ljungqvist O. Insulin resistance after abdominal surgery. Br J Surg. 1994;81(1):59–63.
7. Mowery N, Carnevale R, Gunter O, Norris P, Dossett L, Dortch M, et al. Insulin resistance heralds positive cultures after severe injury. Surg Infect. 2009;10(6):503–9.
8. Mowery N, Gunter O, Guillamondegui O, Dossett L, Dortch M, Morris Jr J, et al. Stress insulin resistance is a marker for mortality in traumatic brain injury. J Trauma. 2009;66(1):145–53.
9. Mowery N, May A, Collier B, Dossett L, Gunter O, Dortch M, et al. Glucose metabolism, not obesity, predicts mortality in critically ill surgical patients. Am Surg. 2010;76(12):1377–83.
10. Pielmeier U, Rousing M, Andreassen S. Pancreatic secretion, hepatic extraction, and plasma clearance of insulin from steady-state insulin and c-peptide measurements in critically ill patients. In: 19th IFAC World Congress Cape Town, South Africa. International Federation of Automatic Control; 2014. p. 10964–9.
11. Wexler D, Nathan D, Grant R, Regan S, Van Leuvan A, Cagliero E. Prevalence of elevated hemoglobin a1c among patients admitted to the hospital without a diagnosis of diabetes. J Clin Endocrinol Metab. 2008;93(11):4238–44. 12. Kopelman T, O’Neill P, Kanneganti S, Davis K, Drachman D. The relationship of plasma glucose and glycosylated
hemoglobin a1c levels among nondiabetic trauma patients. J Trauma. 2008;64(1):30–4.
13. Ertorer M, Haydardedeoglu F, Erol T, Anaforoglu I, Binici S, Tutuncu N, et al. Newly diagnosed hyperglycemia and stress hyperglycemia in a coronary intensive care unit. Diabetes Res Clin Pract. 2010;90(1):8–14.
14. Krinsley J. Glycemic variability and mortality in critically ill patients: the impact of diabetes. J Diabetes Sci Technol. 2009;3(6):1292–301.
15. Krinsley J. Glycemic variability: a strong independent predictor of mortality in critically ill patients. Crit Care Med. 2008;36(11):3008–13.
16. Jacobi J, Bircher N, Krinsley J, Agus M, Braithwaite S, Deutschman C, et al. Guidelines for the use of an insulin infusion for the management of hyperglycemia in critically ill patients. Crit Care Med. 2012;40(12):3251–76. 17. Krinsley J. Association between hyperglycemia and increased hospital mortality in a heterogeneous population of
critically ill patients. Mayo Clin Proc. 2003;78(12):1471–8.
18. Ishihara M, Kojima S, Sakamoto T, Asada Y, Tei C, Kimura K, et al. Acute hyperglycemia is associated with adverse outcome after acute myocardial infarction in the coronary intervention era. Am Heart J. 2005;150(4):814–20. 19. Desouza C, Bolli G, Fonseca V. Hypoglycemia, diabetes, and cardiovascular events. Diabetes Care. 2010;33(6):
1389–94.
20. Kosiborod M, Inzucchi S, Goyal A, Krumholz H, Masoudi F, Xiao L, et al. Relationship between spontaneous and iatrogenic hypoglycemia and mortality in patients hospitalized with acute myocardial infarction. JAMA. 2009;301(15):1556–64.
21. Badawi O, Waite M, Fuhrman S, Zuckerman I. Association between intensive care unit–acquired dysglycemia and in-hospital mortality. Crit Care Med. 2012;40(12):3180–8.
22. Finfer S, Chittock D, Su S, Blair D, Foster D, Dhingra V, et al. Intensive versus conventional glucose control in critically ill patients. N Engl J Med. 2009;360(13):1283–97.
23. Eriksson E, Christianson D, Vanderkolk W, Bonnell B, Hoogeboom J, Ott M. Tight blood glucose control in trauma patients: who really benefits?. J Emerg Trauma Shock. 2011;4(3):359–64.
24. Preiser J, Devos P, Ruiz-Santana S, Mélot C, Annane D, Groeneveld J, et al. A prospective randomised multi-centre controlled trial on tight glucose control by intensive insulin therapy in adult intensive care units: the glucontrol study. Intensive Care Med. 2009;35(10):1738–48.
25. Marik P, Preiser J. Toward understanding tight glycemic control in the icu: a systematic review and metaanalysis. Chest. 2010;137(3):544–51.
26. Preiser J, Ichai C, Orban J, Groeneveld A. Metabolic response to the stress of critical illness. Br J Anaesth. 2014;113(6):945–54.
28. Nisly S, Harris S, Aykroyd L, Carrol J, Ulmer B, Waddell M, et al. Use of a subcutaneous insulin computerized glucostabilizer? program on glycemic control in the intensive care setting: a retrospective data analysis. Adv Diabetes Metab. 2013;1(1):29–35.
29. Anderson J, Brunelle R, Koivisto V, Pfützner A, Trautmann M, Vignati L, et al. Reduction of postprandial hyperglycemia and frequency of hypoglycemia in iddm patients on insulin-analog treatment. Diabetes. 1997;46(2): 265–70.
30. Home P, Lindholm A, Hylleberg B, Round P. Improved glycemic control with insulin aspart: a multicenter randomized double-blind crossover trial in type 1 diabetic patients. uk insulin aspart study group. Diabetes Care. 1998;21(11):1904–9.
31. Hirsch I. Insulin analogues. N Engl J Med. 2005;352(2):174–83.
32. Recasens M, Aguilera E, Morjnigo R, Casamitjana R, Nicoletti F, Gomis R, et al. Insulin lispro is as effective as regular insulin in optimising metabolic control and preservingβ-cell function at onset of type 1 diabetes mellitus. Diabetes Res Clin Pract. 2003;60(3):153–9.
33. Wang H, Li J. Mathematical modeling and qualitative analysis of insulin therapies. Math Biosci. 2007;210(1):17–33. 34. Toli´c I, Mosekilde E, Sturis J. Modeling the insulin–glucose feedback system: the significance of pulsatile insulin
secretion. J Theor Biol. 2000;207(3):361–75.
35. Li J, Kuang Y, Mason C. Modeling the glucose–insulin regulatory system and ultradian insulin secretory oscillations with two explicit time delays. J Theor Biol. 2006;242(3):722–35.
36. Li J, Kuang Y. Analysis of a model of the glucose-insulin regulatory system with two delays. SIAM J Appl Math. 2007;67(3):757–76.
37. Wang H, Li J, Kuang Y. Enhanced modelling of the glucose–insulin system and its applications in insulin therapies. J Biol Dynam. 2009;3(1):22–38.
38. Chen CL, Tsai HW. Modeling the physiological glucose–insulin system on normal and diabetic subjects. Comput Methods Prog Biomed. 2010;97(2):130–40.
39. Huang M, Li J, Song X, Guo H. Modeling impulsive injections of insulin: towards artificial pancreas. SIAM J Appl Math. 2012;72(5):1524–48.
40. Haidar A, Legault L, Messier V, Mitre T, Leroux C, Rabasa-Lhoret R. Comparison of dual-hormone artificial pancreas, single-hormone artificial pancreas, and conventional insulin pump therapy for glycaemic control in patients with type 1 diabetes: an open-label randomized controlled crossover trial. Lancet Diabetes Endocrin. 2015;3(1):17–26. 41. Strilka R, Armen S, Indeck M. Qualitative analysis of subcutaneous lispro and regular insulin injections for stress
hyperglycemia: a pilot numerical study. J Theor Biol. 2014;356:192–200.
42. Stull MC, Strilka RJ, Clemens MS, Armen SB. Comparison of subcutaneous regular insulin and lispro insulin in diabetics receiving continuous nutrition a numerical study. J Diabetes Sci Technol. 2016;10(1):137–44. 43. Keener J, Sneyd J. Mathematical Physiology. Interdisciplinary applied mathematics. New York: Springer; 1998.
https://books.google.com/books?id=x2rSM-BBc_4C.
44. Topp B, Promislow K, deVries G, Miura R, Finegood D. A model ofβ-cell mass, insulin, and glucose kinetics: pathways to diabetes. J Theor Biol. 2000;206(4):605–19.
45. Rizza R, Mandarino L, Gerich J. Dose-response characteristics for effects of insulin on production and utilization of glucose in man. Am J Physiol. 1981;240(6):630–9.
46. Siegelaar S, Holleman F, Hoekstra J, DeVries J. Glucose variability; does it matter? Endocr Rev. 2010;31(2):171–82. 47. Wintergerst K, Buckingham B, Gandrud L, Wong B, Kache S, Wilson D. Association of hypoglycemia, hyperglycemia,
and glucose variability with morbidity and death in the pediatric intensive care unit. Pediatrics. 2006;118(1):173–9. 48. French C, Hart G. Variability of blood glucose concentration and short-term mortality in critically ill patients.
Anesthesiology. 2006;105(2):244–52.
49. Ali N, O’Brien Jr J, Dungan K, Phillips G, Marsh C, Lemeshow S, et al. Glucose variability and mortality in patients with sepsis. Crit Care Med. 2008;36(8):2316–21.
50. Molnar G, Rosevear J, Ackerman E, Gatewood L, Taylor W. Mean amplitude of glycemic excursions, a measure of diabetic instability. Diabetes. 1970;19(9):644–55.
51. Kovatchev B, Cox D, Gonder-Frederick L, Clarke W. Symmetrization of the blood glucose measurement scale and its applications. Diabetes Care. 1997;20(11):1655–8.
52. Eslami S, Taherzadeh Z, Schultz M, Abu-Hanna A. Glucose variability measures and their effect on mortality: a systematic review. Intensive Care Med. 2011;37(4):583–93.
53. Hermanides J, Vriesendorp T, Bosman R, Zandstra D, Hoekstra J, DeVries J. Glucose variability is associated with intensive care unit mortality. Crit Care Med. 2010;38(3):838–42.
54. McDonnell C, Donath S, Vidmar S, Werther G, Cameron F. A novel approach to continuous glucose analysis utilizing glycemic variation. Diabetes Technol Ther. 2005;7(2):253–63.
55. Facchinetti A, Sparacino G, Guerra S, Luijf Y, DeVries J, Mader J, et al. Real-time improvement of continuous glucose monitoring accuracy: The smart sensor concept. Diabetes Care. 2013;36(4):793–800.
56. Dossett L, Cao H, Mowery N, Dortch M, Morris J, May A. Blood glucose variability is associated with mortality in the surgical intensive care unit. Am Surg. 2008;74(8):679–85.
57. Lanspa M, Dickerson J, Morris A, Orme J, Holmen J, Hirshberg E. Coefficient of glucose variation is independently associated with mortality in critically ill patients receiving intravenous insulin. Crit Care. 2014;18(2):86.
58. Ceriello A, Esposito K, Piconi L, Ihnat M, Thorpe J, Testa R, et al. Oscillating glucose is more deleterious to endothelial function and oxidative stress than mean glucose in normal and type 2 diabetic patients. Diabetes. 2008;57(5):1349–54.
59. Monnier L, Mas E, Ginet C, Michel F, Villon L, Cristol J, et al. Activation of oxidative stress by acute glucose fluctuations compared with sustained chronic hyperglycemia in patients with type 2 diabetes. JAMA. 2006;295(14): 1681–7.
61. Hirsch I, Brownlee M. Should minimal blood glucose variability become the gold standard of glycemic control? J Diabetes Comp. 2005;19(3):178–81.
62. Strilka R, McCarver S, Armen S, Indeck M. 351: Effects of insulin infusion rate changes on glucose oscillations for stress hyperglycemia. Crit Care Med. 2014;42(12):1445.
63. Chase J, Le Compte A, Suhaimi F, Shaw G, Lynn A, Lin J, et al. Tight glycemic control in critical care–the leading role of insulin sensitivity and patient variability: a review and model-based analysis. Comput Methods Prog Biomed. 2011;102(2):156–71.
64. Mukherjee K, Sowards K, Brooks S, Norris P, Boord J, May A. Insulin resistance increases before ventilator-associated pneumonia in euglycemic trauma patients. Surg Infect. 2014;15(6):713–20.
65. Pisarchik A, Pochepen O, Pisarchyk L. Increasing blood glucose variability is a precursor of sepsis and mortality in burned patients. PLoS One. 2012;7(10):46582.
66. Chase J, Shaw G, Le Compte A, Lonergan T, Willacy M, Wong XW, et al. Implementation and evaluation of the sprint protocol for tight glycemic control in critically ill patients: a clinical practice change. Crit Care. 2008;12(2):49. 67. Hsia E, Seggelke S, Gibbs J, Rasouli N, Draznin B. Comparison of 70/30 biphasic insulin with glargine/lispro regimen
in non–critically ill diabetic patients on continuous enteral nutrition therapy. Nutr Clin Pract. 2011;26(6):714–7. 68. Suhaimi F, Le Compte A, Preiser JC, Shaw G, Massion P, Radermecker R, et al. What makes tight glycemic control
tight? the impact of variability and nutrition in two clinical studies. J Diabetes Sci Technol. 2010;4(2):284–98. 69. Pielmeier U, Andreassen S, Juliussen B, Chase J, Nielsen B, Haure P. The glucosafe system for tight glycemic
control in critical care: a pilot evaluation study. J Crit Care. 2010;25(1):97–104.
70. Evans A, Le Compte A, Tan CS, Ward L, Steel J, Pretty C, et al. Stochastic targeted (star) glycemic control: design, safety, and performance. J Diabetes Sci Technol. 2012;6(1):102–15.
71. Stewart K, Pretty C, Tomlinson H, Fisk L, Shaw G, Chase J. Stochastic model predictive (stomp) glycaemic control for the intensive care unit: development and virtual trial validation. Biomed Signal Process Control. 2015;16:61–7. 72. Harvey R, Dassau E, Bevier W, Seborg D, Jovanoviˇc L, Doyle III F, et al. Clinical evaluation of an automated artificial
pancreas using zone-model predictive control and health monitoring system. Diabetes Technol Ther. 2014;16(6): 348–57.
73. Kissler S, Cichowitz C, Sankaranarayanan S, Bortz D. Determination of personalized diabetes treatment plans using a two-delay model. J Theor Biol. 2014;359:101–11.
74. Furutani E. Recent trends in blood glucose control studies. Automat Control Physiol State Func. 2015;2(106):1–5. 75. Palumbo P, Ditlevsen S, Bertuzzi A, De Gaetano A. Mathematical modeling of the glucose–insulin system: a review.
Math Biosci. 2013;244(2):69–81.
76. Delitala M, Marsan G. Managing Complexity: Modeling Biological Systems, 1st Kepler Prize Workshop of the European Academy of Sciences (EURASC), Heidelberg, May 2011. Springer proceedings in mathematics & statistics. Berlin: Springer; 2014. https://books.google.com/books?id=qZTIAwAAQBAJ.
77. Krinsley J, Bruns D, Boyd J. The impact of measurement frequency on the domains of glycemic control in the critically ill-a monte carlo simulation. J Diabetes Sci Technol. 2015;9(2):237–45.
78. Heise T, Meneghini L. Insulin stacking versus therapeutic accumulation: understanding the differences. Endocr Pract. 2014;20(1):75–83.
• We accept pre-submission inquiries
• Our selector tool helps you to find the most relevant journal • We provide round the clock customer support
• Convenient online submission • Thorough peer review
• Inclusion in PubMed and all major indexing services • Maximum visibility for your research
Submit your manuscript at www.biomedcentral.com/submit