RESEARCH
Is travel actually risky? A study
of situational causes of victimization
Stijn Ruiter
1,2*†and Wim Bernasco
1,3†Abstract
Objective: We present a first test using a smartphone time use survey app for whether the risk of criminal victimiza-tion is higher while traveling than during other activities, and assess risk heterogeneity between public transport, private transport by car, and private open-air transport.
Methods: A sample of 1334 young adults completed a time-use survey on their smartphones with additional items on criminal victimization. Participants reported their time use and victimization experiences (vandalism, theft, threat, or assault) per 10-min timeslot for 4 days. To prevent potential confounders from affecting the results, we analyzed the data with a fixed effects logit model that exclusively relies on within-person variation between timeslots.
Findings: A total of 78 victimization situations were reported by 45 participants. Although these numbers are too low to draw definitive conclusions, with respect to the four types of victimization measured, sleeping appeared to be the safest activity. The risk of victimization was considerably larger during travel, but also during many other activities. We found shopping to be the activity with the highest risk of victimization. No victimization was observed during private transport by car, but the risk of victimization was significantly higher in private open-air and public transport than during sleep.
Conclusion: Using a state-of-the-art instrument and a rigorous statistical design, we tentatively conclude that the risk of criminal victimization is not higher during travel than during most other activities, only sleeping is safer. Larger samples are needed to assess the robustness of our findings. We discuss practical implications, strengths and weak-nesses of the study, and new research challenges.
Keywords: Victimization risk, Time use, Travel mode, Smartphone, Fixed effects
© The Author(s) 2018. This article is distributed under the terms of the Creative Commons Attribution 4.0 International License (http://creat iveco mmons .org/licen ses/by/4.0/), which permits unrestricted use, distribution, and reproduction in any medium, provided you give appropriate credit to the original author(s) and the source, provide a link to the Creative Commons license, and indicate if changes were made.
Background
Travel has been associated with a heightened risk of
criminal victimization (Lemieux and Felson 2012; Levine
and Wachs 1986a; Newton and Ceccato 2015). If fear of
crime deters people from traveling, it limits their eco-nomic and civic participation and represents considera-ble societal costs. This paper presents the results of a first smartphone time use survey aimed at assessing whether claims of heightened victimization risk during travel are justified.
The two main theories of victimization are routine
activity theory (Cohen and Felson 1979) and lifestyle
theory (Hindelang et al. 1978). Both theories postulate
that criminal victimization is a function of the activi-ties that potential victims engage in and the settings that they are exposed to, and both theories share a focus on
proximate causes of victimization. Proximate causes are those events that occur close in space and time to vic-timization. In other words, both theories emphasize the situational characteristics that differentiate victimization from non-victimization rather than the personal charac-teristics that differentiate victims from non-victims.
Neither routine activity theory nor lifestyle theory explicitly addresses the role of travel in victimization. However, both claim that exposure to potential offend-ers and the absence of guardians heighten the risk of
Open Access
*Correspondence: [email protected]; [email protected]
victimization, and both risk factors seem to apply dispro-portionately to travel.
Travelers often find themselves amongst crowds that include potential offenders, and in unfamiliar places and situations. They are often tired or distracted and vul-nerable for lack of guardianship, especially when they
travel alone (Myhre and Rosso 1996). These observations
appear to justify the belief that travel is a risky activity. They also suggest that it might be important to distin-guish between travel modes, as travel modes may vary in terms of exposure to potential offenders and levels of guardianship.
Given the current state of knowledge, the first question we address in the present paper is whether people indeed suffer a higher risk of victimization during travel than during other activities. We answer this question with a novel approach using a dedicated smartphone survey app, which respondents used to report their time use and victimization per 10-min interval. Because travel modes vary in terms of exposure to motivated offenders and the presence of guardians, it seems likely that they also vary in terms of victimization risk. We therefore com-pare three general travel modes: public transport, pri-vate transport by car, and pripri-vate ‘open air’ transport. We hypothesize that private transport by car is associated with the lowest risk of victimization because motivated offenders have almost no access to drivers and passengers inside closed private cars. Although victimization in pub-lic transport has received most attention in both scientific research (e.g., Smith and Clarke 2000) and public debate, it is actually hard to predict which of the other two travel modes is riskiest. On the one hand, public transport is in principle open to anyone, but in practice restricted to people who pay travel fares. Furthermore, in public transport there are usually guardians present who carry some responsibility for the safety of passengers, such as bus drivers, ticket inspectors, conductors, subway sta-tion attendants, and who may help prevent victimizasta-tion. The level of guardianship during private ‘open air’ trans-port, on the other hand, is generally lower as nobody but police is tasked with the safety of the traveler. However, people who use private ‘open air’ transport also tend to be exposed to much fewer people than those who travel by public transport, as public transport usually confines many people in relatively small spaces whereas open air transport does not. Because the result of the opposing forces of guardianship and potential offenders is uncer-tain, it would be pure speculation to predict which of the two travel modes is riskiest.
The empirical literature provides indirect evidence for the hypothesis that the risk of victimization is height-ened during travel. For example, research findings sug-gest that tourists are at a heightened risk of victimization
(Chesney-Lind and Lind 1986; de Albuquerque and
McElroy 1999), although it is acknowledged that their
heightened risk might be caused not by travel but by the risky behaviors that some tourists undertake or by their attractiveness as potentially wealthy crime targets (Boakye 2010).
Commuters—individuals who travel to and from work or school—are another mobile category. The victimi-zation rates of work commuters tend to be higher than those of others and to be correlated with average com-muting time (Messner et al. 2007; Moura and Neto 2015). The same holds true for children and adolescents who
travel to school (Burrow and Apel 2008; Deakin 2006;
Moore et al. 2011; Wiebe et al. 2013).
The literature is sparse on differentiation between travel modes, and public versus private transport is the main distinction made. In particular, users of public transport appear to suffer a heightened risk of victimi-zation (Levine and Wachs 1986a, b; Messner et al. 2007;
Smith and Clarke 2000; Smith and Cornish 2006; Tseloni
and Pease 2003, 2004). Furthermore, crime rates are
heightened around transit stations (Barnum et al. 2017;
Bernasco and Block 2011; Block and Davis 1996; Ceccato
and Uittenbogaard 2014; Haberman and Ratcliffe 2015;
Summers and Caballero 2017), although this does not
necessarily imply victimization of travelers. It may not even prove heightened risk, because crime rates in and around transit stations may be biased if their denomina-tors do not properly account for the large ambient popu-lation of traveling persons, especially during rush hours (Andresen 2006; Gerell 2018; Song et al. 2018).
The above findings, however, are not at all conclusive about the proximate causes of victimization. Neither heightened victimization risk of tourists and commuters nor crime concentrations around transit stations neces-sarily imply that victimization risk is heightened dur-ing travel. Such a conclusion is potentially subject to an aggregation fallacy as it is about situational risk (being victimized while traveling) but the empirical evidence applies to individuals (being a victim and being a trave-ler). A heightened victimization risk among frequent
travelers does not imply they are victimized while
trave-ling. If travelers differ from non-travelers on attributes related to victimization risk, these confounders invali-date any conclusions about the proximate causal relation between travel and victimization.
The strongest evidence that victimization risk is height-ened during travel comes from a study by Lemieux and
Felson (2012). The authors combined data from the
for the amount of time subgroups of the US population (based on gender, age, and ethnic background) spend on each of nine activity categories (estimated from the ATUS), they found that home activities (both sleeping and while awake) were the safest, as they had the low-est number of victimizations per hour spent. In contrast, going to and from school was associated with a much larger victimization risk than other activities. The sec-ond and third riskiest activities were commuting to or from work, and leisure activities away from home. These results were directly opposite to the conclusions when time use was not taken into account. Thus, overall more people were victimized at home than during school or work commutes, but per hour spent the reverse was true.
The study by Lemieux and Felson (2012) improves on
prior research about victimization risk during travel in three ways. First, it explicitly measured victimization during travel rather than victimization in general. Sec-ond, by controlling for the average time spent traveling in the US population, it used the appropriate denomi-nator for calculating average victimization risk. Third, it compared victimization during travel with victimization while performing other activities.
The study of Lemieux and Felson (2012) has its own
limitations though, which we address in the present study. First, in contrast to those used by Lemieux and
Felson (2012), our measures of activities and
victimiza-tion were reported by the same individuals. This frees us from the assumption that within broad demographic categories, victims do not systematically differ from non-victims, and allows us to use a rigorous fixed effects estimator based on within-person differences across
timeslots. Second, because Lemieux and Felson (2012)
combined two separate datasets on violent victimiza-tion and activities, their analysis was necessarily limited to establishing the bivariate relationship between activity type and violent victimization. Our survey participants reported per 10-min timeslot not only their activities, but also the presence of relatives and friends, and substance use. This allows us to rigorously test the hypotheses using a statistical model of victimization that accounts for other variables beyond activity type. Third, whereas in
the research of Lemieux and Felson (2012) travel
activ-ity was limited to travel to and from school or work (i.e. commuting), we include travel for all purposes, and dif-ferentiate between three broad travel mode categories: public transport, private transport by car, and private ‘open-air’ transport.
Data and methods
Smartphone time use and victimization survey app
In order to study situational correlates of victimization, we developed a dedicated time use and victimization
survey smartphone app Dagboek Activiteiten en Risico
[Activities and Risk Diary] for the iOS and Android platforms. The app was programmed by a company that had previously developed a similar time use survey app
(Sonck and Fernee 2013). The version we designed had
additional questions on victimization, on witnessing crime, and on substance use, and had greater differentia-tion on transport modes and on the categories of people present. The app confirms with the HETUS guidelines on
harmonized European time use surveys (Eurostat 2009)
in that it asks respondents to report about their activities in 10-min intervals, starts each response day at 4 a.m., and uses the overall HETUS activity categories (for more details on app design and how it follows HETUS
guide-lines, see Sonck and Fernee 2013). Although the app
could be installed by anyone, participation in our survey required a unique login code that was sent to respond-ents in the invitation to participate.
Sample and fieldwork
Because victimization is a rare event, few people would report any victimization during a standard time use sur-vey research period of 2 days, and unrealistically large samples of the general population would be required for a study like this. However, because victimization
rates decline with age (Statistics Netherlands 2016), we
decided to invite young adults to report about their time use and victimization experiences over a 4-day period. Our study design was approved by the Ethics Commit-tee for Legal and Criminological Research of the Vrije Universiteit Amsterdam. We invited a sample of 2675 participants of the ongoing Children of Immigrants Lon-gitudinal Survey in the Netherlands (Jaspers and Van
Tubergen 2015) panel study for which we had a valid
email address or postal address. The panel study had originally started with a random sample of children of immigrants and their native peers in the Netherlands at the age of around 14 in the year 2010.
and bounced emails we learned that 17 people never received the invitation. About 50% of the remaining 2658 participated in our study (N = 1334).
A complete fieldwork day yielded 144 unique records per respondent (24 h times six timeslots per hour). Given the demanding nature of the task, partial non-response was limited, as 75.5% of the respondents had at least one observation in each of the four fieldwork days, while the percentages were only 7.7% for 3 days, and 4.2 and 4.7% for 2 days and 1 day respectively. Many respondents were sent the reminder email and they thus received two addi-tional fieldwork days. Even though they were asked to fill out the time use and victimization survey for 4 days only, 5.3 and 2.7% of the respondents actually recorded some time use data for 5 and 6 fieldwork days respectively.
Situational variables
Because the aim of this study is to assess during which situations people are more likely to get victimized, all variables in the analysis apply not to the person but to the timeslot. Victimization was measured with four ques-tions: Was something that belongs to you vandalized? Was something that belongs to you stolen? Were you threatened? Were you hit, kicked or physically injured? These crime types were chosen based on three criteria. They had to be common forms of crime, the list of addi-tional questions had to be limited to four in order to fit within an already labor-intensive 4-day time use survey design, and the types of crime had not to be too sensitive because that would potentially lead to dropout. Respond-ents who reported victimization during a fieldwork day were asked to indicate during which timeslot they had been victimized. After the first two questions, they could also indicate that victimization had happened earlier but was only noticed afterwards. If this was the case, these victimizations were discarded, so that only victimization incidents during a specified timeslot were used in the analysis. In sum, 45 respondents (3.37% of all individu-als) reported at least one form of victimization during 78 distinct timeslots, including 30 vandalism incidents, 3 thefts, 24 cases of threat, and 30 assaults. These partially overlapping incidents were combined into a single binary
victimization variable. In terms of risk, the victimiza-tion rate is .67 victimizavictimiza-tions per 1000 person-hours (see Table 2).
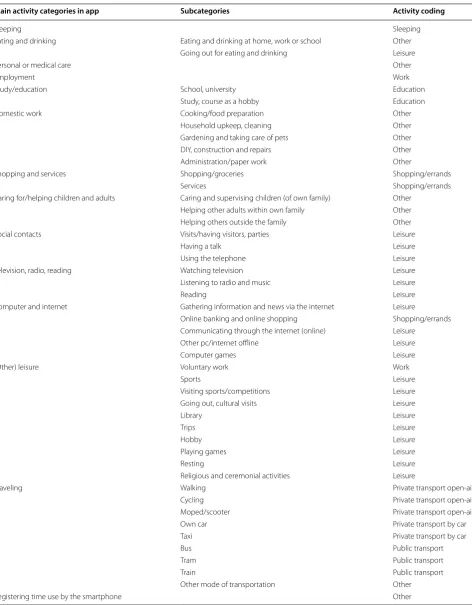
The smartphone app asked respondents to select one out of a list of 48 predefined categories of activities for each timeslot of a fieldwork day. Respondents could also select the Other activity category and define the activ-ity themselves. We coded all activities into the following nine mutually exclusive categories: Public transport, Pri-vate transport by car, PriPri-vate open-air transport, Work, Education, Shopping/errands, Leisure, Sleeping, and
Other activity. Table 1 presents the full list of activity cat-egories and the coding scheme. With regard to transpor-tation, some specific features of the Dutch transportation system should be emphasized. First, in comparison to most other countries in the world, bicycles are omnipres-ent and heavily used both in urban and rural environ-ments. Therefore, besides walking and riding a scooter, cycling is the main travel mode covered in the category “private open-air transport”. Second, public transpor-tation is well-developed and heavily used, with trains, trams and buses serving most of the country on a regular basis. Finally, and specifically relevant for the age group in the sample, the age at which people are allowed to drive a car without a coach is 18.
Respondents were also asked to indicate which other people were present in a situation. For each timeslot, they used tick boxes to select whether they were alone, with their partner, with children under the age of 10, with other household members, with friends/peers, or with someone else they knew. We used this information
to create three dichotomous variables. Friends present
scores 1 for all timeslots during which friends/peers were
present and 0 otherwise. Partner or household member
present scores 1 when either the respondent’s partner or a household member was present and 0 otherwise.
Children present scores 1 for all situations for which respondents indicated children were present and 0 other-wise. Note that these dummy variables are not mutually exclusive as different people could have been present in a situation.
Substance use was recorded by asking respondents whether they had used alcohol, cannabis or party drugs during a fieldwork day and if so, during which particu-lar timeslots. All time use measurements were also
cat-egorized into four 6-h intervals to capture the time of
day: 6 a.m.–noon, noon–6 p.m., 6 p.m.–midnight, and
midnight–6 a.m.
Methods
Table 1 Activity coding scheme
Main activity categories in app Subcategories Activity coding
Sleeping Sleeping
Eating and drinking Eating and drinking at home, work or school Other
Going out for eating and drinking Leisure
Personal or medical care Other
Employment Work
Study/education School, university Education
Study, course as a hobby Education
Domestic work Cooking/food preparation Other
Household upkeep, cleaning Other
Gardening and taking care of pets Other
DIY, construction and repairs Other
Administration/paper work Other
Shopping and services Shopping/groceries Shopping/errands
Services Shopping/errands
Caring for/helping children and adults Caring and supervising children (of own family) Other
Helping other adults within own family Other
Helping others outside the family Other
Social contacts Visits/having visitors, parties Leisure
Having a talk Leisure
Using the telephone Leisure
Television, radio, reading Watching television Leisure
Listening to radio and music Leisure
Reading Leisure
Computer and internet Gathering information and news via the internet Leisure
Online banking and online shopping Shopping/errands
Communicating through the internet (online) Leisure
Other pc/internet offline Leisure
Computer games Leisure
(Other) leisure Voluntary work Work
Sports Leisure
Visiting sports/competitions Leisure
Going out, cultural visits Leisure
Library Leisure
Trips Leisure
Hobby Leisure
Playing games Leisure
Resting Leisure
Religious and ceremonial activities Leisure
Traveling Walking Private transport open-air
Cycling Private transport open-air
Moped/scooter Private transport open-air
Own car Private transport by car
Taxi Private transport by car
Bus Public transport
Tram Public transport
Train Public transport
Other mode of transportation Other
model parameters from comparisons between observa-tions of the same person and observaobserva-tions of different persons, and which relies on the unjustified assump-tion that there are no relevant unobserved differences between individuals.
The limited number of victimizations and the very strong association between victimization and activity type created (quasi-)complete separation in the model. Therefore, we followed the approach of Averdijk and
Bernasco (2015) and estimated the model using a
penal-ized maximum likelihood estimation technique. Quasi-complete separation happens when a combination of independent variables perfectly predicts the outcome variable, which often happens when logit models are esti-mated with binary or nominal independent variables on small or sparse data sets. Standard maximum likelihood estimation techniques would yield infinite model param-eters and standard errors, whereas penalized maximum
likelihood estimation reduces this small sample bias and actually outperforms alternative methods of handling quasi-complete separation in logit models. Because the likelihood function of the fixed effects logit model is equivalent to that of the Cox proportional hazard model, we estimated our model with penalized likelihood
maxi-mization using the coxphf package (Heinze and Ploner
2016) developed for the statistical programming
lan-guage R (R Core Team 2017). Results are presented as
odds ratios (eb), which reflect the factor by which the
odds of victimization are deflated or inflated with a one-unit change in the independent variable controlling for all other covariates.
Results
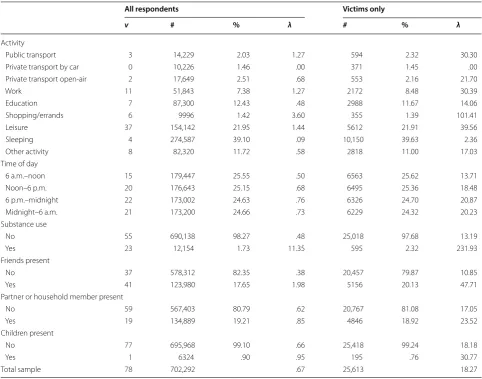
Before we turn to the statistical test of situational factors related to victimization risk, Table 2 displays the distri-bution of all independent situational variables as well as
Table 2 Bivariate relations between victimization and situational factors per 10-min timeslot
Absolute number of victimizations (v), number of 10-min timeslots (#), percentages (%), and number of victimizations per 1000 h (λ)
All respondents Victims only
v # % λ # % λ
Activity
Public transport 3 14,229 2.03 1.27 594 2.32 30.30
Private transport by car 0 10,226 1.46 .00 371 1.45 .00
Private transport open-air 2 17,649 2.51 .68 553 2.16 21.70
Work 11 51,843 7.38 1.27 2172 8.48 30.39
Education 7 87,300 12.43 .48 2988 11.67 14.06
Shopping/errands 6 9996 1.42 3.60 355 1.39 101.41
Leisure 37 154,142 21.95 1.44 5612 21.91 39.56
Sleeping 4 274,587 39.10 .09 10,150 39.63 2.36
Other activity 8 82,320 11.72 .58 2818 11.00 17.03
Time of day
6 a.m.–noon 15 179,447 25.55 .50 6563 25.62 13.71
Noon–6 p.m. 20 176,643 25.15 .68 6495 25.36 18.48
6 p.m.–midnight 22 173,002 24.63 .76 6326 24.70 20.87
Midnight–6 a.m. 21 173,200 24.66 .73 6229 24.32 20.23
Substance use
No 55 690,138 98.27 .48 25,018 97.68 13.19
Yes 23 12,154 1.73 11.35 595 2.32 231.93
Friends present
No 37 578,312 82.35 .38 20,457 79.87 10.85
Yes 41 123,980 17.65 1.98 5156 20.13 47.71
Partner or household member present
No 59 567,403 80.79 .62 20,767 81.08 17.05
Yes 19 134,889 19.21 .85 4846 18.92 23.52
Children present
No 77 695,968 99.10 .66 25,418 99.24 18.18
Yes 1 6324 .90 .95 195 .76 30.77
their relationships with victimization across all 10-min timeslots. The table includes a wealth of information that is too comprehensive to discuss in detail. To assist inter-pretation, we discuss the presence of friends as an exam-ple. The first column shows that we distinguish between situations with and without friends. The second
col-umn (v) shows that 41 victimization incidents occurred
in situations with friends and 37 in situations without
friends. The third and fourth column (# and %) show that
123,980 timeslots (17.65%) were spent with friends and 578,312 (82.35%) without friends. Using these figures, the expected number of victimizations for 1000 h spent (λ) with friends can be calculated by dividing the 41 victimi-zation incidents by 123,980 timeslots and subsequently multiplying that by 6 (the number of 10-min timeslots in an hour) and by 1000, which results in an average of 1.98 victimizations per 1000 h spent with friends, whereas the same calculation yields .38 victimizations per 1000 h spent without friends.
The rightmost three columns (#, % and λ) apply to vic-tims only. They show that vicvic-tims spent somewhat more time with friends (20.1%) than the average respondent (17.7%), and that their risk of victimization was larger (47.71 victimization per 1000 h spent) in the presence of friends than when these were absent (10.85 victimization per 1000 h spent). The bivariate relationships presented in Table 2 further show that the risk of victimization was relatively high in situations with substance use and when people traveled with public transport, or when they were at work, were engaged in shopping or errands, and were involved in leisure activities. Note that no victimization at all was reported during travel by car.
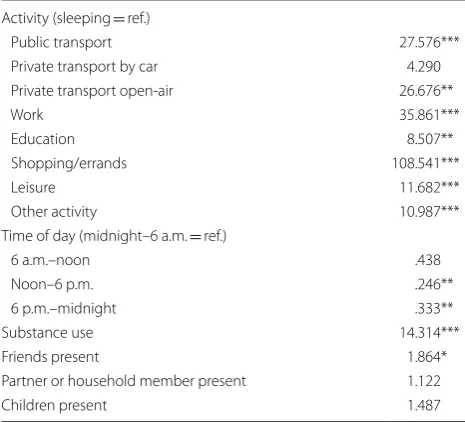
The results of the fixed effects logit model presented
in Table 3 show that sleeping (the reference category
with odds ratio fixed to 1) is the safest activity, as all other odds ratios are higher than 1. The risk of criminal victimization is indeed larger during travel than during sleep. However, all other activities also have a higher risk of victimization than sleeping. In fact, shopping is the riskiest activity (OR = 108.541; p < .001). Even though we
observed no victimization during private transport by car
(see Table 2), the penalized estimation technique
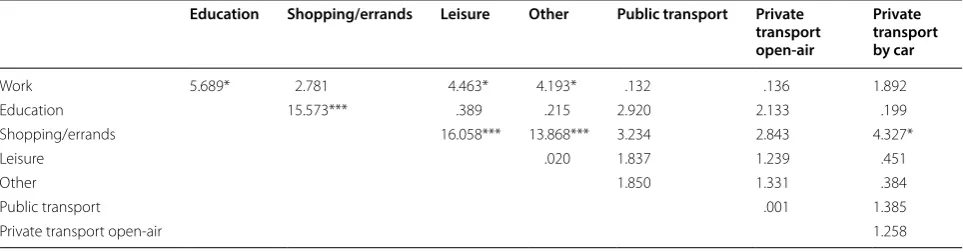
esti-mates the odds ratio to be 4.290, but the estimate is not statistically significant and thus we cannot conclude that the risk of criminal victimization is larger when traveling by car than while sleeping. However, victimization risk is significantly higher in private open-air (OR = 26.676; p < .001) and in public transport (OR = 27.576; p < .001) than during sleeping. Both modes of transport do not statistically differ in their respective risks of victimization (see Appendix A: Table 4). We also tested travel (by any mode of transportation) against all other activities, but the results revealed no statistically significant differences
in the likelihood of victimization. Thus, travel is only riskier than sleeping but not riskier than other activi-ties. People also run a relatively high risk of victimization while working (OR = 35.861; p < .001) and the next safest to sleeping turns out to be activities related to education (OR = 8.507; p < .01). Because Table 3 only presents ORs for activities tested against sleeping as reference category, Appendix A: Table 4 presents Wald Chi square tests to assess which effects differed statistically significantly. Working seems to be more risky than education-related, leisure and other activities; shopping/errands more than education-related, leisure, travel by private car and other activities.
The parameter estimates of the control variables in
Table 3 are also important. Substance use increases the
odds of victimization by a factor 14.3 (p < .001), whereas situations with friends are almost twice as risky as those without (OR = 1.864; p < .05). The riskiest time of day is between midnight and 6 a.m., and all other hours show reduced odds of victimization, although the effects are only statistically significant for noon to 6 p.m. (OR = .246; p < .01) and 6 p.m. to midnight (OR = .333; p < .01). The presence of partners or household members or children does not affect the risk of victimization.
Conclusion and discussion Summary
This study demonstrated that it is possible to use a cus-tom-made smartphone app to investigate situational
Table 3 Multivariate fixed effects (firth-type penalized likelihood) estimates of relation between victimization and situational elements (odds ratios)
* p < .05, ** p < .01, *** p < .001 (two-tailed)
Activity (sleeping = ref.)
Public transport 27.576***
Private transport by car 4.290
Private transport open-air 26.676**
Work 35.861***
Education 8.507**
Shopping/errands 108.541***
Leisure 11.682***
Other activity 10.987***
Time of day (midnight–6 a.m. = ref.)
6 a.m.–noon .438
Noon–6 p.m. .246**
6 p.m.–midnight .333**
Substance use 14.314***
Friends present 1.864*
Partner or household member present 1.122
causes of victimization. The research question addressed two propositions: (1) that victimization risk is elevated during travel, and (2) that travel mode further differenti-ates victimization risk. In contrast to prevailing claims in the literature, our results suggest that travel is not risk-ier than other activities, except for sleeping. We distin-guished between three modes of transport (private car, open air private, and public transport). Private open-air transport and public transport appeared to be equally risky, while transportation by private car seems to immu-nize against victimization. These conclusions should be considered tentative because of the relatively small sample size in combination with the rarity of experienc-ing victimization and the limitation of the observation period to just 4 days.
Practical implications
Based on our findings, concerns about elevated risk of victimization during travel seem premature. Public portation appears equally risky as private open-air trans-portation, and both activities are not riskier than other activities, such as working, learning, shopping or leisure.
While the findings are still tentative and not sufficiently robust to be practically applied, in the future, knowledge about situational causes of victimization may be used in apps that inform their users about the safety level of the situations they are about to enter. These tools may help people to be extra vigilant at the right time and place, and could even issue warnings in extremely risky situations. They could be used in a similar way as local weather fore-casting services, as an automated tool for obtaining use-ful information that could help people avoid unpleasant experiences.
Methodology for future research
Although our method of integrating victimization in an innovative time use survey app solves some limitations of prior approaches, the method is quite resource-inten-sive. To obtain reliable estimates of victimization risk in specific activities, large samples of respondents need to report their activities over prolonged periods of time. Given the demanding nature of the task, a substantive remuneration may be necessary to motivate their contin-ued participation. The space–time–budget (STB) instru-ment as developed by Wikström et al. (2012) also collects information on situational characteristics and crime, but does so per hour (rather than per 10 min), with a much longer recall period of at least 4 days, and through an even more resource-intensive face-to-face interview. Although the STB design has been used to study situ-ational explanations for victimization (Averdijk and
Bernasco 2015), most travel activities are relatively short and therefore underreported in the STB design.
If the main purpose of the research is calculating activ-ity based victimization risks for a handful of population subgroups, the approach taken by Lemieux and Felson (2012) is much more efficient, because it effectively com-bines existing large-scale data from time use and victimi-zation surveys, instruments that have been around for decades already.
If, however, the purpose is to develop and test a model for the proximate causes of victimization, a fine-grained measurement instrument like our smartphone survey app seems necessary. The main disadvantages of such a design are that it requires a considerable effort from the respondents and many of them do not experience any victimization during the study period and will thus be excluded from a within-person analysis. Although we do not know how retention rates would develop for longer study periods, having respondents report their activities and victimization experiences during 4 days seems about the limit of what can be asked of them even with a gen-erous remuneration scheme. With a random sample of people, the responses of most respondents will actually be useless for estimating within-person effects and much of the data collection thus wasted. This limitation can be overcome by starting from a sample of victims and using a time-matched control design to study how the actual victimization event differs from all situations leading up to the event (see Basta et al. 2010; Wiebe et al. 2013). However, such a design only works for very serious types of victimization (often with injuries), for which the hospi-tals could provide sample frames.
In our view, the most promising way forward is to fur-ther extend automated measurement. Currently, the app measures only time and location automatically without any user intervention. It has been demonstrated that travel mode can be automatically measured with good reliability (Bohte and Maat 2009), which means that users could be freed from answering any questions regard-ing their mobility. Furthermore, apps can also measure whether other devices are in close proximity by sensing their unique Bluetooth signatures, and thus derive the presence of people, and other social features of the
situ-ation (Eskes et al. 2016). In theory, such a design could
types. Although these and other measures require con-siderable privacy issues to be solved in advance, their implementation would move research into the direction of complete automation of time use measurement, and require respondents only to report about any victimiza-tion experiences every once in a while (e.g., once a week). Objective victimization risk may not be congruent with subjective safety experiences. Fear of crime may lower the comfort of travel and even keep people from trave-ling. In order to assess the extent to which objective and subjective safety align, future studies may include meas-ures of both at the situational level. A recent study shows that situational variation in subjective safety experiences can also be captured using an app similar to the one used in our study (Solymosi et al. 2015).
Limitations and caveats
The relatively small number of reported victimization situations (N = 78) in our data limits the conclusions that can be drawn from the analysis, in particular from the multivariate logit model in which we condition on no less than 15 variables. Only 45 of the 1334 respondents (3.4%) were a victim of any of the four types of crime measured during the study period. Because these numbers do not allow for further disaggregating the analysis, the find-ings presented in this study reflect average effects across the four types of crimes. Larger samples are needed for assessing whether the situational factors differentially affect the risk of particular types of victimization. Never-theless, it is worth emphasizing that the 78 victimizations reported by 1334 respondents over 4 days, imply that on average they suffer more than 5 victimizations of vandal-ism, theft, threat, and or assault annually. This estimate is far above the estimates in traditional victimization surveys, and may indicate that our instrument is more sensitive than traditional surveys, leading respondents to report some victimizations they would not report in traditional surveys.
The small absolute number of victimizations is also the reason why we did not explore possible interaction effects. It would be theoretically and practically relevant to know whether the effects of some factors are condi-tional on other factors. For example, traveling by public transport might be risky only when traveling alone and not when traveling in company. Certain activities might also be more risky at particular places or times of day, and in fact the smartphone survey app also included geotracking that in theory would allow us to reference the reported activities in space and assess whether situ-ational factors are actually spatially dependent. For exam-ple, according to crime pattern theory (Brantingham
et al. 2017), motivated offenders commit crimes at places they are familiar with. If potential victims travel to these places, they are more likely exposed to motivated offend-ers and thus run a higher risk of victimization. However, the number of victimizations in our data do not allow us to further disaggregate the sample. Larger samples would be needed to test how the interplay of situational factors and where and when they coexist affect victimization risk.
A limitation that our study shares with most other research on victimization is that the relevant theoreti-cal constructs that motivate hypotheses on victimization risk are only indirectly—and thus relatively poorly— measured. Our instrument neither measures individuals’ exposure to potential offenders nor the presence of capa-ble guardians. It measures the presence of other people in terms of their relation to the respondent (e.g., family members or friends) but not whether they are potential offenders or guardians, or maybe even both, depending the situation. Maybe shopping/errands comes out as the riskiest activity because it exposes people to relatively many motivated offenders without sufficient guardian-ship, but without a design that properly measures these constructs this remains speculation.
The finding that travel by car seems to make peo-ple immune to victimization while private open air and public transport are both characterized by a similar vic-timization risk, suggests that cars shield people from motivated offenders, which makes them safe havens. The physical protection a car provides seems to do more against victimization than the guardianship received from co-passengers, bus drivers, train personnel and other professionals in public transportation.
The nature of transportation is subject to continu-ous change as a function of environmental challenges (e.g., use of sustainable energy sources) and techno-logical developments (e.g., transportation by means of automated vehicles). In theorizing about the threats and opportunities of prospective developments in human mobility, effects on criminal victimization risk should be taken into account.
Authors’ contributions
The listed order of authors was decided by chance. Both authors read and approved the final manuscript.
Author details
1 Netherlands Institute for the Study of Crime and Law Enforcement (NSCR), PO Box 71304, 1008 BH Amsterdam, The Netherlands. 2 Department of Sociol-ogy, Utrecht University, Utrecht, The Netherlands. 3 Department of Spatial Economics, Vrije Universiteit Amsterdam, Amsterdam, The Netherlands.
Acknowledgements
We thank Frank van Tubergen and Eva Jaspers for allowing us to invite the respondents of their CILSNL panel study for participation in our smartphone survey.
Competing interests
The authors declare that they have no competing interests.
Availability of data and materials
Given the sensitive nature of the micro-level time-use and victimization survey data, the authors cannot share the used dataset.
Funding
Nederlandse Organisatie voor Wetenschappelijk Onderzoek (452–12–004).
Appendix A See Table 4
Table 4 Wald Chi square test for effect size differences
* p < .05, ** p < .01, *** p < .001 (one-tailed)
Education Shopping/errands Leisure Other Public transport Private transport open-air
Private transport by car
Work 5.689* 2.781 4.463* 4.193* .132 .136 1.892
Education 15.573*** .389 .215 2.920 2.133 .199
Shopping/errands 16.058*** 13.868*** 3.234 2.843 4.327*
Leisure .020 1.837 1.239 .451
Other 1.850 1.331 .384
Public transport .001 1.385
Publisher’s Note
Springer Nature remains neutral with regard to jurisdictional claims in pub-lished maps and institutional affiliations.
Received: 25 May 2018 Accepted: 31 August 2018
References
Andresen, M. A. (2006). Crime measures and the spatial analysis of crimi-nal activity. British Journal of Criminology,46(2), 258–285. https ://doi. org/10.1093/bjc/azi05 4.
Averdijk, M., & Bernasco, W. (2015). Testing the situational explanation of victimization among adolescents. Journal of Research in Crime and Delin-quency,52(2), 151–180. https ://doi.org/10.1177/00224 27814 54619 7. Barnum, J. D., Caplan, J. M., Kennedy, L. W., & Piza, E. L. (2017). The crime
kaleidoscope: A cross-jurisdictional analysis of place features and crime in three urban environments. Applied Geography,79, 203–211. https ://doi. org/10.1016/j.apgeo g.2016.12.011.
Basta, L. A., Richmond, T. S., & Wiebe, D. J. (2010). Neighborhoods, daily activi-ties, and measuring health risks experienced in urban environments. Social Science & Medicine, 71(11):1943–1950. https ://doi.org/10.1016/j. socsc imed.2010.09.008.
Bernasco, W., & Block, R. (2011). Robberies in Chicago: A Block-level analysis of the influence of crime generators. Crime Attractors and Offender Anchor Points Journal of Research in Crime and Delinquency,48(1), 33–57. https :// doi.org/10.1177/00224 27810 38413 5.
Block, R., & Davis, S. (1996). The environs of rapid transit stations: A focus for street crime or just another risky place? In R. V. Clarke (Ed.), Preventing mass transit crime (Vol. Clarke, pp. 237–257). Monsey: Criminal Justice Press.
Boakye, K. A. (2010). Studying tourists’ suitability as crime targets. Annals of Tourism Research,37(3), 727–743. https ://doi.org/10.1016/j.annal s.2010.01.002.
Bohte, W., & Maat, K. (2009). Deriving and validating trip purposes and travel modes for multi-day GPS-based travel surveys: A large-scale application in the Netherlands. Transportation Research Part C: Emerging Technologies, 17(3), 285–297. https ://doi.org/10.1016/j.trc.2008.11.004.
Brantingham, P. J., Brantingham, P. L., & Andresen, M. A. (2017). The geometry of crime and crime pattern theory. In R. Wortley & M. Townsley (Eds.), Environmental criminology and crime analysis (pp. 98–116). New York: Routledge.
Burrow, J. D., & Apel, R. (2008). Youth behavior, school structure, and student risk of victimization. Justice Quarterly,25(2), 349–380. https ://doi. org/10.1080/07418 82080 20251 81.
Ceccato, V., & Uittenbogaard, A. C. (2014). Space-time dynamics of crime in transport nodes. Annals of the Association of American Geographers,104(1), 131–150. https ://doi.org/10.1080/00045 608.2013.84615 0.
Chesney-Lind, M., & Lind, I. Y. (1986). Visitors as victims crimes against tour-ists in Hawaii. Annals of Tourism Research,13(2), 167–191. https ://doi. org/10.1016/0160-7383(86)90036 -8.
Cohen, L. E., & Felson, M. (1979). Social change and crime rate trends: A routine activity approach. American Sociological Review,44, 588–608.
de Albuquerque, K., & McElroy, J. (1999). Tourism and crime in the Caribbean. Annals of Tourism Research,26(4), 968–984. https ://doi.org/10.1016/S0160 -7383(99)00031 -6.
Deakin, J. (2006). Dangerous people, dangerous places: the nature and loca-tion of young people’s victimisaloca-tion and fear. Children and Society,20(5), 376–390. https ://doi.org/10.1111/j.1099-0860.2006.00011 .x.
Eskes, P., Spruit, M., Brinkkemper, S., Vorstman, J., & Kas, M. J. (2016). The sociability score: App-based social profiling from a healthcare perspec-tive. Computers in Human Behavior,59, 39–48. https ://doi.org/10.1016/j. chb.2016.01.024.
Eurostat. (2009). Harmonised European time use surveys (HETUS), Guidelines 2008 (Methodologies and Working papers). Luxembourg: Office for Official Publications of the European Communities.
Gerell, M. (2018). Bus stops and violence, are risky places really risky? European Journal on Criminal Policy and Research. https ://doi.org/10.1007/s1061 0-018-9382-5.
Haberman, C. P., & Ratcliffe, J. H. (2015). Testing for temporally differentiated relationships among potentially criminogenic places and census block street robbery counts. Criminology,53(3), 457–483.
Heinze, G., & Ploner, M. (2016). Coxphf: Cox Regression with Firth’s Penalized Likeli-hood. Version 1.12. Retrieved January 8, 2018, from https ://cran.r-proje ct.org/packa ge=coxph f.
Hindelang, M., Gottfredson, M. R., & Garafalo, J. (1978). Victims of personal crime: An empirical foundation for a theory of personal victimization. Cambridge: Ballinger.
Jaspers, E., & Van Tubergen, F. (2015). Children of Immigrants Longitudinal Survey in the Netherlands (CILSNL) - Wave 5. Reduced version v5.0.0. DANS. https :// doi.org/10.17026 /dans-x3j-bakt
Lemieux, A. M., & Felson, M. (2012). Risk of violent crime victimization during major daily activities. Violence and Victims,27(5), 635–655.
Levine, N., & Wachs, M. (1986a). Bus crime in Los Angeles: I—measuring the incidence. Transportation Research Part A: General,20(4), 273–284. Levine, N., & Wachs, M. (1986b). Bus crime in Los Angeles: II—victims and
pub-lic impact. Transportation research part A: general,20(4), 285–293. Messner, S. F., Lu, Z., Zhang, L., & Liu, J. (2007). Risks of criminal victimization in
contemporary Urban China: An application of lifestyle/routine activities theory. Justice Quarterly,24(3), 496–522. https ://doi.org/10.1080/07418 82070 14854 29.
Moore, S., Maclean, R., & Jefford, T. (2011). The ‘land in-between’: A comparative European study of the victimisation of young people travelling to and from school. Crime Prevention and Community Safety,13(4), 246–259. https ://doi.org/10.1057/cpcs.2011.12.
Moura, K., & Neto, R. S. (2015, 25–28 August 2015). Does a longer commuting time increases the probability of being victim of urban violence? The evidence from Brazilian Metropolitan Regions. Paper presented at the 55th European Regional Science Association Meeting, Lisbon, Portugal.
Myhre, M. L., & Rosso, F. (1996). Designing for security in Météor: A projected new métro line in Paris. In R. V. Clarke (Ed.), Preventing mass transit crime (pp. 199–216). Monsey: Willow Tree Press.
Newton, A., & Ceccato, V. (2015). Theoretical perspectives of safety and security in transit environments. In V. Ceccato & A. Newton (Eds.), Safety and security in transit environments; an interdisciplinary approach (pp. 23–36). New York: Palgrave Macmillan.
R Core Team. (2017). R: A language and environment for statistical computing. Vienna: Austria.
Reynald, D. M. (2010). Guardians on guardianship: Factors affecting the willingness to supervise, the ability to detect potential offenders, and the willingness to intervene. Journal of Research in Crime and Delinquency, 47(3), 358–390. https ://doi.org/10.1177/00224 27810 36590 4.
Smith, M. J., & Clarke, R. V. (2000). Crime and public transport. Crime and Justice, 27, 169–233. https ://doi.org/10.1086/65220 0.
Smith, M. J., & Cornish, D. B. (2006). Secure and tranquil travel: Preventing crime and disorder on public transport. Abingdon: Routledge.
Solymosi, R., Bowers, K., & Fujiyama, T. (2015). Mapping fear of crime as a context-dependent everyday experience that varies in space and time. Legal and Criminological Psychology,20(2), 193–211. https ://doi. org/10.1111/lcrp.12076 .
Sonck, N., & Fernee, H. (2013). Using smartphones in survey research: A multifunc-tional tool. The Hague: The Netherlands Institute for Social Research. Song, G., Liu, L., Bernasco, W., Xiao, L., Zhou, S., & Liao, W. (2018). Testing
indica-tors of risk populations for theft from the person across space and time: The significance of mobility and outdoor activity. Annals of the American Association of Geographers. https ://doi.org/10.1080/24694 452.2017.14145 80.
Statistics Netherlands. (2016). Veiligheidsmonitor 2015. Den Haag: Statistics Netherlands.
Summers, L., & Caballero, M. (2017). Spatial conjunctive analysis of (crime) case configurations: Using Monte Carlo methods for significance testing. Applied Geography,84, 55–63. https ://doi.org/10.1016/j.apgeo g.2017.05.002.
Tseloni, A., & Pease, K. (2003). Repeat personal victimization. ‘Boosts’ or ‘Flags’? British Journal of Criminology,43, 196–212.
Wiebe, D. J., Guo, W., Allison, P. D., Anderson, E., Richmond, T. S., & Branas, C. C. (2013). Fears of violence during morning travel to school. Journal of Adolescent Health,53(1), 54–61. https ://doi.org/10.1016/j.jadoh ealth .2013.01.023.