R E S E A R C H
Open Access
Exploring relationships between medical
college rankings and performance with big
data
A. Ravishankar Rao
1*and Daniel Clarke
2* Correspondence:raviraodr@gmail. com
1Gildart Haase School of Computer
Science and Engineering, Fairleigh Dickinson University, Teaneck, NJ, USA
Full list of author information is available at the end of the article
Abstract
Background:It is important to examine the cost-effectiveness of medical education. The public wants to know how government spending is being utilized to train doctors. There are very few studies that examine national data to understand the relationships between medical education and outcomes.
We used Big Data analytics with open health data to explore answers. We joined physician data and hospital total performance score data reported by Center for Medicare and Medicaid Services (CMS), containing information for nearly 600,000 practitioners and performance scores from three thousand hospitals in the United States. We combined this data medical college costs from the American Association of Medical Colleges and medical school rankings. We used Mullan’s social mission to compare medical schools. We also computed the correlation between the rankings of 4-year baccalaureate colleges in the US published by the Wall Street Journal, and the in-state tuition at these colleges in the Integrated Post-secondary Education System database.
Results:We found a statistically significant but negligible correlation (Spearman rank correlation−0.04,p-value < 0.0001) between the rank of a medical school and the total performance score of the hospitals that their graduates practiced in. We found a statistically significant and high correlation (Spearman rank correlation of−0.903,
p-value = 0.003) between the averaged rank of medical schools and average number of graduates produced by these schools associated with CMS hospitals. Similar results were obtained for the social mission score. In contrast, the correlation between the ranking of 4-year colleges and (a) their tuition was−0.34 and (b) their outcomes was−0.86 (p-value < 10−5).
Conclusions:Our results suggest that US medical education is robust and produces
satisfactory performance outcomes. Higher tuition is not correlated with higher ranks or better outcomes. Hence, the public needs to question what they are getting in return for higher tuition. We also suggest that it may be better to produce more graduates from existing medical schools than opening new schools.
Introduction and motivation
Given the high cost of healthcare in most countries, especially the USA, it is para-mount to quantify and measure health outcomes as this leads to improved care de-livery, cost reduction and efficiency [1]. This has led to large-scale data-driven approaches in health [2], with many government institutions worldwide embracing Open Data and transparency initiatives. In the US, the Center for Medicare and Medicaid Services (CMS) releases data continually about the physicians affiliated with CMS hospitals (https://data.medicare.gov/data/physician-compare) and the per-formance of CMS hospitals nationwide ( https://data.medicare.gov/data/hospital-compare) [3]. Rao et al. review many of the benefits provided by this open data movement for healthcare [4–10]. For instance, the California Public Employees’ Re-tirement System [11] reduced hip-replacement surgery costs for retirees by bench-marking these costs across hospitals.
One of the drivers of the high cost of healthcare in the US is the rapidly in-creasing cost of medical education. Hence, a significant amount of research has been devoted towards understanding the relation between cost, the types of med-ical schools and outcomes achieved by medmed-ical graduates [12–16].
Researchers have investigated different dimensions along which patient outcomes can be measured. Donaldson observes in [17][Foreword] that all interventions to treat pa-tients are being measured on two major dimensions consisting of effectiveness and effi-ciency. The dimension of effectiveness has received the most attention, whereas the dimension of efficiency deserves more examination in the current climate of cost con-tainment. Walsh [17][pg. 2] states that “Considering the cost of medical education, there is remarkably little known about its cost effectiveness. There is little known about how to calculate costs, about what constitutes costs or how to get maximal value for money. Up to now, there have been no books on this subject and precious few articles. Most of the articles that do exist are reviews that bemoan the lack of original research in this area. So, this is exciting territory.”
Medical education in the US was reshaped significantly by the Flexner Report [18], which recommended that scientific inquiry and discovery should point the way to the future in medical education. Currently, there are many innovations being introduced into medical education, including web-based learning resources and simulations. New discoveries in the learning sciences have prompted ques-tions about whether medical education needs to be changed [19]. Other import-ant issues include: Can we produce competent physicians more efficiently and effectively? How can we reorganize medical education to produce physicians who are able to achieve better healthcare outcomes for the American people? These are valid questions, and significant research is required to inform policy makers appropriately. The issues of cost and value become mainstream only after several research efforts are published [14].
makers. For instance, it is important to determine whether medical graduates are serving the needs of the population as a whole, and if they are able to stay true to their core social mission of serving the sick and needy.
A related question about medical resources concerns the pipeline that produces medical professionals in the US. The AAMC has estimated that there will be a shortage of at least 100,000 doctors by 2030 [21]. On the other hand, Goodman and Fisher [22] challenge the popular observation that there is a shortage of phy-sicians in the US. Important factors to consider include the distribution of physi-cians across regions that are underserved, and the variations in patient outcomes. Interestingly, having a larger supply of physicians does not imply improved patient outcomes. Furthermore, Medicare beneficiaries are just as satisfied with their care in high-supply regions as in low-supply regions. This raises the ques-tion of whether graduates of higher-ranked medical schools provide better patient outcomes than graduates of lower-ranked medical schools. This is one of the questions tackled in the current paper.
There are multiple challenges in defining and measuring outcomes in multiple fields, including education and healthcare. In the field of science education, it is difficult to define standardized measures of student performance [23]. Tracking student perform-ance across multiple years is also a challenge. In the field of medical education, Chen et al. [20] state that it is difficult to measure outcomes as trainees traverse diverse paths while obtaining training at multiple institutions. Multiple approaches will be required for outcome measurements. In the current paper, we offer a big-data analytics perspec-tive where multiple public datasets from the Center for Medicare and Medicaid Services (CMS) are joined with rankings data of medical schools.
A commonly used source to compare medical school rankings is the US News and World Report Rankings ( https://www.usnews.com/best-graduate-schools/top-medical-schools). However, researchers have developed alternate rankings. Mullan et al. [16] state that medical schools have a social mission to care for the population. They devel-oped a different ranking system by including measures for the number of underrepre-sented minorities in graduating medical classes, the percentage of medical graduates who practice primary care, and the number who work in areas with health professional shortages. This resulted in a composite measure, the social mission score, and was used to rank medical schools.
The goal of the current paper is to seek solutions to the following questions: 1) What is the relationship between the rank of medical schools and the outcomes achieved by medical graduates? (2) What is the relationship between the social mission rank of medical schools and the outcomes achieved by medical gradu-ates? (3) What are the relationships between rank, social mission rank and the costs of attending medical schools? We use a Big-data approach that offers an unprecedented look at measuring the performance of professionals in medical in-stitutions nationwide. We derived our data from public sources, including the Medicare Dataset [3, 4]. We applied correlation and linear regression analysis in order to examine the three questions stated above.
produced and whether this needs to be increased [24]. Patients and the interested public need to understand how government healthcare expenditure impacts public health and can play an important role by being vigilant about the options available to them. An increasing number of researchers are applying machine learning and advanced analytic techniques to analyze and interpret healthcare data [4, 10, 25,
26]. The free dissemination and availability of data analytics platforms such as the one we are building [8] will facilitate the exploration and interpretation of such healthcare datasets by patient advocacy groups and concerned citizens at large [5].
Related work
The medical education field aims to align education with outcomes [27]. Outcomes measurement becomes challenging once students begin medical practice. As Prys-towsky and Bordage [13] observe, “Often, data are impossible to obtain because they are either confidential or simply not recorded, or because the practice location is un-known. There are also many confounding variables in measuring patient outcomes.” The release of large amounts of data related to physicians and hospital performance scores [3, 4] based on patient outcomes provides an interesting opportunity to address these issues.
The cost of medical education is also a large concern. The article by Prystowsky and Bordage [13] written in 2001 noted that the zeitgeist at that time was cost containment, and that substantial variability existed in student tuition amongst US medical schools. This raised fundamental questions about factors driving the cost of medical education and whether outcomes could justify the cost. This would lead to better-informed policy decisions, geared towards maximizing efficiency and towards using the right priorities. Interestingly, the situation seems to have remained the same, as we appear to be no closer to cost containment or maximizing efficiency. However, our data collection, dis-semination and analytics capabilities have vastly improved over the past 15 years, and this demands a fresh examination of these issues from a data-driven perspective.
Thakore [12] notes that“There is an imperative to make postgraduate medical educa-tion cost-effective. However, this can only be achieved if we know what we are produ-cing and how much it currently costs to produce it.” This is a challenge that persists today across multiple nations. There are two important aspects to consider. The first concerns the definition of the appropriate variables to measure and collection of the necessary data. The second concerns the methodology that is used to perform the ana-lytics and whether it is easily repeatable and verifiable by multiple researchers. This is because new data will be created each year, and a self-sustaining mechanism is re-quired, which can refresh the results periodically. Evidence that contributes to an un-derstanding of cost-effectiveness can be gathered from many sources. We provide an open-data approach to shed light on this question, and illuminate the current debate about the value provided by medical education.
The data surrounding the relationship between procedure costs and outcomes is intriguing. A recent study by Tsugawa et al. [29] based on over 20,000 physi-cians found that higher physician spending is not associated with improved pa-tient outcomes.
Raghupathi and Raghupathi [30] show that many applications in healthcare meet the four accepted criteria to be worthy of being termed “big-data”, which are volume, vel-ocity, variety and veracity. They specifically mention the use of outcome data, including patient outcomes. Our current paper is primarily concerned with the aspects of vol-ume, variety and veracity. We present a framework that can analyze large public health-care datasets released by CMS [3, 4]. Precise calculations which support the characteristic of high“volume”in the big-data definition as applied to public healthcare data can be found in Rao and Clarke [7]. We use data from 895,431 unique healthcare practitioners in the US, which represents nearly 75% of the practicing workforce in many specialties. This is a remarkably high coverage for such a study (workforce assess-ments done with even 3% of the workforce are typically considered meaningful [31]). The characteristic of “variety” is also applicable to our work, as data from multiple sources, including federal agencies and private sector websites have to be integrated to answer specific research questions. The characteristic of “veracity” is important in our current paper, as missing and/or incorrect data may be present in these sources. Hence, we used different techniques including outlier detection to identify problems in the public healthcare datasets. For instance, the graduation years of a few providers in the CMS [3, 4] data were well beyond the life ex-pectancy of current providers. These had to be explicitly filtered out prior to our analysis. As pointed out by Raghupathi and Raghupathi [30], traditional data management techniques assume the data is clean. However, public health-care data does not meet this assumption, and we had to invest significant effort in cleaning the data before utilizing it. Researchers have estimated that data cleaning accounts for about 30–80% of the time and budget in commercial big data projects [32]. The quality of velocity [30] does not apply to the data in our paper as we are not considering streaming data sources.
Obtaining performance information in the medical field is challenging, as most public websites are not reliable. For instance, Rosenkratz [33] studied the availability and accuracy of price and performance information of radiology practices on public websites, and determined that performance information usu-ally presented is not of adequate clinical quality. Hence, we used data from a federal source, CMS, where more rigorous techniques are used for ensuring data quality.
Methods
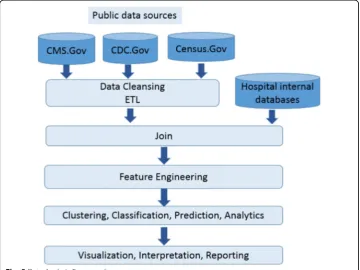
Our original data analysis framework [4], shown in Appendix: Fig. 5, consisted of the following steps: data cleansing/ETL, data joining, feature engineering, clustering classi-fication and prediction, visualization of results, interpretation and reporting.
Data from Medicare
We joined Medicare-provided data from CMS [3,4] residing in the following files.
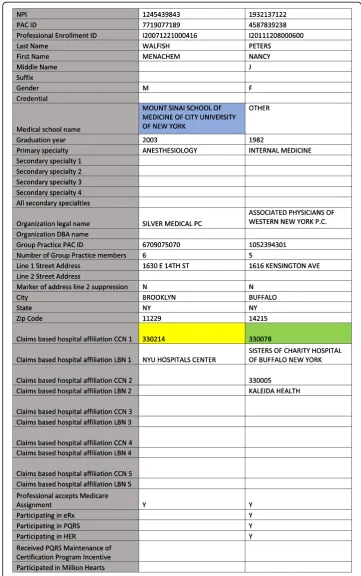
1. A file containing the hospital id and physician information:https://data.medicare. gov/Physician-Compare/National-Downloadable-File/s63f-csi6, henceforth referred to as“National-Downloadable-Physician-Compare”. Sample data are shown in Appendix: Fig.6.
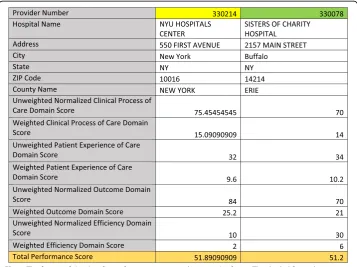
2. A file containing the hospital id and hospital performance metrics provided by the CMS addressing processes, outcomes and cost. A total performance score in the range 0–100 is provided by CMS, which was used in our analysis. Further details about these metrics can be found inhttp://www.medicare.gov/hospitalcompare/ data/total-performance-scores.html. Sample data are shown in Appendix: Fig.7.
The CMS office uses a standardized procedure [3, 4] to evaluate hospitals across the US, based on the generated outcomes for Medicare/Medicaid patients. Four do-mains are combined to produce the final “Total Performance Score” and consist of the following: (1) Clinical Care domain comprised of process and outcomes subdo-mains, (2) Patient-and Caregiver Centered Experience of Care/Care Coordination domain, (3) Safety Domain, and (4) Efficiency and Cost Reduction domain. The Clinical Care domain produces clinical process measures and measured mortality. The Patient-and Caregiver Centered Experience of Care/Care Coordination domain addresses patient surveys. The Safety domain covers patient safety measures, in-cluding measures of infections. The Efficiency and Cost Reduction domain utilizes a measure of the Medicare spending per beneficiary.
The CMS office computes a weighted average of these measures from the four do-mains. Though these measures are authoritative, as they are released by the Federal Government, they are constantly improved upon. For instance, a current shortcoming is that the information derived from patient surveys could be potentially biased. It is likely that patients with the best or worst experiences may be more likely to complete these surveys. Furthermore, some of the survey questions are prefixed with “Always”, which may make it hard for patients to choose an appropriate response. Hence, the val-idity of these performance measures continues to be actively researched and debated [34]. This analysis falls outside the scope of the current paper.
Press [35] showed that several factors need to be taken into account in defining per-formance measures, including whether a measure occurs prior to or during the care, and the application of appropriate risk adjustments. Kernisan [36] determined that there was no association between a hospital’s self-reported safe practices survey score and risk-adjusted patient mortality. Leonardi [37] compared different websites contain-ing hospital performance data, and found that the CMS Hospital Compare website was the most transparent in terms of explaining data sources and statistical methods that allow their exact results to be duplicated.
Medical school rankings and costs
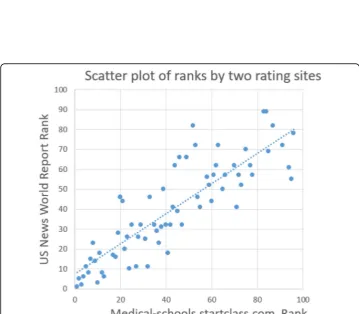
The CMS data contains the field“Medical school name.”We used two sources of rank-ing information about these medical schools. We first obtained a rankrank-ing of medical schools from http://medical-schools.startclass.com/. (Note that this website is unavail-able. However, as explained later, we have made this data available, and also compared it with rankings that are currently available, such as https://www.usnews.com/best-graduate-schools/top-medical-school). This ranking is based on each school’s statistics, such as mean GPA, average MCAT score, acceptance rate, faculty-student ratio, finan-cial aid and endowment per student. A sample of the rankings is provided in Appendix: Fig.8. We used this source as the ranks were easily downloadable as an Excel file. An alternate source of ranking is provided by US News and World Report athttps://www. usnews.com/best-graduate-schools/top-medical-schools. The rankings produced by these two sources are highly correlated, with a correlation value of 0.85 (p< 0.001, indi-cating that the result is statistically significant). A scatterplot of these two ranking sys-tems is shown in Appendix: Fig. 9. (We note that the site http://medical-schools. startclass.com has been withdrawn since this paper was prepared. The original data used in our analysis will be made available atwww.github.com/fdudataminingso others can replicate our results. Furthermore, the statistically significant and high correlation between the two ranking systems should provide similar inferences about the datasets we analyzed). The second source of ranking information we used was based on the So-cial Mission Score, developed by Mullan et al. [16], which includes factors such as the number of graduates practicing in underserved areas.
After joining these data sources, we can determine the medical school that a practi-tioner graduated from, two types of estimated medical school ranks, the hospitals asso-ciated with the practitioner, and the performance score received by that hospital from CMS. Our subsequent analysis was based on a collection of such entries over all the data provided by the CMS. We explored whether the composition of the practitioners in a hospital based on the caliber of the institutions they graduated from was related to a metric of hospital performance.
Finally, we obtained medical school costs from https://www.aamc.org/data/tuitio-nandstudentfees/[38].
Results
The CMS data represents 407 unique institutions from which 895,431 practitioners gradu-ated. We obtained 602,770 entries of the form shown in Appendix: Fig.9, consisting of practi-tioners associated with ranked medical schools. Note that the entries that were dropped either contained medical schools denoted by“OTHER”or medical schools that were not in the list of ranked medical schools. A reason for the occurrence of“OTHER”is that the health practitioner may have obtained a degree from a foreign medical institution. This constitutes a limitation of the data, and also illustrates the type of processing required to maintain “ ver-acity”, one of the four Vs of Big Data. This is a point raised by Raghupati and Raguhupati [30] where we go beyond traditional data management techniques which assume the data is clean.
Distribution of practitioners from medical schools with known rank
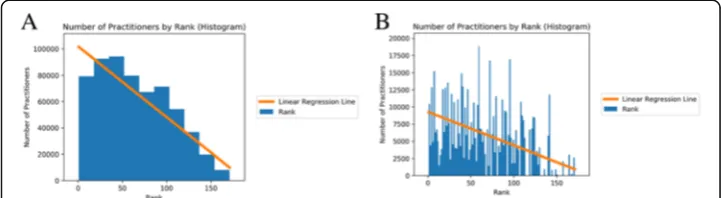
coefficient between the binned rank of a medical school and the number of practi-tioners shown in Fig. 1was−0.903 (p-value = 0.003). The Spearman Rank Correlation coefficient between the rank of a medical school and the number of practitioners shown in Fig.1b was−0.568 (p-value < 0.0001).
Relationship between the rank of a medical school and the performance scores of hospitals
A heatmap was used to explore the relationship between the rank of a given medical school and the performance scores of hospitals that graduates from this medical school practice in. The heatmap in Fig. 2a provides a nuanced view of the variation between these two dimensions. Let us denote the rank dimension by “r” and the performance score dimension by“s.” Each pixel or location in the heatmap, say H1(r, s) is addressed
Fig. 1aThis figure is a histogram of the number of practitioners in CMS hospitals according to the rank of the medical schools they graduated from. The rank of a medical school is shown on the x axis, whereas the y-axis shows the number of graduates from that medical school participating in hospitals in the CMS database. Ranks were binned in bins of size 10. The fit line using linear regression is expressed asN=−538R + 102,024 where N is the number of practitioners and R is the binned rank of a medical school. The goodness of fit metric, r-squared, is 0.86.bThis figure shows a histogram of the number of practitioners in CMS hospitals according to the rank of the medical schools they graduated from. No binning of ranks was performed. The fit line using linear regression is expressed asN=−49R + 9273 where N is the number of practitioners and R is the rank of a medical school (r-squared = 0.27)
by two coordinates: a rank “r” and a performance score “s.” Consider a rank say “r0” which represents a medical school, and a performance score say“s0.”We compute the total number of entries in our database that have rank “r0”and performance score“s0”. This number is color-coded and forms the color of the pixel at (r0, s0) in the heatmap. This way, we can observe the distribution of performance scores of hospitals that grad-uates from that school belong to.
The Spearman Rank correlation coefficient between the rank of a medical school and total performance score across the hospitals that its graduates practice in is −0.04 (p< 0.0001). Figure 2b shows the heatmap of the social mission rank versus total perform-ance score. The Spearman Rank correlation coefficient between the social mission rank of a medical school and total performance score across the hospitals that its graduates practice in is−0.044 (p< 0.0001).
Distribution of practitioners from medical schools across CMS hospitals
We explore the relationships between graduates of medical schools and the CMS hos-pitals they practice in.
Exploring the relationship between rank of a medical school and cost of attendance
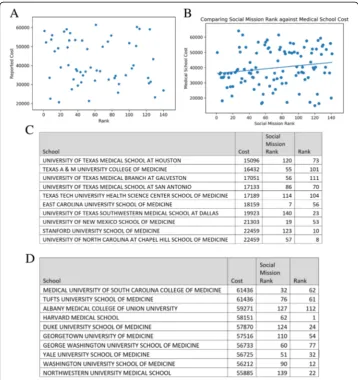
We downloaded data describing the cost of attending medical schools from https:// www.aamc.org/data/tuitionandstudentfees/ [38]. We joined this data with the medical school rankings obtained from http://medical-schools.startclass.com/. We used this joined data to explore the relationship between the rank of a medical school and the cost of attending that school. The data is presented in the form of a scatter plot in Fig.
4a. The Spearman Rank correlation coefficient between the rank of a school and the cost of attendance is −0.169, and thep-value is 0.21, which is greater than the typically used significance threshold of 0.05. Hence, there is no statistically significant relation-ship between these two variables.
However, Fig.4b shows that the social mission rank of a medical school has a statisti-cally significant correlation with the cost of attending medical school. The Spearman Rank correlation coefficient is 0.21,p-value = 0.03.
Figure 4c and d enumerate medical schools with the lowest and highest costs of attendance
Discussion
It is important for the public to make informed decisions both at the level of personal spending and at the level of societal spending. We adopted a Big Data approach by joining multiple large public datasets. Our framework and methods close the gap be-tween the availability of public healthcare data and our ability to extract meaning and value from this data. We have made our tools and techniques open-source [39], which should facilitate further analysis by the research community.
including the specific institutions that produce them, the ranking of these institutions and relationships between these factors.
Figure1examines the relationship between the number of practitioners in CMS hos-pitals from specific medical schools and the ranks of those schools. There is a statisti-cally significant and moderately high inverse correlation between these two variables. The fit of the regression line indicates that lower ranked schools (that lie towards the right on the x-axis) produce fewer graduates that practice in CMS hospitals. From a policy point of view, it is important to consider the overall impact that medical gradu-ates have, including their social mission [16] to serve public health needs. Hence, it may be advantageous to increase the number of graduates from existing well-ranked medical schools.
Clarke [43] observes that it is difficult to examine the effect of an institute’s ranking on the outcomes achieved by its graduates. The small amount of existing research fo-cuses on employment and earnings outcomes. In the area of business schools, the higher the rank, the higher the starting salary of their graduates. This is partly due to the fact that business schools have no licensing requirements that their graduates need to obtain. In contrast, medical school graduates need to be licensed.
Given the difficulty other researchers have faced in establishing relationships between the ranking of an institute and outcome, the research presented in the current paper offers an alternative approach where an outcome related to the quality of care provided is utilized. This is a novel method utilizing publicly available data to explore the rela-tionship between the rank of a medical college and the total hospital performance score achieved by its graduates. This outcome measure is indirect, as it does not directly measure the performance of an individual medical graduate, but measures the net effect of multiple medical graduates and hospital administration.
An inherent limitation in the data we use is that we are not able to consider the per-formance of physicians in private practice or non-CMS hospitals. This is inherited from the type of data that the US federal government wishes to make transparent, which cur-rently applies only to some aspects of the functioning of CMS hospitals.
The data in Fig. 2a indicates that the correlation between medical school rank and the performance score of hospitals their graduates practice in is statistically significant but low. A similar result is obtained in Fig. 2b for the social mission score. A possible explanation is that the standardization of medical education [44] and the medical li-censing examination sets a high bar for medical students. Passing this examination guarantees that a graduate will produce satisfactory patient outcomes. This is reassur-ing to the public, suggestreassur-ing that the medical education provided in the US is robust, and that the graduates are well poised to be successful. Our finding is consistent with the observations of Cooke et al. [19]. Unlike Flexner, Cooke et al. [19] did not find great disparities in the quality of education among the medical schools they visited. Two im-portant contributors were accrediting and licensing systems.
hospital mortality models for acute ischemic stroke patients. The hospital characteris-tics were measured by variables such as the number of beds, the regional location of the hospital and whether the hospital type was teaching or non-teaching. However, no metric related to the actual care providers, such as seniority or experience was cap-tured. At a higher organizational level, factors such as management structure and mo-tivation of the employees [48] could also play a role in outcomes, though this will be harder to measure.
In a broader context, studies have shown that many top employers hire very select-ively [49]. Interestingly, such analyses are being enabled with the current data revolu-tion, where detailed personal information is available. For instance, an analysis of LinkedIn data showed that Facebook and Google hire more than 80% of their em-ployees from the top 200 schools in the US [49]. Hence, one can argue that graduates of these highly ranked institutions provide high performance (or value) to the compan-ies that hire them, and this can be measured by outcomes such as the growth rate or market valuation of the company. However, such a case cannot be made for the hospi-tals based on the currently defined outcomes scores [3]. It may indicate either that there is no such easily determinable relationship, or that the outcomes scores are im-perfect. Several researchers have already suggested that better metrics are needed to compare hospitals [45, 46, 50]. Given that the outcomes score is currently fixed, it is likely that the ranking of the medical school that the physician graduates from is not af-fecting the currently used outcome score of the hospital.
Recent research by Tsugawa et al. [51] shows that there is little to no relationship be-tween the ranking of a medical school that a physician graduates from and the 30-day mortality or readmission rates of the patients treated by this physician. Our results are consistent with the results reported by Tsugawa et al. [51], which used more detailed data provided by the source doximity.com. However, this data source is available only to clinically licensed healthcare professionals, and some parts of the data may require fees. In contrast, we used data sources that are both free and open to the public, which enables easy and independent verification. Furthermore, an advantage of our approach is that our methodology can be repeatedly applied on new data as they are periodically released by agencies such as CMS on a quarterly or annual basis. We have also made the software environment freely available on github [39], which enables transparency and easy replication of our results. Furthermore, our current paper also discusses the relationship between the cost and ranking of medical schools, which is not present in other papers.
Our results are also consistent with the work of Reid et al. [52] who observed no sta-tistically significant associations between physician performance and physician charac-teristics such as allopathic vs. osteopathic degree, medical school rankings, or years of experience. Reid et al. [52] analyzed data for about 10,000 Massachusetts physicians and found that board certification was associated with high performance scores.
An example of the rank of a medical school affecting medical practice is provided by Schnell and Curie [54], who found that physicians who graduated from higher ranked medical schools wrote significantly fewer opioid prescriptions than physicians from lower ranked medical schools.
Our analysis of the relationship between medical college rank and the CMS hospital score could spur further research about defining appropriate quality metrics for med-ical care and outcomes.
We performed a related analysis [55] of the relationship between the seniority of pro-viders from the CMS database and the performance of the hospitals they practiced in. We determined a statistically significant but low correlation between seniority and hos-pital performance score, which suggests that the medical training obtained by the pro-viders positions them for long careers in healthcare. In this sense, the finding in Rao [55] is consistent with the finding of the current paper in that the standardization of medical education has worked well in the service of society.
van der Leeuw [56] performed a comprehensive review of existing studies to deter-mine the effect of residency training on patient outcomes, and found that patient care delivered by residents was safe and of equal quality. There is a tradeoff between the number of medical practitioners utilized in these studies and the detail at which out-comes are measured. The number of medical practitioners in studies cited by van der Leeuw [56] range from about a hundred [57] to about four thousand [58]. In contrast, the current paper utilized around 600,000 medical practitioners at a coarse level of out-come measurement. Our results are consistent with the findings of van der Leeuw [56], and may be viewed as a limit case when the sample size becomes very large. This is a novel result in the field of healthcare informatics.
A limitation of our result is that it is obtained at a coarse level, where an aggregate performance measure, the CMS hospital score is correlated against the medical college ranks of physicians at these hospitals. This is a consequence the granularity of the open data that we used.
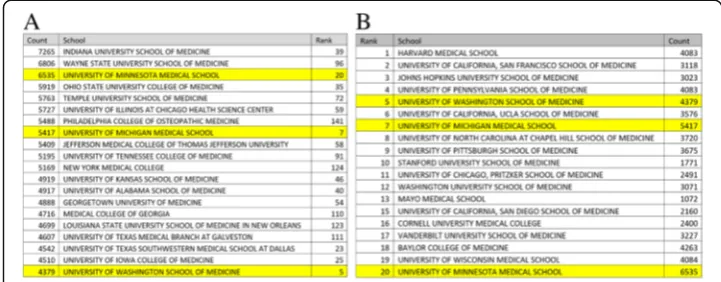
Figure 3 highlights three medical schools that are in the top 20 ranked schools and also produce the top 20 numbers of graduates practicing in CMS hospitals. This indicates that being highly ranked does not exclude a college from producing a large number of graduates who serve in CMS hospitals. From a policy stand-point, it may be interesting to examine the characteristics of the following three medical schools: the University of Washington Medical School, the University of Michigan Medical School and the University of Minnesota Medical School. There could be shared characteristics that other medical schools may want to emulate. Furthermore, from a national medical budget appropriation standpoint, it may make sense to allocate additional funds to highly ranked institutions that also sup-ply a sufficient number of graduates who work in CMS hospitals. The technique provided in our paper suggests a method to reward highly ranked medical schools that achieve a social mission.
The data in Fig.4a shows that there is no statistically significant relationship between the cost of attending a medical school and its rank. Furthermore, we observe from Fig.
the specific school he or she attends may not matter. Graduates from both higher-ranked and lower-ranked schools can achieve similar outcomes when they prac-tice at hospitals in the CMS database.
Figure 4 on the other hand shows that there is a statistically significant correl-ation between the social mission rank of a medical school and the cost of attend-ance of that school. The correlation has a low positive value of 0.21, which indicates that as the numerical social mission rank increases (i.e. the social mis-sion of the school decreases), the cost increases
Figure 4c and d compare the costs at the lowest ten and top ten schools sorted by cost of attendance, along with the social mission rank and traditional rank. These tables show that it is possible for schools to be well ranked in social mis-sion measures and traditional measures and still have a low cost of attendance. Furthermore, we note that several medical schools in the state of Texas have the lowest cost of attendance. Determining the shared characteristics of these schools should provide guidance to policy makers on factors governing cost-effective medical education
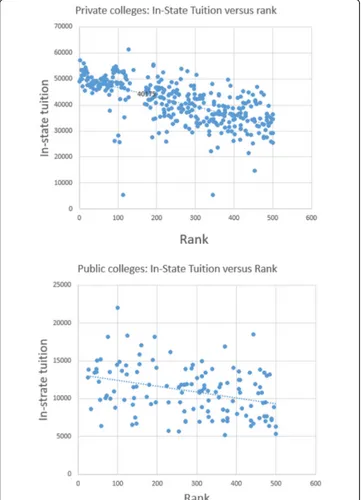
We note that private and public medical colleges vary greatly in their costs. Figure 4c show that there are several private colleges that cost more than $55,000 per year, whereas Fig. 4d shows several public colleges, notably in Texas that cost less than $18,000 per year. This is likely because tuition at public col-leges is subsidized by state funding. A recent article [59] examines some of the factors surrounding the low cost of attendance of Texas medical schools. Policy-makers were aware of the rapid growth of the state’s population, which created significant physician shortages. So the state invested in creating new medical schools and also capped the tuition at these schools. The majority of medical graduates from these schools stay in Texas. Our results in Fig. 4a show that the quality of the schools are not compromised, as many of them have respectable ranks.
Several research studies have shown a preference amongst physicians to locate in the same geographic area as their residency [20]. Chen at al. [20] measured the im-pact of residency programs on regional physician workforces. Their analysis ad-dressed some of the traditional difficulties in tracking the variable career paths of the trainees and the arrangements between training institutions. It follows that if it is desirable from a social mission viewpoint [16] to have more physicians practice in rural areas, then the graduate medical education (GME) program in the US should encourage exposure of residents to rural and underserved areas. Accord-ingly, there has been an examination of the accountability of GME starting as early as 1965 [60] and continuing through the current decade [61]. Greater transparency is a particular concern among the public [62]. Indeed, transparency is a central
theme of our paper, and we focus on the analytics in order to derive insights from data released through transparency efforts.
An emerging theme advocated by Shannon [63] is that more attention needs to be paid to osteopathic medical schools, as 60% of their graduates practice pri-mary care, and many are located in rural areas. The growing cost of medical edu-cation is turning many entrants away from aspiring to be primary care physicians. This raises challenges for students, the medical institutions and the entire health system [63]. Indeed, the cost of medical education is an important variable in the analysis of the current paper. However, translating these observa-tions into policy decisions remains challenging, and subject to contentious de-bates, as the recent Institute of Medicine report on GME illustrates [64].
In our analysis, we have focused on the cost of medical school and not elabo-rated on the role that GME plays in the training of physicians. The cost of GME is subsidized by support from Medicare and Medicaid and a review of its history can be found in [65]. Though the public is aware of the value of this subsidy [66], there is debate about its maintenance and continued expansion [64].
We contrast the results we have obtained for medical schools with similar cal-culations we carried out for colleges offering 4-year baccalaureate degrees in the US [67]. We obtained rankings of colleges from the Wall Street Journal (https:// www.wsj.com/graphics/college-rankings-2018-tool/). We obtained the in-state tu-ition to attend these colleges from IPEDS (Integrated Postsecondary Education Data System, https://nces.ed.gov/ipeds). The correlation between the rankings of the top 500 colleges and their in-state tuition is −0.34 (p-value < 10−5). This is a moderate and statistically significant correlation. The negative sign indicates that the higher the ranking, the more it costs to attend the institution, as the top-500 list contains about 380 private colleges and 120 public colleges. The Wall Street Journal rankings also includes a measure for the outcomes of each college, and is calculated based on graduation rates, the value added to graduate salary, loan de-faults and academic reputation. The correlation between the outcomes score and rank for the colleges as reported by the Wall Street Journal was −0.86 (p-value < 10−5). This is a high value, and indicates that better ranked colleges produce better outcomes. A detailed analysis of the methodology behind the Wall Street Journal rankings is outside the scope of this current article. An excerpt of our analysis is presented in the Appendix, Fig. 11.
This finding is interesting, as there is no such relationship for medical colleges, where higher costs are not correlated with either better ranks or better outcomes.
current paper shows that with some effort, it is possible to delve deeper, and inves-tigate important relationships between cost, reputation and outcome. This will help the public make better decisions, in terms of both choosing where and how to spend dollars as individual student consumers, and choosing how to spend dollars as a nation for medical education.
A limitation of this study is that it utilizes only open health data. Furthermore, the total performance score of a hospital is representative of the average performance of all the hospital employees, including healthcare professionals and hospital adminis-tration. This measure does not capture the performance of an individual practitioner.
As many governments continue to release data about the workings of the health-care system, we can expect the type of analysis we presented to become more popular. For instance, New York State, under the Statewide Planning and Coopera-tive Research System (SPARCS), has released data about specific outcomes achieved by cardiac surgeons [70]. Thus, we expect to see an improvement in the ability of the public to perform due diligence, verify the outcomes of government expendi-tures, and examine the routes for effective utilization of societal resources includ-ing capital and the workforce. This is not possible without access to the data as well as computational tools and algorithms to process the data. By making our tools and techniques open-source [39], we expect the barriers to perform this type of analysis to be lowered significantly.
Conclusion
Our paper highlights the use of Big Data analytics based on open healthcare data to explore relationships related to the cost of medical education, reputation of medical schools measured by rankings and outcomes. We found a statistically significant but negligible correlation between the rank of a medical school and the total performance score of the hospitals that their graduates practiced in. For the social mission rank, we obtained a similar result. These results suggest that US medical education is robust in terms of producing satisfactory performance out-comes of medical graduates. Higher tuition is not correlated with higher ranks or better outcomes. No statistically significant correlation was found between the rank of a medical school and the cost of attendance. There is a statistically significant but weak correlation between the social mission rank of a medical school and the cost of attendance. Hence, the public needs to question what they are getting in return for higher tuition.,
We found a statistically significant and high correlation between the averaged rank of medical schools and average number of graduates produced by these schools that are associated with CMS hospitals. This suggests that it may be better to add capacity to higher ranked medical schools that place graduates in CMS hospitals than open newer schools that may have a lower ranking. Several medical schools we have identified have lower cost, and produce acceptable outcomes. Further investigation should focus on common characteristics of these schools that can be replicated to improve the cost ef-fectiveness of medical education in the US.
Fig. 7The format of the data for performance scores is shown in this figure. The shaded first column shows the names of the fields. Two sample columns of data are shown next. Note that the provider number in the second column, 330,214 corresponding to NYU Hospitals Center, and highlighted in yellow, matches the provider number in the second column of Fig.6. Similarly the provider number in the third column, 330,078 for Sisters of Charity Hospital, and highlighted in green, is also present in Fig.6. These fields are used to join the tables. For our correlation analysis, we focus on the last row, containing the
“Total performance score”generated by CMS. There are 3089 unique hospitals represented in this file
contribute to make our methodology replicable and independently verifiable by re-searchers and concerned citizens. Our approach has the potential to transform the healthcare research landscape through data and code sharing. This could create a new model for conducting healthcare research.
Appendix
Acknowledgments None.
Funding
No funding was available for this study.
Availability of data and materials
Will be provided atwww.github.com/fdudatamining
Authors’contributions
The authors contributed equally to all parts of this study, including data gathering, analysis and writing.
Ethics approval and consent to participate Not applicable.
Consent for publication Not applicable.
Competing interests
The authors state that they have no competing interests.
Publisher’s Note
Springer Nature remains neutral with regard to jurisdictional claims in published maps and institutional affiliations.
Author details
1Gildart Haase School of Computer Science and Engineering, Fairleigh Dickinson University, Teaneck, NJ, USA.2Icahn
School of Medicine at Mount Sinai, New York, NY, USA.
Received: 9 May 2018 Accepted: 25 March 2019
References
1. Schwartz AL, Landon BE, Elshaug AG, Chernew ME, McWilliams JM. Measuring low-value care in Medicare. JAMA Intern Med. 2014;174:1067–76.
2. Schneeweiss S. Learning from big health care data. N Engl J Med. 2014;370:2161–3.
3. Medicare.gov.The Total Performance Score information. Available: https://www.medicare.gov/hospitalcompare/data/total-performance-scores.html. Accessed 11 Apr 2019.
4. Rao AR, Chhabra A, Das R, Ruhil V. A framework for analyzing publicly available healthcare data. In:2015 17th International Conference on E-health Networking, Application & Services (IEEE HealthCom); 2015. p. 653–6.
5. Rao AR, Clarke D. Hiding in plain sight: insights about health-care trends gained through open health data. J Technol Human Serv. 2018;36(1):48-55.
6. Rao AR, Clarke D. An open-source framework for the interactive exploration of big data: applications in understanding health care. In:IJCNN, International Joint Conference on Neural Networks; 2017. p. 1641–8.
7. Rao AR, Clarke D. Facilitating the Exploration of Open Health-Care Data Through BOAT: A Big Data Open Source Analytics Tool. In:Emerging Challenges in Business, Optimization, Technology, and Industry. Berlin: Springer; 2018. p. 93–115.
8. Rao AR, Clarke D. A fully integrated open-source toolkit for mining healthcare big-data: architecture and applications. In:
IEEE International Conference on Healthcare Informatics ICHI. Chicago: IEEE, Institute for Electrical and Electronics Engineers; 2016. p. 255–61. Available at IEEE Xplore Digital Libraryhttps://ieeexplore.ieee.org/Xplore/home.jsp. 9. Rao AR, Clarke D, Garai S, Dey S. A system for exploring big data: an iterative k-means searchlight for outlier detection
on open health data. In:IEEE IJCNN International Joint Conference on Neural Networks. Rio de Janeiro; 2018. 10. Rao AR, Clarke D. A comparison of models to predict medical procedure costs from open public healthcare data. In:
IEEE IJCNN International Joint Conference on Neural Networks. Rio de Janeiro; 2018. p. 5013–20.
11. A. Frakt, "How common procedures became 20 percent cheaper for many Californians,"The New York Times,2016. 12. Thakore H. Cost-effective postgraduate medical education. In:Cost Effectiveness in Medical Education; 2010. p. 14. 13. Prystowsky JB, Bordage G. An outcomes research perspective on medical education: the predominance of trainee
assessment and satisfaction. Med Educ. 2001;35:331–6.
15. Au AG, Padwal RS, Majumdar SR, McAlister FA. Patient outcomes in teaching versus nonteaching general internal medicine services: a systematic review and meta-analysis. Acad Med. 2014;89:517–23.
16. Mullan F, Chen C, Petterson S, Kolsky G, Spagnola M. The social mission of medical education: ranking the schools. Ann Intern Med. 2010;152:804–11.
17. Walsh K.Cost effectiveness in medical education. Berlin: Radcliffe publishing; 2010.
18. Flexner A. The Flexner report on medical education in the United States and Canada, vol. 58.New York:Carnegie Foundation; 1910.
19. Cooke M, Irby DM, O'Brien BC.Educating physicians: a call for reform of medical school and residencyvol. 16. Berlin: Wiley; 2010. 20. Chen C, Petterson S, Phillips RL, Mullan F, Bazemore A, O'Donnell MSD. Towards graduate medical education (GME)
accountability: measuring the outcomes of GME institutions. Acad Med. 2013;88:1267. 21. Mann S. Research shows shortage of more than 100,000 doctors by 2030. AAMC News; 2017. 22. Goodman DC, Fisher ES. Physician workforce crisis? Wrong diagnosis, wrong prescription.
N Engl J Med. 2008;358:1658–61.
23. Sinatra GM, Heddy BC, Lombardi D. The challenges of defining and measuring student engagement in science. Berlin: Taylor & Francis; 2015.
24. Kahn JM, Rubenfeld GD. The myth of the workforce crisis. Why the United States does not need more intensivist physicians. Am J Respir Crit Care Med. 2015;191:128–34.
25. Martínez-Torres MR, Diaz-Fernandez MDC. Current issues and research trends on open-source software communities. In:Technology Analysis & Strategic Management,vol. 26; 2014. p. 55–68.
26. DATAUSA. Available:https://datausa.io/about/
27. Harden RM. Outcome-based education: the future is today. Med Teach. 2007;29:625–9.
28. Walsh K, Levin H, Jaye P, Gazzard J. Cost analyses approaches in medical education: there are no simple solutions. Med Educ. 2013;47:962–8.
29. Tsugawa Y, Jha AK, Newhouse JP, Zaslavsky AM, Jena AB. Variation in physician spending and association with patient outcomes. JAMA Intern Med. 2017;177:675–82.
30. Raghupathi W, Raghupathi V. Big data analytics in healthcare: promise and potential. Health Inform Sc Syst. 2014;2:3. 31. Q. Hardy, "Technology workers are young (really young),"The New York Times,2013.
32. Saha B, Srivastava D. Data quality: The other face of big data. In:Data Engineering (ICDE), 2014 IEEE 30th International Conference on; 2014. p. 1294–7.
33. Rosenkrantz AB, Doshi AM. Public transparency web sites for radiology practices: prevalence of price, clinical quality, and service quality information. Clin Imaging. 2016;40:531–4.
34. Pronovost PJ, Lilford R. A road map for improving the performance of performance measures. Health Aff. 2011;30:569–73.
35. Press I. The measure of quality: LWW; 2004.
36. Kernisan LP, Lee SJ, Boscardin WJ, Landefeld CS, Dudley RA. Association between hospital-reported leapfrog safe practices scores and inpatient mortality. Jama. 2009;301:1341–8.
37. Leonardi MJ, McGory ML, Ko CY. Publicly available hospital comparison web sites: determination of useful, valid, and appropriate information for comparing surgical quality. Arch Surg. 2007;142:863–9.
38. (6/5/2017).https://www.aamc.org/data/tuitionandstudentfees/.
39. "github.com/fdudatamining/framework, Base Frame Work for Data Mining.".
40. Buchman TG, Coopersmith CM, Meissen HW, Grabenkort WR, Bakshi V, Hiddleson CA, et al. Innovative interdisciplinary strategies to address the intensivist shortage. Crit Care Med. 2017;45:298–304.
41. Kelley MA, Angus D, Chalfin DB, Crandall ED, Ingbar D, Johanson W, et al. The critical care crisis in the United States: a report from the profession. Chest J. 2004;125:1514–7.
42. Rubenfeld GD. COUNTERPOINT: does the United States need more intensivist physicians? No. CHEST J. 2016;149:625–8. 43. Clarke M. The impact of higher education rankings on student access, choice, and opportunity.
High Educ Eur. 2007;32:59–70.
44. Beck AH. The Flexner report and the standardization of American medical education. Jama. 2004;291:2139–40. 45. Salvatore G, Ishizaka A, Tasiou M, Torrisi G. On the methodological framework of composite indices: A review of the
issues of weighting, aggregation, and robustness. Social Indicators Res. 2019;141(2):61-94.
46. Lascano D, Finkelstein JB, Barlow LJ, Kabat D, RoyChoudhury A, Caso JR, et al. The correlation of media ranking's“best” hospitals and surgical outcomes following radical cystectomy for urothelial cancer. Urology. 2015;86:1104–14. 47. Fonarow GC, Pan W, Saver JL, Smith EE, Reeves MJ, Broderick JP, et al. Comparison of 30-day mortality models for
profiling hospital performance in acute ischemic stroke with vs without adjustment for stroke severity. Jama. 2012;308:257–64.
48. Burke WW, Litwin GH. A causal model of organizational performance and change. J Manag. 1992;18:523–45. 49. (2016) Which colleges do Facebook, Google and other top employers recruit from?Times Higher Education. Available:
https://www.timeshighereducation.com/student/news/which-colleges-do-facebook-google-and-other-top-employers-recruit
50. Couralet M, Guérin S, Le Vaillant M, Loirat P, Minvielle E. Constructing a composite quality score for the care of acute myocardial infarction patients at discharge: impact on hospital ranking. Med Care. 2011:569–76. 51. Tsugawa Y, Blumenthal DM, Jha AK, Orav EJ, Jena AB. Association between physician US News & World Report medical
school ranking and patient outcomes and costs of care: observational study. BMJ. 2018;362:k3640.
52. Reid RO, Friedberg MW, Adams JL, McGlynn EA, Mehrotra A. Associations between physician characteristics and quality of care. Arch Intern Med. 2010;170:1442–9.
53. Hartz AJ, Kuhn EM, Pulido J. Prestige of training programs and experience of bypass surgeons as factors in adjusted patient mortality rates. Med Care. 1999:93–103.
54. Schnell M, Currie J. Addressing the opioid epidemic: is there a role for physician education? Am J Health Econ. 2017:1–37.
56. van der Leeuw RM, Lombarts KM, Arah OA, Heineman MJ. A systematic review of the effects of residency training on patient outcomes. BMC Med. 2012;10:65.
57. Edelson DP, Litzinger B, Arora V, Walsh D, Kim S, Lauderdale DS, et al. Improving in-hospital cardiac arrest process and outcomes with performance debriefing. Arch Intern Med. 2008;168:1063–9.
58. Asch DA, Nicholson S, Srinivas S, Herrin J, Epstein AJ. Evaluating obstetrical residency programs using patient outcomes. Jama. 2009;302:1277–83.
59. M. Satyanarayana. (2017) Why becoming a doctor in Texas is a bargain.businessinsider.com. Available:https://www. businessinsider.com/why-becoming-a-doctor-in-texas-is-a-bargain-2017-10
60. Coggeshall LT.Planning for medical progress through education: a report submitted to the Executive Council of the Association of American Medical Colleges: Association of American medical colleges; 1965.
61. (Dec 16).Council on Graduate Medical Education. Advancing primary care.Available:https://www.hrsa.gov/ advisorycommittees/bhpradvisory/cogme/Reports/twentiethreport.pdf
62. (2010).Medicare Payment Advisory Commission. Report to the Congress: Aligning Incentives in Medicare.Available:http:// www.medpac.gov/docs/default-source/congressional-testimony/20100623_EandC_Testimony_
AligningIncentivesinMedicare.pdf?sfvrsn=0.
63. Shannon SC, Buser BR, Hahn MB, Crosby JB, Cymet T, Mintz JS, et al. A new pathway for medical education. Health Aff. 2013;32:1899–905.
64. Iglehart JK. Institute of Medicine report on GME—a call for reform. N Engl J Med. 2015;372:376–81.
65. Rich EC, Liebow M, Srinivasan M, Parish D, Wolliscroft JO, Fein O, et al. Medicare financing of graduate medical education. J Gen Intern Med. 2002;17:283–92.
66. Rampell C. How Medicare subsidizes doctor training. Berlin: New York Times; 2013.
67. Rao AR, Desai Y, Mishra K, "Data science education through education data: an end-to-end perspective", IEEE STEM Education Conference (ISEC) 2019, Princeton, 2019.
68. Vedder R, Strehle J. The Diminishing Returns of a College Degree. Wall Street J. 2017.
69. Belkin D. Exclusive test data: many colleges fail to improve critical-thinking skills. Wall Street J. 2017.