Detecting multiple associations in
genome-wide studies
Frank Dudbridge,
1* Arief Gusnanto
1and Bobby P.C. Koeleman
2 1MRC Biostatistics Unit, Cambridge, UK2Department of Medical Genetics, University Medical Centre Utrecht, Utrecht, The Netherlands
*Correspondence to: Tel:þ44 1223 330 300; Fax:þ44 1223 330 388; E-mail: [email protected]
Date received (in revised form): 3rd January 2006
Abstract
Recent developments in the statistical analysis of genome-wide studies are reviewed. Genome-wide analyses are becoming increasingly common in areas such as scans for disease-associated markers and gene expression profiling. The data generated by these studies present new problems for statistical analysis, owing to the large number of hypothesis tests, comparatively small sample size and modest number of true gene effects. In this review, strategies are described for optimising the genotyping cost by discarding promising genes at an earlier stage, saving resources for the genes that show a trend of association. In addition, there is a review of new methods of analysis that combine evidence across genes to increase sensitivity to multiple true associations in the presence of many non-associated genes. Some methods achieve this by including only the most significant results, whereas others model the overall distribution of results as a mixture of distributions from true and null effects. Because genes are correlated even when having no effect, permutation testing is often necessary to estimate the overall significance, but this can be very time consuming. Efficiency can be improved by fitting a parametric distribution to permutation replicates, which can be re-used in subsequent analyses. Methods are also available to generate random draws from the permutation distribution. The review also includes discussion of new error measures that give a more reasonable interpretation of genome-wide studies, together with improved sensitivity. The false discovery rate allows a controlled proportion of positive results to be false, while detecting more true positives; and the local false discovery rate and false-positive report probability give clarity on whether or not a statistically significant test represents a real discovery.
Keywords:genome scan, genetic association, multiple testing, permutation test, false discovery rate
Introduction
Recent technological advances allow the rapid generation of vast quantities of molecular biological data.1,2At the same
time, the sequencing of the human genome and subsequent efforts to catalogue the variation within it3have created
opportunities for testing thousands of sequence variations for association with disease, behavioural traits and physiological markers. Such applications are appealing because of the relative lack of success, to date, of positional cloning strategies that start with family-based linkage mapping,4 most likely due to
insufficient sample sizes to detect genes of modest effect.5
The whole-genome association scan is an increasingly feasible study design in which the genotyped markers are sufficiently closely spaced to detect linkage disequilibrium (LD) with all aetiological variants, and well-powered sample sizes are more attainable.6Some initial studies have been performed in
special populations7,8and in small samples of outbred
popu-lations;9,10 genome-wide admixture scans are imminent11,12
and, ultimately, routine scans will be performed for common diseases in large cohorts of outbred populations.13
Array experiments measuring large numbers of transcrip-tion or expression levels are another form of genome-wide analysis that have become widespread.14Although the effect
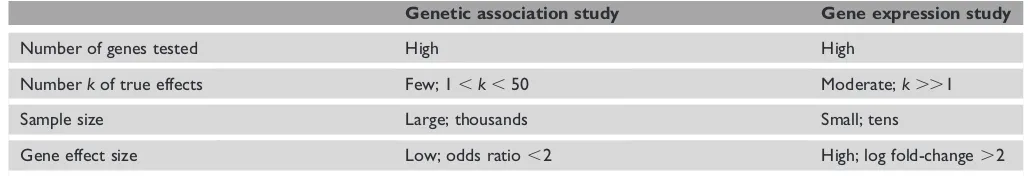
sizes expected in these studies are large by comparison with disease association studies, the sample sizes are constrained by cost to be relatively small, so that both types of study encounter problems of statistical power (Table 1). Expression levels can be regarded as quantitative traits under genetic control, so that both kinds of large-scale exploration can occur in genome scans for loci influencing expression levels,15
or phenome scans demarking the influence of genetic pathways.16,17
multiple testing is less serious. Furthermore, genome-wide analysis creates problems of computational and cost efficiencies on account of the large volume of data to be generated and analysed.
Here, some recent work addressing these problems is reviewed. For the study design, work is summarised that minimises the cost of a study, while maintaining its power. For the analysis, methods are reviewed for improving sensitivity in the presence of multiple gene effects, by combining evidence across tests, and some methods for reducing the computational burden of permutation tests are discussed. The review concludes with a discussion of alternative error measures including false discovery rates.
This review is mainly concerned with a whole-genome association scan, using single nucleotide polymorphisms (SNPs), for a dichotomous disease status. It will be clear, however, that many of the methods apply in other situations, in particular to array expression studies. Although there are important differences between these two applications — including the number of expected true associations, sample size and effect size (Table 1) — their common exploratory character suggests that further advances may arise from cross-application of ideas between these areas. For this reason, some methods developed for expression studies are reviewed; there is also a discussion on whether they may be suitable for genetic association scans. The objects of inference used will be ‘genes’18, with the understanding that, in this context, this can
mean SNPs, whole genes, haplotype blocks, transcript levels or other features.
Study design
Large samples of unrelated individuals have become the design of choice for genome-wide association scans, because earlier concerns about population stratification have been largely allayed by empirical methods.19Estimates of the total sample
size are in the order of thousands.20Because the majority
of genes are not associated with disease, it is uneconomical to genotype the whole sample for all genes. Sequential study designs, in particular a two-stage block design, have been proposed for reducing the total cost of a genome-wide experiment, which remains the main limiting factor prevent-ing large-scale application. In a two-stage design, all of the
genes are typed in a subset of the sample, with only the genes showing a trend of association being taken forward for geno-typing in the remainder. This directs resources towards true associations at an earlier stage, so that the available sample size is larger for genes with true effects.
The design parameters for a two-stage study include the total cost, total sample size, size of the first and second sub-samples and rejection criterion at the end of the first stage. Studies with only two stages are considered, although more could be performed. Some of these parameters are constrained in advance, with the others then chosen to optimise some objective. One approach is to consider the genotyping cost as fixed and then find parameters that give the most power.21,22A general rule of thumb, considering a
number of disease models and correlation structures between markers, is to allocate 75 per cent of resources to the first stage and then carry the most promising 10 per cent of markers to the second.22Here, the sample size is a function
of the genotype unit cost and the number of markers, within the overall cost constraint.
It is more likely that the sample size is fixed (say, to provide sufficient power to detect a single association) and the goal is to minimise costs while achieving power close to that of the one-stage design.23In many situations, the cost can be
halved while keeping power within 1 per cent of the one-stage design; thus, the total sample size can be calculated to achieve a certain power (say 81 per cent) in the one-stage design and parameters then optimised for a two-stage design. Considering a range of genetic models, a general guideline is to set the sample size of the first stage to have 97 per cent power for individual tests and carry forward all markers with nominal p-values less than 0.15. The sample size for the first stage cannot be calculated without knowledge of the true effects, however, so a more practical approach is to consider the ranks of test statistics of the true effects.24Here, it is shown that
similar information to the one-stage design is obtained by genotyping all markers on 50 per cent of the sample and then genotyping the 10 per cent most promising on the remainder, resulting in a decrease of about 45 per cent in the number of genotypes. Again, the total sample size can be calculated for a one-stage design; this last guideline is currently the most practical available and applies over a wide range of genetic models and correlation structures between markers.
Table 1. Determinants of power in genome-wide association and expression studies.
Genetic association study Gene expression study
Number of genes tested High High
Numberkof true effects Few; 1,k,50 Moderate;k..1
Sample size Large; thousands Small; tens
An application of this strategy has been reported in which the primary constraint is the quantity of DNA available for study subjects.25About 44 per cent of the sample had
sufficient DNA to be typed for all markers, with the
remaining 56 per cent used for the second stage. An important feature of this study is that the test statistics are calculated over the full sample, with adjustment made for the interim test. This is in contrast to the simpler approach used in the simulation studies,21,23in which test statistics were calculated
separately for the two stages and theirp-values combined into an overall significance. Analysing both stages at once25
makes more efficient use of information and will be the more powerful method for computing significance in the whole sample.
Formal sequential designs have also been proposed for genetic association studies.26These can result in substantial
cost savings, on average, but have yet to become widely adopted, owing mainly to logistical difficulties. For example, the stopping criteria must be applied to each gene separately, but genotypes are often obtained in bulk in array format, which makes it difficult to apply sequential designs efficiently across many genes. The two-stage designs are a compromise solution using frequentist inference, which also avoid the uncertainty in actual sample size that occurs with sequential inference. Future studies may introduce further design variables. For example, different genotyping technologies may be used in the two stages, with different unit costs, perhaps using DNA pooling.27Optimal study designs can be derived
for these conditions following current principles.
Analysis methods for multiple
associations
Many analysis methods are available for genetic data, but a first pass through a genome-wide scan may normally consist of single-locus tests for trend, perhaps additionally with two-locus interaction tests.28Several methods are now
available that exploit the important feature that the majority of tested genes are not associated, but there are a small number of true, but weak, associations to be found. These methods are useful both for establishing statistical significance more strongly than single-locus tests, and for informally suggesting sets of genes for follow-up study.
In the traditional hypothesis-testing framework, each gene is tested individually and then a stepwise adjustment procedure is applied both to control the family-wise type-1 error rate (FWER) and to declare individual genes associated.29This
approach, related to the Bonferroni correction, achieves strong control of the FWER, which is the probability of at least one false positive being within the desired rate when there are any number of true positives. This is generally considered to be too conservative for genome-wide studies, however, because we can tolerate a small number of false positives if
most true positives are detected. More preferable is weak control of FWER, which ensures that the probability of at least one false positive is within the desired rate only when there are no true positives. This is desirable, because we must defend against the possibility of there being no true associ-ations in the sample, but it allows us to tolerate some false positives if some true positives are present.
A joint test of multiple genes can maintain weak control of FWER and should reveal greater evidence for association from a set of genes, although perhaps with less specificity for individual genes. This argument motivates the partial sum statistics,30 which are formed by obtaining test statistics
(typi-cally x2 tests from a contingency table) for each individual
gene and then forming the sum of theKlargest statistics, whereKis a fixed number called thelength. The significance of the sum can be assessed by a permutation test and an overall significance estimated over a range of lengths.
A more flexible alternative to the sum statistic is the trun-cated product ofp-values. Here, the product is formed of all thep-values lower than a preset threshold,31or the Ksmallest
p-values.32 When the individual tests have the same
distri-bution, the rank truncated product has equivalent power to the sum statistic, but is more balanced when the tests have different distributions. This will occur, for example, when conducting haplotype-based tests on regions of different sizes, leading to tests with different degrees of freedom. Analytic distributions are known for independent tests, which have been used in simulation studies to show improved power for combined evidence methods compared with traditional corrections.31,32The present authors prefer the truncated
product to the sum statistic on account of its balanced com-bination of different test, and also prefer to truncate on rank rather than threshold because the number of true gene effects is fixed across studies, whereas theirp-values are random.32
The lengthKshould be close to the actual number of true associations, but this is generally unknown. A range of lengths could be tested, with the most significant length used to select genes for follow-up analysis; but there is no formal basis for this strategy, and simulation studies show that it is capable of grossly over- or under-estimating the number of true associ-ations.33A judicious choice of a fixed length, sayK,20 for a
genome-wide association scan, is generally advisable provided that the tests are reasonably independent. When there is strong dependency between tests, such as in single-marker analysis of a dense genome-wide scan, then the variable-length approach can be used to establish statistical significance, but not to estimate the number of follow-up genes. Informally, genes would be followed up in rank order of significance; and if the prior power is high, this will tend to identify the true associations.32 In fact, formal adjustments based on the
closure principle are available for individual tests, which allow strong control of FWER,34but the primary use of truncated
In working with the summary p-value rather than the complete data, some information is lost, and a single analysis of the data may be more efficient. A natural approach is to estimate all gene effects together in regression model. On the genome-wide scale, a fixed-effects regression is impractical, requiring estimation of many more parameters than there are observations. Therefore, several methods proposed for microarrays regard a gene as having a random effect, and model the distribution of gene effects by parametric forms that can be estimated. A simple model is to assume a normally distributed effect around zero,35although this may lack power
when most genes have no effect. The model can be extended by assuming that the effect variability comes from small and stronger effects, with inference based only on the stronger effects.36Another alternative is a mixture of a zero-centred
normal and a point mass at zero37or, more generally, a
mix-ture of three normals with respectively positive, zero and negative means.38Here, the zero-centred distribution is
regarded as the null distribution, which allows for small non-zero effects to be regarded as uninteresting if there is sufficient evidence for stronger effects.
These approaches reduce the dimensionality of the infer-ence while modelling the complete data, rather than sum-marising each gene before combining evidence. These methods offer promise for genome-wide association scans, an important open question being the precision in estimating the random effects distribution when the number and size of true associations are small. For example, a method for testing whether the overall distribution ofp-values is uniform39has
very little power compared with the Bonferroni correction when the number of true effects is small (authors’ unpublished data). Another important issue is the choice of random effects distribution: current methods assume hierarchical or mixture normal distributions, but experimental geneticists have favoured gamma distributions.40,41A useful feature of the
mixture distribution models is that they generate maximum-likelihood probabilities of membership to each of the mixture components, for each gene, which can be interpreted informally as posterior probabilities of association allowing individual genes to be selected for follow-up study.
Permutation testing
When the assumptions underlying analytical distributions are not met, permutation tests are a popular method for com-puting significance levels. In a genome-wide association study, the problem is that genotypes are correlated due to LD; indeed, the correlations are necessary for the design to be successful. The standard procedure is to reassign trait values among study subjects, while keeping their genotypes fixed, thereby preserving the correlation structure across the multiple genes and realising the exchangeability conditions for a valid test.42When performing thousands of tests on thousands of
subjects, however, a permutation procedure using thousands of replicates becomes extremely time-consuming, with possible running times of days or weeks. Therefore, more efficient approaches to permutation testing have recently been proposed.
The accuracy of the permutation test can be improved by noting that the minimump-value, sum statistic and truncated product can all be regarded as the extreme value of a large number of observations.33Therefore, they should follow the
extreme value distribution43and by fitting the parameters
of the distribution to the values observed in permutation replicates, more accurate significance levels are obtained. Equivalently, fewer replicates are needed to reach a given accuracy. The efficiency gain depends upon a number of factors, including the true significance level and the number of tests, and it is difficult to compute standard errors for the empirical p-values. Nevertheless, this approach has the advantage of being generally applicable and, importantly, the fitted distribution can be re-used in subsequent tests of the same genes in the same population. This will be useful for studies based on a standard genome-wide marker panel,3
leading to substantial time savings over the long term. A complementary approach is to reduce the computation within each replicate. Lin44 considered score statistics from
regression models, showing that it is sufficient to multiply the score contributions of each subject by a normal random deviate to generate a realisation from the null distribution. Alternatively, Seaman and Mu¨ller-Mysock45 suggest sampling
directly from the multivariate distribution for all the genes. The distribution can be estimated by considering the score test from a regression model that includes all the genes as predic-tors. This estimation may be difficult when the number of genes exceeds the number of subjects for which the procedure may need to be applied piecewise to subsets of genes. The approach of Lin also requires the sample size to exceed the number of genes, but preliminary results suggest that it would be more robust than that of Seaman and Mu¨ller-Mysock when applied across the whole genome.44Both of these approaches
require the analysis to be expressed as a score statistic from a regression model, which can be done in most situations but may require additional work by the user. Currently, Lin’s method seems better suited to genome-wide analysis, whereas that of Seaman and Mu¨ller-Mysock is more applicable and efficient in smaller-scale candidate gene studies.46
A further approach is to assume that the sampled markers are representative of an ‘effective number’ of independent tests.47 – 50After estimating this number — for example, from
the singular-valued decomposition of the genotype correlation matrix50— asymptotic formulae can be applied. There is
no formal basis for this approach, however, and studies based on real data indicate that the results are not always accurate;51
indeed, there may be no such effective number after all.33
False discovery rates
Another perspective on the multiple testing problem is that the family-wise error rate is not the most appropriate measure, and that other measures should be used that have better sensitivity and specificity in genome-wide studies. Although weak control of FWER for the overall significance has been advocated, some error control for the single tests is also desirable. Here, two prominent alternatives are discussed: false discovery rates (FDRs)52,53and posterior error rates.54,55
The original FDR by Benjamini and Hochberg52is the
expected proportion of false positives among all positive results, with the proportion defined as zero if there are no positives. That is, ifRis the number of positive results in a study andVis the number of these that are false — that is, do not arise from true gene effects — then:
FDR¼EðV=RjR.0ÞPrðR.0Þ:
Subsequently, Storey and colleagues53,56have argued that
the choice of the appropriate rate depends on how many positive results there are, and, furthermore, that the rate is only meaningful when there is at least one positive. This motivates the positive FDR (pFDR), defined as the expected proportion of false positives among all positive results, conditional on at least one positive at a given significance level:56
pFDR¼EðV=RjR.0Þ:
Rather than setting a fixed pFDR rate to control, Storey and colleagues suggest giving a value to each test that indicates what pFDR would result from declaring that test significant. The follow-up tests can then be chosen based on joint con-sideration of the number of tests selected and the pFDR associated with them. Formally, theq-value associated with an individual test is defined as the minimum pFDR achieved when declaring all tests significant at the level of the test’sp -value. Aq-value can be estimated for each test in a genome-wide experiment and follow-up tests selected from those with the lowestq-values. This last stage is somewhat informal and may be driven by logistic and financial constraints.
A difficulty with FDR methods is that they control an expected proportion, whereas an investigator will be more concerned with the actual proportion of false positives within a study. Some insight is gained by considering the variation in within-study false discovery proportion or false discovery variance. Let i be an integer with p(i) the i-th
smallest p-value from a set of m tests. If the i most signifi-cant tests are declared positive, then mp(i) estimates the
maximum number of false positives. The associated variance is mp(i)(12p(i)) (because the truth of a positive test is a
binomial outcome) and the coefficient of variation is ffiffiffiffiffiffiffiffiffi12pðiÞ
pðiÞ
q
for the within-study false discovery proportion. This is greatest whenp(i) is small, so, for a fixed set of p-values, this
coefficient of variation is greatest when the fewest tests are
declared significant. This will occur when a low error rate is set, or when there are few true associations, or when the power is low. In genome-wide association scans, the number of true associations is expected to be small by comparison with the number of tests, so that the false discovery variance is relatively high in relation to the target rate, and the FDR approach may not be reliable for controlling the error rate within studies. In gene expression exper-iments, however, the number of true associations is somewhat higher and FDR methods are more appropriate for those studies.
Kornet al. study the within-study proportion of false discoveries and give procedures that keep the number (or proportion) of false discoveries within an upper bound with given probability.57The attraction of this approach is that
one can limit the number of false positives with reasonable confidence, with the main disadvantage being increased computation. It is uncertain how the false discovery
proportion behaves when it falls outside the upper bound and, although this approach is attractive, further operating
characteristics may be needed before it becomes more widely used.
A further difficulty with FDR is that it says little about the individual tests. The most significant tests are most likely to be the true positives, but FDR andq-values ignore this in favour of averaging the error rate across all significant tests. Efron and colleagues58,59 propose the local FDR as the
posterior probability that a null hypothesis is true, given an observed statistic. The local FDR is calculated as
p0f0ðTÞ
p0f0ðTÞ þ ð12p0Þf1ðTÞ;
where p0 is the prior probability that the null hypothesis is
true, T is a test statistic and f0 and f1 are the probability
densities of Tunder the null and alternative hypotheses, respectively. p0 and f1 may be unknown but could be
esti-mated from the data.58,60,61 Note, however, that when the
true value ofp0 is near one, as is likely in disease association
scans, empirical estimates of p0 may be greater than one,
which leads to a downward bias if these estimates are truncated at one. Thus, it is better to fix a prior estimate of
p0 from genomic considerations such as the number
of expected disease genes (O(101)) and the number of genes
in the genome (O(104)).62
ones, or if additional sources of evidence, such as biological plausibility, are taken into account, together with the statistical association.
A related quantity is the false-positive report probability (FPRP).55,63This is the posterior probability that a null
hypothesis is true, given a statistic at least as extreme as that observed. It is calculated as
p0F0ðTÞ
p0F0ðTÞ þ ð12p0ÞF1ðTÞ
where nowF0and F1 are the cumulative distributions. For
known p0and F1 and large number of multiple tests, the
FPRP is the same as theq-value,56the main difference being
one of context. FPRP is intended to be applied across multiple studies and calculated from prior models, whereasq-values are motivated by the within-study FDR and are usually estimated from data. FPRP is also mathematically complementary to the positive predictive value of a discriminant,64again differing in
context. Because FPRP is a property of a range of test stat-istics, it is appropriate for setting guidelines for the reporting of significant results, based on assumed models forp0andF1.
This means that results can continue to be reported according to theirp-values, but with modified thresholds of significance. A known proportion of reported results will then be false; however, for assessment of specific tests for follow-up, the local FDR is more relevant to investigators.
Posterior error rates such as local FDR and FPRP are gaining support because informed proposals can now be made for the prior probability of the null being true, based on genomic considerations.55,62Which of the various measures to
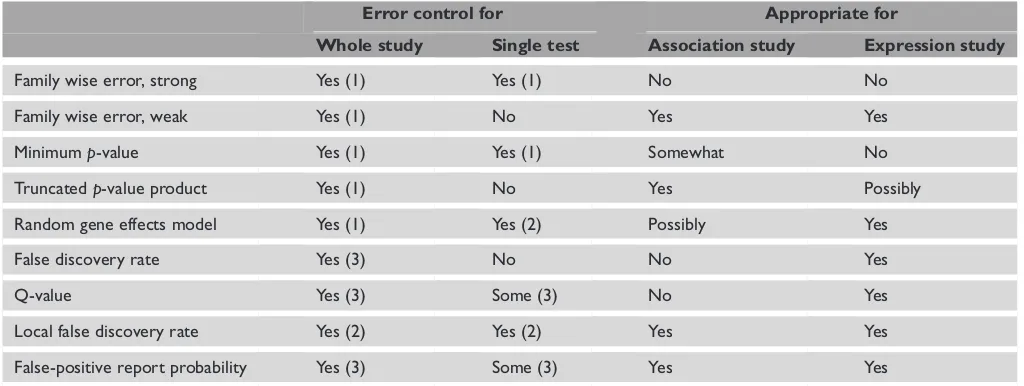
use depends on the context. Some of the determining factors are summarised in Table 2.
Concluding remarks
Several aspects of the analysis of genome-wide studies have been discussed, including study design, analysis method and error control, all of which bear on the likelihood of successfully identifying gene effects. There are some key aspects that have not been considered here, including selection and grouping of markers to be tested, population choice and data quality control. To some extent, these issues are specific to the type of study; this review has focused on the more general statistical issues that apply to most studies.
The field will continue to develop rapidly as more studies are completed and there is much scope for new methodology. In particular, combinations of the current methods may prove to be fruitful — for example, including combined evidence tests within a two-stage design. There is no best method for all studies, because of their differing properties and aims, but this review has identified some of the questions that should guide the choice of analysis method. Another important area for development, which has not been discussed here, will be the incorporation of evidence from several sources, including association studies, gene ontology annotation, information from model organisms and structural bio-informatics, to give a holistic appraisal of the effects of genetic variation.
Table 2. Comparison of different error rates and analysis methods. ‘Error control’ indicates whether a method provides some measure of error: (1) type-I error; (2) posterior probability of association; (3) expected proportion of false discoveries in a series of tests. ‘Appro-priate for’ indicates whether, in the view of the authors, a method is suitable for genome-wide association or expression studies, based on the factors in Table 1.
Error control for Appropriate for
Whole study Single test Association study Expression study
Family wise error, strong Yes (1) Yes (1) No No
Family wise error, weak Yes (1) No Yes Yes
Minimump-value Yes (1) Yes (1) Somewhat No
Truncatedp-value product Yes (1) No Yes Possibly
Random gene effects model Yes (1) Yes (2) Possibly Yes
False discovery rate Yes (3) No No Yes
Q-value Yes (3) Some (3) No Yes
Local false discovery rate Yes (2) Yes (2) Yes Yes
Acknowledgments
F.D. and A.G. are supported by the EU Bloodomics project (LSHM-CT-2004-503485). B.P.C.K. is supported by the Dutch Diabetes Research Foundation, the Netherlands Organisation for Health Research and Development and the Juvenile Diabetes Research Foundation International (2001.10.004).
References
1. Syvanen, A.C. (2005), ‘Toward genome-wide SNP genotyping’,Nat.
Genet.Vol. 37, pp. S5–S10.
2. Lockhart, D.J. and Winzeler, E.A. (2000), ‘Genomics, gene expression
and DNA arrays’,NatureVol. 405, pp. 827–836.
3. International HapMap Consortium (2003), ‘The International HapMap
Project’,NatureVol. 426, pp. 789–796.
4. Glazier, A.M., Nadeau, J.H. and Aitman, T. (2002), ‘Finding genes that
underlie complex traits’,ScienceVol. 298, pp. 2345–2349.
5. Boehnke, M. (1994), ‘Limits of resolution of genetic linkage studies:
Implications for the positional cloning of human disease genes’,Am.
J. Hum. Genet.Vol. 55, pp. 379–390.
6. Risch, N.J. (2000), ‘Searching for genetic determinants in the new
millennium’,NatureVol. 405, pp. 847–856.
7. Ophoff, R.A., Escamilla, M.A., Service, S.K.et al.(2002), ‘Genomewide
linkage disequilibrium mapping of severe bipolar disorder in a population
isolate’,Am. J. Hum. Genet.Vol. 71, pp. 565–574.
8. Ozaki, K., Ohnishi, Y., Iida, A.et al.(2002), ‘Functional SNPs in
the lymphotoxin-alpha gene that are associated with susceptibility to
myocardial infarction’,Nat. Genet.Vol. 32, pp. 650–654.
9. Klein, R.J., Zeiss, C., Chew, E.Y.et al.(2005), ‘Complement factor H
polymorphism in age-related macular degeneration’,ScienceVol. 308,
pp. 385–389.
10. Hu, N., Wang, C., Hu, Y.et al.(2005), ‘Genome-wide association study
in esophageal cancer using GeneChip mapping 10K array’,Cancer Res.
Vol. 65, pp. 2542–2546.
11. Halder, I. and Shriver, M.D. (2003), ‘Measuring and using admixture
to study the genetics of complex diseases’,Hum. Genomics Vol. 1,
pp. 52–62.
12. Patterson, N., Hattangadi, N., Lane, B.et al.(2004), ‘Methods for
high-density admixture mapping of disease genes’,Am. J. Hum. Genet.Vol. 74,
pp. 979–1000.
13. Austin, M.A., Harding, S. and McElroy, C. (2003), ‘Genebanks: A
comparison of eight proposed international genetic databases’,Community
Genet.Vol. 6, pp. 37–45.
14. Heller, M.J. (2002), ‘DNA microarray technology: Devices, systems, and
applications’,Annu. Rev. Biomed. Eng.Vol. 4, pp. 129–153.
15. Schadt, E.E., Monks, S.A., Drake, T.A.et al.(2003), ‘Genetics of gene
expression surveyed in maize, mouse and man’,NatureVol. 422,
pp. 297–302.
16. Freimer, N. and Sabatti, C. (2003), ‘The human phenome project’,
Nat. Genet.Vol. 34, pp. 15–21.
17. Weiss, K.M. and Terwilliger, J.D. (2000), ‘How many diseases does it
take to map a gene with SNPs?’,Nat. Genet.Vol. 26, pp. 151–157.
18. Neale, B.M. and Sham, P.C. (2004), ‘The future of association studies:
Gene-based analysis and replication’,Am. J. Hum. Genet.Vol. 75,
pp. 353–362.
19. Cardon, L.R. and Palmer, L.J. (2003), ‘Population stratification and
spurious allelic association’,LancetVol. 361, pp. 598–604.
20. Wang, W.Y., Barratt, B.J., Clayton, D.G. and Todd, J.A. (2005),
‘Genome-wide association studies: theoretical and practical concerns’,Nat. Rev.
Genet.Vol. 6, pp. 109–118.
21. Saito, A. and Kamatani, N. (2002), ‘Strategies for genome-wide association studies: Optimization of study designs by the stepwise focusing
method’,J. Hum. Genet.Vol. 47, pp. 360–365.
22. Sagatopan, J.M., Verbel, D.A., Venkatraman, E.S.et al.(2002),
‘Two-stage designs for genetic association studies’,BiometricsVol. 58,
pp. 163–170.
23. Sagatopan, J.M. and Elston, R.C. (2003), ‘Optimal two-stage genotyping
in population-based association studies’,Genet. Epidemiol.Vol. 25,
pp. 149–157.
24. Sagatopan, J.M., Venkatraman, E.S. and Begg, C.B. (2004), ‘Two-stage designs for gene-disease association studies with sample size constraints’,
BiometricsVol. 60, pp. 589–597.
25. Lowe, C.E., Cooper, J.D., Chapman, J.M.et al.(2004), ‘Cost-effective
analysis of candidate genes using htSNPS: A staged approach’,Genes
Immun.Vol. 5, pp. 301–305.
26. Konig, I.R. and Ziegler, A. (2003), ‘Group sequential study designs in
genetic-epidemiological case-control studies’,Hum. Hered.Vol. 56,
pp. 63–72.
27. Sham, P., Bader, J.S., Craig, I.et al.(2002), ‘DNA pooling: A tool for
large-scale association studies’,Nat. Rev. Genet.Vol. 3, pp. 862–871.
28. Marchini, J., Donnelly, P. and Cardon, L.R. (2005), ‘Genome-wide strategies for detecting multiple loci that influence complex diseases’,
Nat. Genet.Vol. 37, pp. 413–417.
29. Holm, S. (1979), ‘A simple sequentially rejective multiple test procedure’,
Scand. J. Statist.Vol. 6, pp. 65–70.
30. Hoh, J. and Ott, J. (2003), ‘Mathematical multi-locus approaches
to localizing complex human trait genes’,Nat. Rev. Genet.Vol. 4,
pp. 701–709.
31. Zaykin, D.V., Zhivotovsky, L.A., Westfall, P.H. and Weir, B.S. (2002),
‘Truncated product method for combining P-values’,Genet. Epidemiol.
Vol. 22, pp. 170–185.
32. Dudbridge, F. and Koeleman, B.P. (2003), ‘Rank truncated product
of P-values, with application to genomewide association scans’,Genet
Epidemiol.Vol. 25, pp. 360–366.
33. Dudbridge, F. and Koeleman, B.P. (2004), ‘Efficient computation of significance levels for multiple associations in large studies of correlated
data, including genomewide association studies’,Am. J. Hum. Genet.
Vol. 75, pp. 424–435.
34. Zaykin, D.V. (1999), ‘Statistical Analysis of Genetic Associations’, PhD thesis,
North Carolina State University Raleigh, NC.
35. Goeman, J.J., van de Geer, S.A., de Kort, F. and van Houwelingen, H.C. (2004), ‘A global test for groups of genes: Testing association with a
clinical outcome’,BioinformaticsVol. 20, pp. 93–99.
36. Ishwaran, H. and Rao, J.S. (2003), ‘Detecting differentially expressed
genes in microarrays using Bayesian model selection’,J. Am. Stat. Assoc.
Vol. 98, pp. 438–455.
37. Kauermann, G. and Eilers, P. (2004), ‘Modeling microarray data using
a threshold mixture model’,BiometricsVol. 60, pp. 376–387.
38. Gusnanto, A., Ploner, A. and Pawitan, Y. (2005), ‘Fold-change estimation
of differentially expressed genes using mixture mixed-model’,Stat. Appl.
Genet. Mol. Biol.Vol. 4, p. 26.
39. Allison, D.B., Gadbury, G.L., Heo, M.et al.(2003), ‘A mixture model
approach for the analysis of microarray gene expression data’,Comp. Stat.
Data Anal.Vol. 39, pp. 1–20.
40. Hayes, B. and Goddard, M.E. (2001), ‘The distribution of the effects
of genes affecting quantitative traits in livestock’,Genet. Sel. Evol.Vol. 33,
pp. 209–229.
41. Barton, N.H. and Keightley, P.D. (2002), ‘Understanding quantitative
genetic variation’,Nat. Rev. Genet.Vol. 3, pp. 11–21.
42. Pesarin, F. (2001), ‘Multivariate Permutation Tests With Applications
in Biostatistics’, Wiley, Chichester, UK.
43. Coles, S. (2001), ‘An Introduction to Statistical Modelling of Extreme Values’,
Springer, London, UK.
44. Lin, D.Y. (2005), ‘An efficient Monte Carlo approach to assesssing
statistical significance in genomic studies’,BioinformaticsVol. 21,
pp. 781–787.
45. Seaman, S.R. and Mu¨ller-Myhsok, B. (2004), ‘Rapid simulation of P values for product methods and multiple-testing adjustment in association
studies’,Am. J. Hum. Genet.Vol. 76, pp. 399–408.
46. Seaman, S.R. and Mu¨ller-Myhsok, B. (2005), ‘Reply to Lin’,Am. J. Hum.
Genet.Vol. 77, pp. 514–515.
47. Bailey, T.L. and Grundy, W.N. (1999), ‘Classifying proteins by family
using the product of correlated p-values’,Proc. RECOMB99,
48. Camp, N.J. and Farnham, J.M. (2001), ‘Correcting for multiple analyses
in genomewide linkage studies’,Ann. Hum. Genet. Vol. 65,
pp. 577–582.
49. Cheverud, J.M. (2001), ‘A simple correction for multiple comparisons
in interval mapping genome scans’,HeredityVol. 87, pp. 52–58.
50. Nyholt, D.R. (2004), ‘A simple correction for multiple testing for single-nucleotide polymorphisms in linkage disequilibrium with each other’,
Am. J. Hum. Genet.Vol. 74, pp. 765–769.
51. Salyakina, D., Seaman, S.R., Browning, B.L.et al.(2005), ‘Evaluation
of Nyholt’s procedure for multiple testing correction’,Hum. Hered.
Vol. 60, pp. 19–25.
52. Benjamini, Y. and Hochberg, Y. (1995), ‘Controlling the false discovery
rate — A practical and powerful approach to multiple testing’,J.R. Stat.
Soc. BVol. 57, pp. 289–300.
53. Storey, J.D. and Tibshirani, R. (2003), ‘Statistical significance
for genomewide studies’,Proc. Natl. Acad. Sci. USAVol. 100, pp. 9440–9445.
54. Manly, K.F., Nettleton, D., and Hwang, J.T (2004), ‘Genomics, prior
probability, and statistical tests of multiple hypotheses’,Genome Res.
Vol. 14, pp. 997–1001.
55. Wacholder, S., Chanock, S., Garcia-Closas, M.et al.(2004),
‘Assessing the probability that a positive report is false: an approach
for molecular epidemiology studies’,J. Nat. Cancer Inst.Vol. 96, pp. 434–442.
56. Storey, J.D. (2002), ‘A direct approach to false discovery rates’,J.R. Stat.
Soc. BVol. 64, pp. 479–498.
57. Korn, E.L., Troendle, J.F., McShane, L.M. and Simon, R. (2004), ‘Controlling the number of false discoveries: Application to
high-dimensional genomic data’,J. Stat. Plan. InferenceVol. 124, pp.
379–398.
58. Efron, B., Tibshirani, R., Storey, J.D. and Tusher, V. (2001), ‘Empirical
Bayes analysis of a microarray experiment’,J. Am. Stat. Assoc.Vol. 96,
pp. 1151–1160.
59. Efron, B. and Tibshirani, R. (2002), ‘Empirical Bayes methods and
false discovery rates for microarrays’,Genet. Epidemiol.Vol. 23,
pp. 70–86.
60. Pounds, S. and Morris, S.W. (2003), ‘Estimating the occurrence of false positives and false negatives in microarray studies by approximating and
partitioning the empirical distribution of P-values’,BioinformaticsVol. 19,
pp. 1236–1242.
61. Liao, J.G., Lin, Y., Selvanayagam, Z.E. and Shih, W.J. (2004), ‘A mixture model for estimating the local false discovery rate in DNA microarray
analysis’,BioinformaticsVol. 20, pp. 2694–2701.
62. Thomas, D.C. and Clayton, D.G. (2004), ‘Betting odds and genetic
associations’,J. Nat. Cancer Inst.Vol. 96, pp. 421–423.
63. Manly, K.F., Nettleton, D. and Hwang, J.T. (2004), ‘Genomics, prior
probability, and statistical tests of multiple hypotheses’,Genome Res.Vol. 14,
pp. 997–1001.
64. Ioannidis, J.P. (2005), ‘Why most published research findings are false’,