Response Models to Two-stage in Complex Surveys
Mohammad Rafiq
Department of Statistics, University of Malakand, Dir (Lower) [email protected]
Zawar Hussain
Department of Statistics, Quaid-e-Azam University, Islamabad [email protected]
Sohail Akhtar
Department of Statistics, University of Malakand, Dir (Lower) [email protected]
Abstract
Warner (1965) introduced a Randomized Response Technique (RRT) to minimize bias due to non- response or false response. Thereafter, several researchers have made significant contribution in the development and modification of different Randomized Response Models. We have modified a few one-stage Simple Randomized Response Models to two-one-stage randomized response models in complex surveys and found that our developed models are more efficient.
Keywords:
Randomized Response Technique, Sensitive Character, Unbiased Estimators and Complex Surveys.
1. Introduction
In survey sampling, the collection of information on sensitive variables like illegal income, accumulated savings, intentional tax evasion and usage of illegal drugs is very difficult to obtain and in case of any response they give false or evasive answers, when direct questioning is done. To overcome this problem Warner (1965) suggested a technique known as Randomized Response Technique.
There are some others articles which include, Chaudhuri and Mukerjee (1988), Bhargava and Singh (2000), Chaudhuri (2001a, 2001b), Horng et al. (2004), Chaudhuri (2004), Shabbir and Gupta (2005), Saha (2006), Hussain et al. (2007), Chaudhuri et al. (2009), Hussain et al. (2009), Rafiq et al. (2013). In this paper, we have modified Bhargava and Singh (2000), Horng et al. (2004), Shabbir and Gupta (2005) procedures to Two-stage Randomized Response procedures in complex sample surveys and observed that the Two-stage procedure is better than the conventional One-stage procedure in complex survey design.
2. Generalized Two-Stage Randomized Response Procedure
selected individual in the sample is first provided with RR technique R2 and is requested to drawn a ball from the box in the absence of the interviewer, if a black ball is chosen, the respondent is requested to disclose his / her true A or AC character in terms of 1 or 0. If he/she select a white ball, then he / she is requested to use RR technique R1and report the RR say zi depending on the outcome of the random experiment and the interviewers true A or C
A characteristics. Here R1 may be one of the randomized response procedures.
Let wi be the response from ithindividual through a two stage RR procedure.
i i
w y with probability q,
zi with probability
1q
.Let suppose that
1 ,
R i i
E z ay b and
1 , .
R i i
V z d "iU
Suppose
1 R
E ,
1 R
V are the expectation and variance respectively with respect to RR device
1
R . Similarly
2 R
E ,
2 R
V denote the expectation and variance with respect to RR device
2
R . Let ER, VR represent the expectation and variance of the overall two-stage RR
Procedure.
R i
E w q
1 q a y
i b
1q
This implies that,
11
i i
w q b
r
q q a
, (2.1)
Satisfying that, ER
ri yi,"iU.
R i
V w
1 q
di q
1q
1a y
i b2. (2.2)Thus
R i
V r
2
2
1 1
. 1
i i
q q a y b
q q a
d
2 1
21 2
1 1
1
R i i
q q a b
V r V
q q a
d
2
20 2
1
1
R i i
q qb
V r V
q q a
0
d
, if yi 0,
(2.4)
where d ½i yi1d and1 d ½i yi0d . 0
Here it may be noted that for q = 0, (Which is the case of one stage RR procedure)
,
i i
z b
r a
1
1
R i
R i i
E z b
E r y
a
,
and
1
1 2 2 1.
R i i
R i i
V z
V r V
a a
d
1
1
1 11
2 2 ,
R i
R i i
V z
V r V
a a
d if yi 1,
and
1
1
0 10
2 2 ,
R i
R i i
V z
V r V
a a
d if yi 0,
Now we may two cases.
Case 1
:
ifyi=1In this case the two-stage randomized response procedure will be more efficient than the conventional randomized response procedure if
21i 11i,
V V
"iU,
2 1
1
2 2
1 1
1
q q a b
a
q q a
d d
Or
2 12
2 11
1 .
1 1
q d
a a a b
d
d (2.5)
In case yi=0 the two-stage randomized response procedure will be more efficient than the conventional randomized response procedure if
20i 10i,
V V "iU,
or
2
0 0
2 2
1
1
q qb
a
q q a
Solving the above we get,
02 2 2 20
1 1
q d
a a b
d
d
(2.6)
The two cases, when yi=1 and yi=0, discussed above, show that the Generalized two-stage RR procedure will be better than the usual RR procedure if
1 2
max , . q d dThis condition is known as optimality condition.
3. Estimation Incorporating the Sample Designs
Suppose U
1, 2,..., ,...,i N
represent a finite population with yi as the value for its ithunit on a variable ysuch that yi 1, if ith individual carries a sensitive attributeA, 0 if ith individual does not carry attribute A. The purpose is to obtain unbiased and
precise estimator of the parameter
1
,
N i i
Y y
on surveying a sample sof nunits from Uselected with sampling design P s
. We will useER, VRas expectation and variance operators with respect to any RR design.4. Sample Selection and Estimation
LetEP, VPare the operators for expectation and variance with respect to any sampling designP. LetE, V are the operators for overall expectation and variance such that
,
P R R P
E E E E E V E VP RV EP R E VR P V ER P.
For a general sampling design, we shall write
1
N
b i si si
i
t y b I
, an estimator for thepopulation totalY,where b ssi, are constants free of Y, R, Isi 1, if is,and0,ifis such that EP
b Isi si
1" i.In randomized response procedure y si, are not directly ascertained, therefore, we consider an unbiased estimator for the population total Y, in two-stage randomization device as,
2 1
,
N b i si si
i
e rb I
where
1
. 1
i i
w q b
r
q q a
then
2b P R
2b R P
2b .E e E E e E E e Y
also
2
2 2
1 1
1
i i
R i i
q q a y b
V r V
q q a
d
2b P R
2b P R
2bV e E V e V E e
22 2
1
.
N
b P b P i si si
i
V e V t E V b I
If y si, are not ascertainable, therefore, an unbiased estimator for the population total Y,
using one stage randomization device is given by
1 1
,
N
b i si si
i
e rb I
where i ,i
z b
r a
now E e
1b E EP R
e1b E ER P
e1b Y. and
1b P R
1b P R
1bV e E V e V E e
21 1
1
.
N
b P b P i si si
i
V e V t E V b I
(4.2)Writing
21
,
N N
P b i i i j ij
i i j
V t y c Y Y c
where ci EP
b Isi2 si
1, cij EP
b Isi si 1
b Isj sj 1 ,
if,
si sij
c c are available free of Y R, , Isij I Isi sj Such that EP
c Isi si
ci and
.P sij sij ij
E c I c
5. Efficiency Comparisons
The two-stage randomize response model will be more efficient than its conventional RR model if V e
1b V e
2b 0Or
V1iV2i
0(5.1)
6. Bhargava and Singh (2000) Procedure
Bhargava and Singh (2000) randomization device consist of a deck having three types of cards, each card having different statements
i) I belong to the sensitive group A
ii) I do not belong to the sensitive group A
iii) Blank cards, with probabilities P1,P2 and P3 respectively, where P1 P2 and
1 2 3 1
P P P
If the blank cards selected he / she respond yes irrespective of his or her actual status. The probability of yes response is given as,
1 1 2 1 3,
R i i i
and
1 1 1 1
R i R i R i
V I E I E I
21 2 i 2 3 1 2 i 2 3 .
P P y P P P P y P P
were d1
P1P3
1
P1P3
d0
P2 P3
1
P2 P3
If y si, are not ascertainable, therefore, an unbiased estimator for the population total Y,
using one stage randomization device is given by
1 1
,
N
b i si si
i
e rb I
1 2 2
3,
i i
I P P
r P P
satisfies that ER
ri yi.
1 3 1 3
11 2
1 2
1
i
P P P P
V
P P
and
2 3 2 3
10 2
1 2
1
i
P P P P
V P P
1 2, 2 3, 0 2 3 1 2 3 , 1 1 3 1 1 3
aP P b P P d P P P P d P P P P
In randomized response procedure y si, are not directly ascertained, therefore, we consider an unbiased estimator for the population Y, total in two-stage randomization device as,
2 1
,
N b i si si
i
e rb I
where
12 23
1 1
i i
w q P P
r
q q P P
1 3 1 3 1 3
21 2
1 2
1 1 1
1
i
q P P P P q P P
V
q q P P
2 3 2 3 2 3
20 2
1 2
1 1
1
i
q P P P P q P P
V
q q P P
here
2 1 2 1
3
1
2 1 2 1 3 1 3
2 2
P P P P P
d
P P P P P P P
and
1 2 1 2 3
2
1 2 1 2 3 2 3 1
2 2
.
2 2 1 2
P P P P P
d
P P P P P P P P
Two-stage randomize response model will be more efficient than its conventional RR model if
1b
2b 0V e V e
1 3 1 3 1 3
1 3 1 3
2 2
1 2 1 2
1 1 1
1
0 1
q P P P P q P P
P P P P
P P q q P P
and
2 3 2 3 2 3
2 3 2 3
2 2
1 2 1 2
1 1
1
0 1
q P P P P q P P
P P P P
P P q q P P
As it is apparent from the above inequality to derive an efficiency condition, so, we resort to an empirical study. The results based on empirical study are given in Table 1.
Table 1: Values of V11i,V10i,V21i,V20i,d1and d2 for different values of P1, P2,P3
and q
Rows P1 P2 P3 q V11i V10i V21i V20i d1 d2
1 0.6 0.3 0.1 0.95 2.333 2.667 0.016 0.021 -0.891 -0.818
2 0.6 0.3 0.1 0.05 2.333 2.667 1.816 2.099 -0.891 -0.818
3 0.6 0.2 0.2 0.95 1.000 1.500 0.011 0.021 -1.500 -1.142
4 0.6 0.2 0.2 0.05 1.000 1.500 0.832 1.274 -1.500 -1.142
5 0.6 0.1 0.3 0.95 0.360 0.960 0.005 0.021 -2.600 -1.400
6 0.6 0.1 0.3 0.05 0.360 0.960 0.311 0.855 -2.600 -1.400
7 0.7 0.2 0.1 0.95 0.640 0.840 0.01 0.016 -2.200 -1.800
8 0.7 0.2 0.1 0.05 0.640 0.840 0.558 0.74 -2.200 -1.800
9 0.7 0.1 0.2 0.95 0.250 0.583 0.005 0.015 -4.000 2.181
10 0.7 0.1 0.2 0.05 0.250 0.583 0.224 0.53 -4.000 2.181
11 0.8 0.1 0.1 0.95 0.184 0.327 0.005 0.01 -5.923 -3.705
12 0.8 0.1 0.1 0.05 0.184 0.327 0.168 0.301 -5.923 -3.705
7. Shabbir and Gupta (2005) Procedure
Shabbir and Gupta (2005) randomized response model consists of a deck having three types of cards with different statements,
i) I belong to the sensitive group A,
ii) I do not belong to the sensitive group A,
iii) Blank cards, with probabilities P1, P2 and P3 respectively, where P1 P2 and
1 2 3 1
P P P
The probability of yes response is given as,
1 1 2 1 3 ,
R i i i i
E I P y P y P y
1 1 1 1
R i R i R i
V I E I E I
P1 P2 P y3 i P2
1
P1 P2 P y3
i P2
where d1
P1P3
1
P1P3
and d0 P2
1P2
If y si, are not ascertainable, therefore, an unbiased estimator for the population total Y,
using one stage randomization device is given by
1 1
,
N
b i si si
i
e rb I
where 21 2 3
i i
I P
r
P P P
1 2 3, 2, 1 1 3 1 1 3 , 0 2 1 2
aP P P bP d P P P P d P P
1 3 1 3
11 2
1 2 3
1
i
P P P P
V
P P P
and
2 2
10 2
1 2 3
1
i
P P
V
P P P
In randomized response procedure y si, are not directly ascertained, therefore, we consider an unbiased estimator for the population total Y,in two-stage randomization device as,
2 1
,
N b i si si
i
e rb I
where
1 22 3
1 1
i i
w q P
r
q q P P P
1 3 1 3 1 3
21 2
1 2 3
1 1 1
1
i
q P P P P q P P
V
q q P P P
2 2 2
20 2
1 2 3
1 1
. 1
i
q P P qP
V
q q P P P
2 1
3 2 1
3
1
2 1 3 2 1 3 1 3
P P P P P P
d
P P P P P P P P
1 2
3 1 2
3
2
1 2 3 1 2 3 2
2
. 2 1
P P P P P P
d
P P P P P P P
Two-stage randomize response model will be more efficient than its conventional RR model if
1b
2b 0V e V e
or
1 3 1 3 1 3
1 3 1 3
2 2
1 2 3 1 2 3
1 1 1
1
0 1
q P P P P q P P
P P P P
P P P q q P P P
and
2 2 2
2 2
2 2
1 2 3 1 2 3
1 1
1
0 1
q P P qP
P P
P P P q q P P P
As it is apparent from the above inequality to derive an efficiency condition, so, we resort to an empirical study. The results based on empirical study are given in Table 2.
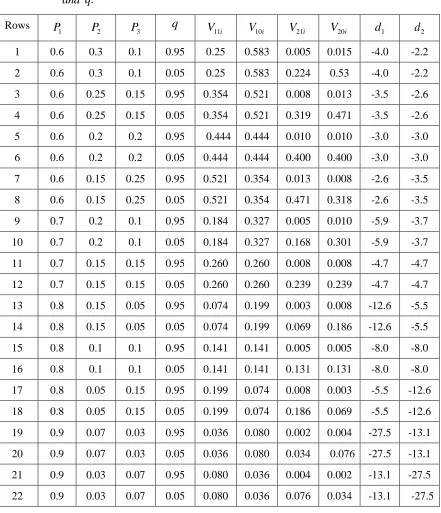
Table 2: Values of V11i,V10i,V21i,V20i,d1and d for different2 values of P1,P ,2 P3,
and q .
Rows 1
P P2 P3 q V11i V10i V21i V20i d1 d2
1 0.6 0.3 0.1 0.95 0.25 0.583 0.005 0.015 -4.0 -2.2
2 0.6 0.3 0.1 0.05 0.25 0.583 0.224 0.53 -4.0 -2.2
3 0.6 0.25 0.15 0.95 0.354 0.521 0.008 0.013 -3.5 -2.6
4 0.6 0.25 0.15 0.05 0.354 0.521 0.319 0.471 -3.5 -2.6
5 0.6 0.2 0.2 0.95 0.444 0.444 0.010 0.010 -3.0 -3.0
6 0.6 0.2 0.2 0.05 0.444 0.444 0.400 0.400 -3.0 -3.0
7 0.6 0.15 0.25 0.95 0.521 0.354 0.013 0.008 -2.6 -3.5
8 0.6 0.15 0.25 0.05 0.521 0.354 0.471 0.318 -2.6 -3.5
9 0.7 0.2 0.1 0.95 0.184 0.327 0.005 0.010 -5.9 -3.7
10 0.7 0.2 0.1 0.05 0.184 0.327 0.168 0.301 -5.9 -3.7
11 0.7 0.15 0.15 0.95 0.260 0.260 0.008 0.008 -4.7 -4.7
12 0.7 0.15 0.15 0.05 0.260 0.260 0.239 0.239 -4.7 -4.7
13 0.8 0.15 0.05 0.95 0.074 0.199 0.003 0.008 -12.6 -5.5
14 0.8 0.15 0.05 0.05 0.074 0.199 0.069 0.186 -12.6 -5.5
15 0.8 0.1 0.1 0.95 0.141 0.141 0.005 0.005 -8.0 -8.0
16 0.8 0.1 0.1 0.05 0.141 0.141 0.131 0.131 -8.0 -8.0
17 0.8 0.05 0.15 0.95 0.199 0.074 0.008 0.003 -5.5 -12.6
18 0.8 0.05 0.15 0.05 0.199 0.074 0.186 0.069 -5.5 -12.6
19 0.9 0.07 0.03 0.95 0.036 0.080 0.002 0.004 -27.5 -13.1
20 0.9 0.07 0.03 0.05 0.036 0.080 0.034 0.076 -27.5 -13.1
21 0.9 0.03 0.07 0.95 0.080 0.036 0.004 0.002 -13.1 -27.5
8. Horng et. al. (2004) Procedure
In this procedure the randomization device carries a deck having four types of cards, each having different statements,
i) I belong to the sensitive group A
ii) I do not belong to the sensitive group A
iii) Yes cards
iv) No cards, with probabilities P1,P2,P3 and P4 respectively, where P1 P2 and
1 2 3 4 1
P P P P
The probability of yes response is given by,
1 1 2 1 3,
R i i i
E I P y P y P
1 1 1 1
R i R i R i
V I E I E I
21 2 i 2 3 1 2 i 2 3 .
P P y P P P P y P P
1 P1P3 1 P1P3
d and d0
P2 P3
1
P2 P3
If y si, are not ascertainable, therefore, an unbiased estimator for the population total Y,
using one stage randomization device is given by
1 1
,
N
b i si si
i
e rb I
2 3
1 2
,
i i
I P P
r
P P
satisfies that ER
ri yi.
1 2, 2 3, 1 1 3 1 1 3 , 0 2 3 1 2 3
aP P b P P d P P P P d P P P P
1 3 1 3
11 2
1 2
1
i
P P P P
V
P P
and
2 3 2 3
10 2
1 2
1
i
P P P P
V
P P
In randomized response procedure y si, are not directly ascertained, therefore, we consider an unbiased estimator for the population total Y, in two-stage randomization device as,
2 1
,
N b i si si
i
e rb I
where
12 23
1
. 1
i i
w q P P
r
q q P P
1 3 1 3 1 3
21 2
1 2
1 1 1
1
i
q P P P P q P P
V
q q P P
2 3 2 3 2 3
20 2 1 2 1 1 . 1 i
q P P P P q P P
V
q q P P
2
1 2 1
3
1
2 1 2 1 3 1 3
2
. 2
P P P P P
d
P P P P P P P
1 2 1 2
3
2
1 2 1 2 3 1 3
2 2
.
2 2 1
P P P P P
d
P P P P P P P
Two-stage randomize response model will be more efficient than its conventional RR model if
1b
2b 0V e V e
1 3 1 3 1 3
1 3 1 3
2 2
1 2 1 2
1 1 1
1
0 1
q P P P P q P P
P P P P
P P q q P P
and
2 3 2 3 2 3
2 3 2 3
2 2
1 2 1 2
1 1
1
0 1
q P P P P q P P
P P P P
P P q q P P
As it is apparent from the above inequality to derive an efficiency condition, so, we resort to an empirical study. The results based on empirical study are given in Table 3.
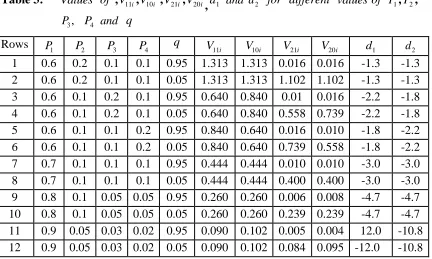
Table 3: Values of ,V11i,V10i ,V21i,V20i
,d1 and d2 for different values of P1,P2,
3,
P
P4 and q
Rows P1 P2 P3 P4 q V11i V10i V21i V20i d1 d2
1 0.6 0.2 0.1 0.1 0.95 1.313 1.313 0.016 0.016 -1.3 -1.3
2 0.6 0.2 0.1 0.1 0.05 1.313 1.313 1.102 1.102 -1.3 -1.3
3 0.6 0.1 0.2 0.1 0.95 0.640 0.840 0.01 0.016 -2.2 -1.8
4 0.6 0.1 0.2 0.1 0.05 0.640 0.840 0.558 0.739 -2.2 -1.8
5 0.6 0.1 0.1 0.2 0.95 0.840 0.640 0.016 0.010 -1.8 -2.2
6 0.6 0.1 0.1 0.2 0.05 0.840 0.640 0.739 0.558 -1.8 -2.2
7 0.7 0.1 0.1 0.1 0.95 0.444 0.444 0.010 0.010 -3.0 -3.0
8 0.7 0.1 0.1 0.1 0.05 0.444 0.444 0.400 0.400 -3.0 -3.0
9 0.8 0.1 0.05 0.05 0.95 0.260 0.260 0.006 0.008 -4.7 -4.7
10 0.8 0.1 0.05 0.05 0.05 0.260 0.260 0.239 0.239 -4.7 -4.7
11 0.9 0.05 0.03 0.02 0.95 0.090 0.102 0.005 0.004 12.0 -10.8
12 0.9 0.05 0.03 0.02 0.05 0.090 0.102 0.084 0.095 -12.0 -10.8
9. Discussion and Conclusion
For different values of P1,P2, P3, P4 and q the values, V10i,V11i, V20i, V21i, d1 and d2 are
calculated (See Tables 1-3 in appendix). The values of d1 and d2 are calculated only to
procedure. For almost all models discussed above, the two stage procedure is more precise than its one stage procedure for P1 close to 0.6 and 0.7 and for higher value of P1 close to 0.8 and 0.9 the two stage procedures performs slightly well.
References
1. Bhargava, M. and Singh, R. (2000). A modified randomization device for
Warner’s model. Statistca, 60, 315–321.
2. Chaudhuri, A. and Mukerjee, R. (1988). Randomized response theory and
techniques. Marcel Dekker, Inc., New York.
3. Chaudhuri, A. (2001a). Using randomized response from a complex survey to estimate a sensitive proportion in a dichotomous finite population. Journal of Statistical Planning and Inference 94, 37-42.
4. Chaudhuri, A. (2001b). Estimating sensitive proportions from unequal probability sampling using randomize responses. Pakistan Journal of statistics 17, 259-270.
5. Chaudhuri, A. Christofied, T. C and Saha, A. (2009). Protection of privacy in efficient application of randomized response techniques, Statistical Method and Application, 18, 389-418.
6. Hussain, Z. and Shabbir, J. (2007). On estimation of mean of a sensitive quantitative variable. Inter Stat, July # 6.
7. Husain, Z. and Shabbir, J. (2009). On estimation of mean of a sensitive quantitative variable in complex surveys. Pakistan Journal of statistics. 25, 127-134.
8. Mangat, N. S. (1994). An improved randomized response strategy. Journal of Royal Statistical Society, 56, 93-95.
9. Rafiq, M., Hussain. Z., Zaman, Q., Iqbal, M., Wahab, S. (2013). Modified version of Kim and Warde mixed Randomized Response in to complex surveys, 29, 4, 591-598.
10. Shabbir, J. and Gupta, S. (2005). On modified randomization device for Warner’s
model. Pakistan Journal of statistics, 21,123-129.
11. Saha, A. (2006). A generalized two-stage randomized response procedure in complex sampling survey. Australian and New Zealand Journal of Statistics, 48, 429-443.
12. Warner, S. L. (1965). Randomized response: A survey technique for eliminating