R E S E A R C H
Open Access
Comparative analysis of the quality of a global
algorithm and a local algorithm for alignment of
two sequences
Valery O Polyanovsky
1, Mikhail A Roytberg
2and Vladimir G Tumanyan
1*Abstract
Background:Algorithms of sequence alignment are the key instruments for computer-assisted studies of biopolymers. Obviously, it is important to take into account the“quality”of the obtained alignments, i.e. how closely the algorithms manage to restore the“gold standard” alignment (GS-alignment), which superimposes positions originating from the same position in the common ancestor of the compared sequences. As an
approximation of the GS-alignment, a 3D-alignment is commonly used not quite reasonably. Among the currently used algorithms of a pair-wise alignment, the best quality is achieved by using the algorithm of optimal alignment based on affine penalties for deletions (the Smith-Waterman algorithm). Nevertheless, the expedience of using local or global versions of the algorithm has not been studied.
Results:Using model series of amino acid sequence pairs, we studied the relative“quality”of results produced by local and global alignments versus (1) the relative length of similar parts of the sequences (their“cores”) and their nonhomologous parts, and (2) relative positions of the core regions in the compared sequences. We obtained numerical values of the average quality (measured as accuracy and confidence) of the global alignment method and the local alignment method for evolutionary distances between homologous sequence parts from 30 to 240 PAM and for the core length making from 10% to 70% of the total length of the sequences for all possible positions of homologous sequence parts relative to the centers of the sequences.
Conclusion:We revealed criteria allowing to specify conditions of preferred applicability for the local and the global alignment algorithms depending on positions and relative lengths of the cores and nonhomologous parts of the sequences to be aligned. It was demonstrated that when the core part of one sequence was positioned above the core of the other sequence, the global algorithm was more stable at longer evolutionary distances and larger nonhomologous parts than the local algorithm. On the contrary, when the cores were positioned
asymmetrically, the local algorithm was more stable at longer evolutionary distances and larger nonhomologous parts than the global algorithm. This opens a possibility for creation of a combined method allowing generation of more accurate alignments.
1. Background
Pair-wise alignment of amino acid sequences is the main method of comparative protein analysis. Among the most popular algorithms based on comparison of pro-tein primary structures the Needleman-Wunch algo-rithm [1], the Smith-Waterman algoalgo-rithm [2], BLAST [3], and FASTA [4] should be noted. On the basis of paper [1] the algorithm [5] was created for comparing
sequences with intermittent similarities. The improved version [6] makes use of multiple parameter sets in computation of an optimal alignment of the two sequences. A number of algorithms (Walquistet al. [7], Litvinov et al. [8], etc.) also take into account specific features of protein primary structures. However, it is important to know how closely algorithmic alignments produced through optimization of any chosen target function reflect an evolution-based alignment of the appropriate amino acid sequences, e.g. the one, which juxtaposes the positions in the compared proteins * Correspondence: [email protected]
1Engelhardt Institute of Molecular Biology, RAS, 119991, Moscow, Russia
Full list of author information is available at the end of the article
originating from the same position in their common predecessor.
The “quality”of the alignment algorithms, i.e. mutual concordance of algorithmic and GS alignments, was analyzed from different points of view; in most cases, alignments based on intercomparison of three-dimen-sional structures were used as the GS alignments. It was premised on the fact that 3D structures of proteins are much more conservative than their amino acid sequences [9].
In other words, sequences corresponding to a certain fold are greatly confluent: the same structure corre-sponds to somewhat dissimilar or even totally dissimilar sequences. There are also a number of counter-exam-ples, when similar sequences correspond to totally dif-ferent 3D structures, but such examples are much less common [10]. Vingron and Argos [11] demonstrated that there was a relationship between conservatism of the optimal global alignment region in a set of subopti-mal alignments and its similarity with the structural alignment results. They showed that regions of optimal alignment, recurring most frequently in suboptimal alignments, were very similar to alignments produced by the structural alignment methods.
In works [12,13], evaluation of the accuracy of the optimal alignment was based on determination of the matching accuracy for each pair of matched amino acid residues, with the following plotting of the robustness index values versus the number of the aligned pair of residues. For example, Mevissen and Vingron [12] used a weight difference for the optimal alignment and the alignment with the largest weight, in which residue i and residuejwere not matched, as a measure of robust-ness for matching residuei with residuej. In the work of Schlosshauer and Olsson [13], the measure of validity for matching residuei with residuejwas based on sub-stituting the discrete function “max” in the dynamic programming algorithm with a parameter-dependent analog function. It allowed evaluating possible subopti-mal alternatives for the chosen aligned pair of residues, thus also allowing a numerical evaluation of the accu-racy of their matching. This numerical index calculated for each pair of residues serves as a measure of the local accuracy of the alignment.
As opposed to the works mentioned above, our eva-luation of algorithmic alignment methods was based not on the assessment of the alignment results for a few selected positions, but on the comparison of algorithmic alignments with the GS alignment as a whole over the total length of the sequences (see [14-16]). From the results of comparison of structural alignments with local algorithmic Smith-Waterman alignments Sunyaevet al. [16] made a conclusion that the possibility of recon-struction of structural alignments from algorithmic ones
depends on the degree of similarity of appropriate pro-teins; besides, examination of internal structures of both alignments allowed to develop a more efficient proce-dure for aligning two sequences, taking into account not only the mean level of their identity, but also the distri-bution of more or less similar regions in the sequences in the structural alignment.
However, all the works cited above had a common fault: algorithmic alignments were compared not with the true evolutionary alignments (which were unknown!), but with their approximations. This intro-duced an error in the results, which could not be esti-mated by the usual direct methods. We suggest using a comparison of artificially generated sequences to evalu-ate the quality of alignment algorithms, because the GS alignment for such sequences is known from the very beginning. A similar numerical experiment was described in [17,18]. However, generation of the test set of sequences in [17] did not reflect completely available data on the evolutionary process, because insertions and deletions were generated in accordance with an over-simplified algorithm. In the work [18], to generate a set of test sequences, a different evolution model was used, which had been described in [19-21]. The model included both point mutations and indels. Numerical values of the mean accuracy were obtained for the glo-bal alignment algorithm with affine gap penalties (the global version of the Smith-Waterman algorithm) for various evolutionary distances.
The purpose of our work was to determine conditions of preferred applicability of the local and global versions of the algorithm for determination of optimal align-ments with an affine penalty function for indels [22]. Thereinafter, for the sake of brevity, this algorithm will be called the“Smith-Waterman algorithm”. As is well known, the global algorithm finds such positions for gaps in the sequences, which correspond to the maxi-mum value of the difference between summed weights of matched residues and summed penalties for the gaps. A local algorithm allows finding the optimal alignment of two fragments of the studied sequences, whereby the regions before and after the fragments forming the alignment with the maximum weight are not taken into account when the weight is calculated. Thus, unlike the global algorithm, the local algorithm allows determining not only optimal positions for gaps in some fragments, but also the fragments themselves, which provide for their appropriate positioning.
application threshold for the global algorithm, i.e. the values of the above-mentioned parameters, which pro-vided for the same or better quality of alignments by using the global algorithm in comparison to the quality of alignments by using the local algorithm (see the defi-nition of the alignment quality in section 2.3).
2. Methods
2.1 Preparation of test sets of sequence pairs
2.1.1 General description of sets
To carry out computer experiments we prepared 224 test sets, each set including 1000 sequence pairs ("test pairs”). All sets were prepared using the same technique, and different sets have different technique parameters (see below).
A test sequence pair consists of two sequences gener-ated independent of each other from a common initial sequence ("ancestor”), each of their compared sequences consisting of a homologous part ("core”) and nonhomo-logous parts ("consoles”) surrounding the core.
The generation of test pairs is described in the next subsection. It has the following parameters:
1) PAM is the measure of evolutional distance from the common ancestor to the sequence cores (see [19]);
2)ris the ratio of the total length of consoles to the length of the common ancestor of sequence cores (this ratio is accepted to be equal for the both sequences of a pair and, as a result, the total lengths of consoles are equal for the both sequences); 3)c is the ratio of the absolute value of the differ-ence between console lengths to their total length (this ratio is the same for the both sequences, but for sequenceS1 the left console is no longer than the right one, and vice versa for sequenceS2).
To generate test sets with such parameters we used the following values:
1)PAM =30, 60, 120, 240 PAM;
2)r =10%, 20%, 50%, 100% , 200%;
3) c = 0%(the consoles are of the same length), 10%, 20%, ... 100%(one console is missing).
Test sets were prepared for all possible combinations of the above parameters, i.e. in total 224 test sets were prepared (including sequence sets without consoles); the meaning of ther and cvalues is explained in Fig-ure 1.
2.1.2 Description of generation of a test sequence pair The process of generation of a test sequence pair con-sists of the following stages:
(i) Generation of a common ancestor Pof cores of test sequences;
(ii) Generation of coresK1andK2of test sequences in accord with thePAM value;
(iii) Estimation of the total length of consoles for each of the sequences in accord with thervalues; (iv) Estimation of the length of each console in accord with thecvalue;
(v) Generation of consolesL1, R1(the left and right consoles of the first sequence),L2, R2(the left and right consoles of the second sequence);
(vi) Construction of desired test sequencesS1, S2:
S1=L1•K1•R1; S2=L1•K1•R1.
To solve this task we used the following evolution model, which is a version of the evolution model used in our previous paper [18]. Therein we analyzed the alignment of the ancestor sequenceS0 and generated sequence S1from it, whereas here we examine align-ments of sequencesS1andS2 generated from the com-mon ancestor sequenceS0.
The ancestor sequence is generated as a random Ber-noulli amino acid sequence of about 200 a.a., probabil-ities of selection of amino acids were taken as advised in [19]. Consoles are generated in the same way (indepen-dent of each other and of the ancestor sequence). Their lengths are estimated using the formulas (here and
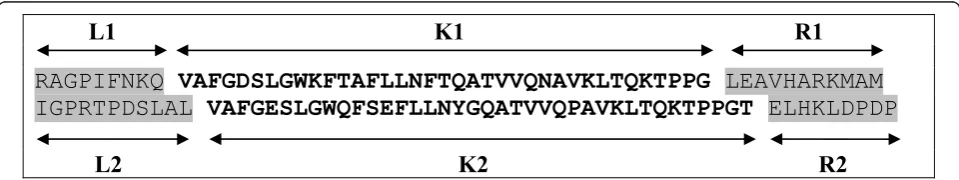
L1 K1 R1
RAGPIFNKQ
VAFGDSLGWKFTAFLLNFTQATVVQNAVKLTQKTPPG
LEAVHARKMAM
IGPRTPDSLAL
VAFGESLGWQFSEFLLNYGQATVVQPAVKLTQKTPPGT
ELHKLDPDP
L2
K2
R2
lower|w|is the length of a symbolic sequencew, i.e.|P| is the length of sequenceP which is a common ancestor for cores of compared sequences):
|L1|=|P| •r•(1−c)/2; |R1|=|P| •r•(1+c)/2;
|L2|=|P| •r•(1+c)/2; |R2|=|P| •r•(1−c)/2.
Generation of cores is described in subsection 2.1.3. 2.1.3 Construction of homologous regions of test sequences (cores)
Cores K1 and K2 were constructed of an ancestor sequence P independently and according to the same procedure. The procedure consisted of two stages.
At the first stage, insertions and deletions were incor-porated into the ancestor sequence. Let us say that there is an indel at positioni(i from1 toL+1) if there is an insertion before position ior a deletion beginning from this positioni; position L+1 corresponds to the insertion at the sequence terminus. The probability of an indel at a given position was calculated by the for-mula:
P(indel)=0.0224−0.0219·e(−0.01168∗PAM), (1) where PAM is the number characterizing the evolu-tional distance between the original and modified sequences [19].
For each positioni, i = 1, ..., L+1, we determined by a random choice if there is an indel. Then we decided at random if an insertion or deletion appeared, the prob-ability of the deletion was chosen to be 0.55. This value was determined empirically, provided that the total length of insertions and deletions was equal. When p (ins) = p(del) = 0.5 at the accepted procedure, the total length of insertions was greater than that of deletions. The length of an insertion or deletion was chosen at random from Zipfian distribution which, as stated in [20], is independent of the evolutional distance. If the chosen deletion length exceeded the distance from posi-tion ito the sequence terminus (in particular, at i = L +1) or the beginning of the deletion coincided with the already deleted position, the attempt was ignored. Ignored was also the insertion if its beginning coincided with the elongation of the earlier made insertion or deletion. Thus, we prevented insertions and deletions, whose length was not equal to the value obtained from the preset distribution.
At the second stage, point mutations were inserted in the obtained sequence. At this, mutations were naturally inserted only in the remaining sites of the original sequence. A cycle of inserting mutations consisted in the following. A substitution is made in every position with certain probability, the probability of origin of a new symbol in this position being determined by the
probability matrix PAM1 [19]. This cycle changes approximately so many times as is the value of PAM. Table 1 shows average portions of coincidence of the ancestor and mutant sequences (%id) and parameter PAM.
The letter composition of insertions was generated analogous to original sequences. It should be noted that contrary to the scheme used in [18], in this case the total length of insertions-deletions was not a constant value for all pairs of sequences from one test set and obeyed the law of random numbers (which is closer to the real evolutional set).
2.2. Comparison of“ancestor-descendant”and
“descendant1-descendant2”tests
In the above procedure, test pairs of sequences are gen-erated according to the “descendant1-descendant2” scheme (i.e. two descendants of a common ancestor are compared) rather than by the “ancestor-descendant” scheme (the ancestor sequence is compared to its des-cendant). The first scheme in a better way models a comparison of real sequences. However thePAM para-meter, used traditionally for characterizing the evolu-tional distance, is second-scheme-oriented, but since the parameter is universal, nothing prevents its use for esti-mating the distance between descendants of a common ancestor.
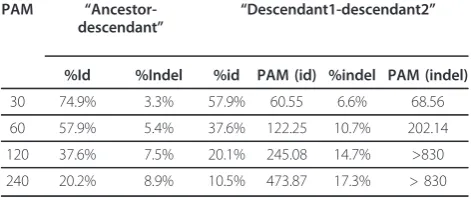
Table 2 shows how different values of PAM corre-spond to the ratio of the test sequences generated according to the “descendant1-descendant2” scheme. The table has two data blocks ("ancestor-descendant” and “descendant1-descendant2”). The first block is of two columns each characterizing reference alignment (see subsection 2.3) of the ancestor sequence and the core generated from it in the course of the process described in subsection 2.1. Column“%id” lists average percentage of column-coincidences among all columns describing letter comparison. Column“%indel”describes
Table 1 Correspondence of%idandPAM.
%id PAM %id PAM
99 1 50 80
95 5 45 94
90 11 40 112
85 17 35 133
80 23 30 159
75 30 25 195
70 38 20 246
65 47 15 328
60 56 10 489
55 67 5 830
the percentage of column-indels among columns of reference alignment. The “descendant1-descendant2” block has four columns. Columns “%id” and “%indel” have the same meaning as in the“ancestor-descendant” block, though they denote reference alignment of two descendants of a common ancestor. ColumnsPAM(%id) andPAM(%indel)list PAMvalues at which correspond-ing characteristics could be obtained for “ancestor-des-cendant” pairs. The table shows that from the point of view of%id, the use of a diverging scheme is equivalent to the use of a sequential scheme at a twice higherPAM value. Nonetheless the number of indels for the “descen-dant1-descendant2” scheme with parameter PAM is essentially higher than for the “ancestor-descendant” scheme with parameter 2·PAM.
2.3 Alignment of sequences with consoles
Alignment of generated sequences was performed using two variations of the Smith-Waterman algorithm - the global and local ones. For global alignment the substitu-tion weight matrix PAM250 and open and gap-extension penalties 14 and 2 were used; for local align-ment the Gonnet250 matrix and penalties 10 and 0.5 were used. Such parameter values were chosen on the base of the preliminary computer experiments [15,17] which allowed getting the best values of the quality of alignments (see subsection 2.4) through all test sets. These values are close to those commonly used.
Prior to the tests with sequences of variable homology along the sequence, we investigated the dependence of the quality of the alignment on the applied substitution matrix and gap-open and gap-extension penalties. For this purpose the following numerical experiment was held.
Test sets including 1000 pairs of sequences each were generated according to the“sequential” scheme of evo-lution with average distances between ancestors and
descendants of 60, 100, 200, 300 PAM (see the descrip-tion of “sequential” and“diverging” schemes in item 2.2).
Pairs of sequences of each test set were aligned by glo-bal version of Smith-Waterman algorithm using two matrices:“native”(i.e. the PAM matrix corresponding to the evolutionary distance between sequences) and PAM250. Values of the measures of similarity (2.4) of algorithmic alignments via the reference alignments derived from“native” matrix and the PAM250 matrix, are practically the same (difference less than 1%, see the table in additional file 1, sheet PAM250). As we observed, the high homologous proteins (id > 45%) can be successfully aligned, using a matrices designed for large evolutionary distances. At the same time, attempts to align low homologous proteins, using a matrix designed for shorter distances, significantly deteriorate the results, signifying mismatch of algorithmic and refer-ence alignments.
This is confirmed by a more complete numerical experiment. For this aim, each pair of sequences of all test sets were aligned using matrices PAM60, PAM100, PAM200, and PAM300. Gap-open and gap-extension penalties ranged from 10 to 20 and from 1 to 5, respec-tively (see the data in additional file 1, sheet Max Values). A practical conclusion of this finding, obviously, is that if the evolutionary distance between the sequences is unknown, the evolutionary distance corresponding to applied matrix, should be certainly greater than expected distance between the sequences.
Complete data on the comparative analysis of weight matrices are given in additional file 1, sheetAll Values.
2.4 Determination of the quality of algorithmic alignments
We are fascinated how close the alignments obtained by the program are to the reference alignments, i.e. align-ments with aligned positions generated from the same position of the ancestor sequence. To assess the close-ness ("the alignment quality”), we have used Accuracy and Confidence measures described elsewhere [14-16]. It should be underlined that in the reference alignment the console positions were accepted to be unaligned. Therefore when calculating the number of comparisons in the algorithmic alignment, we took only columns in which at least one symbol would belong to a homolo-gous region. To explain the above, we will analyze the following example. Let K1 = “abcdefghzzk”and K2 =
“abxxcdefghk”be cores of the compared sequences (their reference alignment is given in Figure 2a). Then let S1 = “****abcdefghzzk****“ and S2 = “****abxxc-defghk****“be sequences with consoles (asterisks desig-nate console symbols that are insignificant for us and probably diverse). The algorithmic alignment of
Table 2 Characteristics of modified sequences generated according to the sequential ("ancestor-descendant”) and diverging ("descendant1-descendant2”) schemes
PAM “
Ancestor-descendant” “
Descendant1-descendant2”
%Id %Indel %id PAM (id) %indel PAM (indel)
30 74.9% 3.3% 57.9% 60.55 6.6% 68.56
60 57.9% 5.4% 37.6% 122.25 10.7% 202.14
120 37.6% 7.5% 20.1% 245.08 14.7% >830
240 20.2% 8.9% 10.5% 473.87 17.3% > 830
sequences with consoles is shown in Figure 2b, and its fragment whose quality is to be assessed is given in Fig-ure 2c. We get the following.
Number of columns without deletions in the reference alignment:
G=9;
Number of columns without deletions in the algorith-mic alignment:
A=13;
Number of common columns without deletions:
I=6;
Accuracy:
Accuracy=I/G=6/9;
Confidence:
Confidence=I/A=6/13.
3. Results and Discussion
We have analyzed the dependence of the quality (i.e. accuracy and confidence) of the global and local align-ments of console sequences versus the following values: (1) the evolutional distance between homologous frag-ments of sequences ("cores”); (2) the console length; and (3) console asymmetry ("shifted cores”).
3.1. Symmetrical consoles
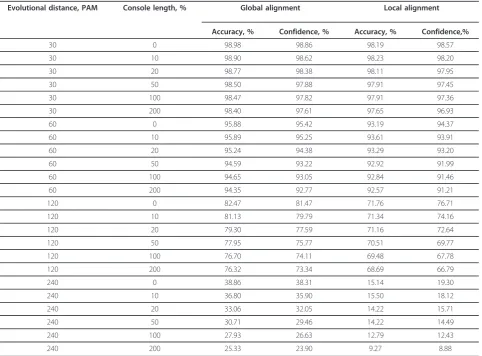
Table 3 shows the dependence of the accuracy and con-fidence values at a symmetrical position of the core (c =
0) and at all PAMandr values analyzed (see subsection 2.1.1). It is seen that when the evolutional distancePAM and the console length rgrow, the accuracy and confi-dence values decrease. In this case, with the same evolu-tional distance and console length, the accuracy and confidence values of the global alignment are somewhat higher than those of the local alignment, this difference increasing with the growth of the evolutional distance. For example, at an evolutional distance of 240 PAM the accuracy of the global alignment is by 18.6% higher than that of the local alignment, whereas the confidence is only 16.2% higher.
Thus, at a symmetrical position of the consoles, the global algorithm has higher resistance to the increase of evolutional distance and console length than the local algorithm.
3.2. Asymmetrical consoles
In contrast, if homologous regions of aligned sequences are shifted in opposite directions from the center of sequences, both the accuracy and confidence of the global alignment decrease remarkably (see Fig-ure 3). In such a case, at a fixed evolutional distance between the sequence cores and the total length of consoles, degradation of the global alignment becomes sharp in a relatively narrow range of changing the con-sole asymmetryc (see the definition ofc in subsection 2.1.1). So, at the evolutional distance of 30PAM, the total length of consoles 100% of the core length and the increase of console asymmetry from 80% to 90%, the accuracy and confidence drop from 85% to 51%. At the total length of consoles 200% and an increase of console asymmetry from 50% to 60%, a much shar-per decrease in the accuracy and confidence takes place (from 73% to 6%).
It should be noted that the above accuracy values of global alignments are much lower than the values given in previous papers (see, for example, [18]). This is explained by the fact that we analyze the sequences with consoles, whereas in the cited and some other papers only alignments of sequences homologous as a whole were considered.
When the evolutional distance between homologous regions of sequences continues to increase, this ten-dency becomes more pronounced. Thus, when the evo-lutional distance is 60 PAM, the total console length is 100% and the core shift changes from 50% to 70%, the accuracy value decreases from 87% to 30%, and the con-fidence value decreases from 85% to 29%. When the evolutional distance is 120 PAM, the total console length is 50% and the core shift changes from 40% to 60%, the accuracy value decreases from 67% to 38%, and the confidence value decreases from 64% to 36%. When the evolutional distance is 240 PAM and the console
(
ɚ
)
ab--cdefghzzk
abxxcdefgh--k
(b)
*---***abcdefghzzk****
****abxx-cdefghk**--**
(c)
***abcdefghzzk
abxx-cdefghk**
++++++
length is 50%, the accuracy and confidence values begin to decrease at a shift of 10%.
So, an increase in the evolutional distance between homologous regions of sequences causes a noticeable decrease in the quality of global alignment, a consider-able decrease of the quality of global alignment taking place at a decreasing length of consoles and a diminish-ing shift of the core from the center of sequences.
The entire records of the dependence of accuracy and confidence values on the three parameters are given in Additional File 2.
It is essential that at all considered values of PAM, length and asymmetry of consoles, there is no remark-able decrease in the quality of local alignment. In other words, in case of asymmetrical consoles, the local algo-rithm is more resistant to the increase in evolutional distance and console length than the global algorithm.
Thus, we can conclude that there exists somethreshold valueof the three parameters: extent of core homology,
total length of consoles and asymmetry of consoles. Prior to this value, the quality of the global alignment is higher than that of the local alignment, but above this value the global alignment quality decreases sharply, whereas the local alignment quality remains the same.
3.3. Determination of the“slope zone”
The plots in Figure 3 show that when the asymmetry of consoles cchanges from 0 to 100% (at fixed evolutional distances between cores and the total length of con-soles), the accuracy and confidence of global alignments decrease. In this case the decrease is sharp in a relatively narrow (~ 20%) range of c values; this range will be called the slope zone. In this section we will demon-strate how to predict theoretically where this area is. It will be accepted that the substitution weight matrix and gap penalties are fixed (see subsection 2.3).
LetPbe a pair of test sequences, Lker(P) be the aver-age length of cores of these sequences,Score (P) be the
Table 3 Accuracy and confidence of global and local alignment at symmetrical consoles
Evolutional distance, PAM Console length, % Global alignment Local alignment
Accuracy, % Confidence, % Accuracy, % Confidence,%
30 0 98.98 98.86 98.19 98.57
30 10 98.90 98.62 98.23 98.20
30 20 98.77 98.38 98.11 97.95
30 50 98.50 97.88 97.91 97.45
30 100 98.47 97.82 97.91 97.36
30 200 98.40 97.61 97.65 96.93
60 0 95.88 95.42 93.19 94.37
60 10 95.89 95.25 93.61 93.91
60 20 95.24 94.38 93.29 93.20
60 50 94.59 93.22 92.92 91.99
60 100 94.65 93.05 92.84 91.46
60 200 94.35 92.77 92.57 91.21
120 0 82.47 81.47 71.76 76.71
120 10 81.13 79.79 71.34 74.16
120 20 79.30 77.59 71.16 72.64
120 50 77.95 75.77 70.51 69.77
120 100 76.70 74.11 69.48 67.78
120 200 76.32 73.34 68.69 66.79
240 0 38.86 38.31 15.14 19.30
240 10 36.80 35.90 15.50 18.12
240 20 33.06 32.05 14.22 15.71
240 50 30.71 29.46 14.22 14.49
240 100 27.93 26.63 12.79 12.43
240 200 25.33 23.90 9.27 8.88
weight of reference alignment of cores for the consid-ered set. The densityof cores alignment for pair Pwill be the relation:
Dker(P)=Score(P)/Lker(P).
Let us consider one of the sets of test sequences described in subsection 2.1. Using DkerandLkerwe will
denote mean values:Dker(P) andLker(P), respectively, for the sequences in the set under discussion.
Then letLcon = r·Lkerbe the length of consoles, Dcon be the total average relation ofalignment weights of two independent random sequences of equal length to the
sequence length, c be the asymmetry of consoles (see the designations in subsection 2.1). Then the mean weightScoreglob of the reference alignment of a pair of test sequences generated by the scheme given in subsec-tion 2.1 with the pairsLker,PAM, r, andcis determined by the following equation:
Scoreglob=Lker·Dker+Lcon·Dcon·(1−c)−2·GEP·Lcon·c−2·GOP, (2)
where GOPandGEP are gap-open and gap-extension penalties.
By fixing all members in equation (2), except the asymmetry values c, we will get an equation for the A. PAM 30
Console length r = 100%
0 20 40 60 80 100
0 20 40 60 80 100
C, %
Accuracy, C
onfidence,
%
D. PAM 120
Console length r = 200%
0 20 40 60 80 100
0 20 40 60 80 100
C, %
Accuracy, Confidence
%
Glb.Accur.
Glb.Confid . Lcl.Accur.
Lcl.Confid.
B. PAM 30
Console length r = 200%
0 20 40 60 80 100
0 20 40 60 80 100
C, %
Accuracy, Confidence,
% Glb.Accur.
Glb.Confid.
Lcl.Accur.
Lcl.Confid.
C. PAM 120
Console length r = 100%
0 20 40 60 80 100
0 20 40 60 80 100
C, %
Accuracy, Confidence,
%
dependence of the mean weight of reference alignments Scoreglobversus the asymmetry of sequences c. Let us analyze the relation
Dglob(c) =Scoreglob(c)/(Lker+Lcon)
of the mean weight of reference alignments to the mean length of test sequences in a corresponding set. The Dglobvalue will be called the mean densityof
refer-ence alignments. Similarly, the mean density of random alignmentsDrandwill be the relation of the mean weight
of optimal alignment of two independent random sequences to the length of these sequences (see the details in subsection 3.4).
Computer experiments (see Figure 4) showed that a sharp decrease in the accuracy and confidence of global alignments takes place close to the asymmetry value c which is the root of equation
Dglob(c) =Drand (3)
A. PAM 30
Console length r = 100%
-2.00 -1.50 -1.00 -0.50 0.00 0.50 1.00 1.50
0 20 40 60 80 100
C, %
Accuracy, Score densit
y
B. PAM 30
Console length r = 200%
-2.00 -1.50 -1.00 -0.50 0.00 0.50 1.00 1.50
0 20 40 60 80 100
C, %
Accuracy, Score densit
y GlbAccur
Dglob
Drand
Dsw
C. PAM 120
Console length r = 100%
-2.00 -1.50 -1.00 -0.50 0.00 0.50 1.00
0 20 40 60 80 100
C, %
Ac
cu
rac
y,
Sc
ore dens
ity
D. PAM 120
Console length r = 200%
-2.00 -1.50 -1.00 -0.50 0.00 0.50 1.00
0 20 40 60 80 100
C, %
Accuracy, Score densit
y GlbAccur
Dglob
Drand
Dsw
Figure 4“Slope zone”of the Smith-Waterman global alignment and density of reference and random alignments. A, B - evolutional distance of 30PAM; C, D - evolutional distance of 120PAM. A, C - console length r = 100%; B, D - console length r = 200%. Mean densities of reference (Dglob) and random (Drand) alignments and mean accuracy of Smith-Waterman global alignments (Glb.Accur) versus the asymmetry
value of consolescat evolutional distances 30 and 120PAM and consoles of 100% and 200% length of the core length of the sequences. The intersection of straight lines - plots of theDglobandDrandvalues corresponds to the beginning of the“slope zone”of the accuracy plot (see also
Fig. 3). Densities of Smith-Waterman global alignments are given for comparison. Here the intersection of plots forDglobandDrandvalues is
typically close to the point where the plot forDswpasses the zero value. At rather highcvalues the density of algorithmic global alignments
(here the length of random sequences is Lker+Lcon). In
other words, it is impossible to restore the reference alignment if its weight does not (almost) differ from the alignment weight of random sequences. Using theLker,
PAM, r values, the above stated allows us to roughly determine the range of asymmetry valuescat which the quality of global alignment decreases.
3.4. Determination of density of random alignments
To find the Drand value, we determined the weight
dependence of two random sequences versus their length (see Figure 5). Pairs of random sequences from 10 to 600 a.a. were obtained according to the procedure described in subsection 2.1.2. The pairs were aligned using the global version of Smith-Waterman algorithm with the substitution weight matrix PAM250 and gap-open and gap-extension penalties GOP = 14, GEP = 2.
As seen from Figure 5, the lowest density corresponds to the shortest sequences of 10 a.a. and is -0.858. Let us mention for comparison that for the substitution weight matrix PAM250 and the amino acid frequency distribu-tion from [19] the mean weight of symbol comparison is -0.863, which is estimated by the formula:
i=1..nPi
j=1..nPjSij,
where Piis the probability of appearance of the i-th amino acid residue andSijis the substitution weight.
3.5. Comparison with other algorithms
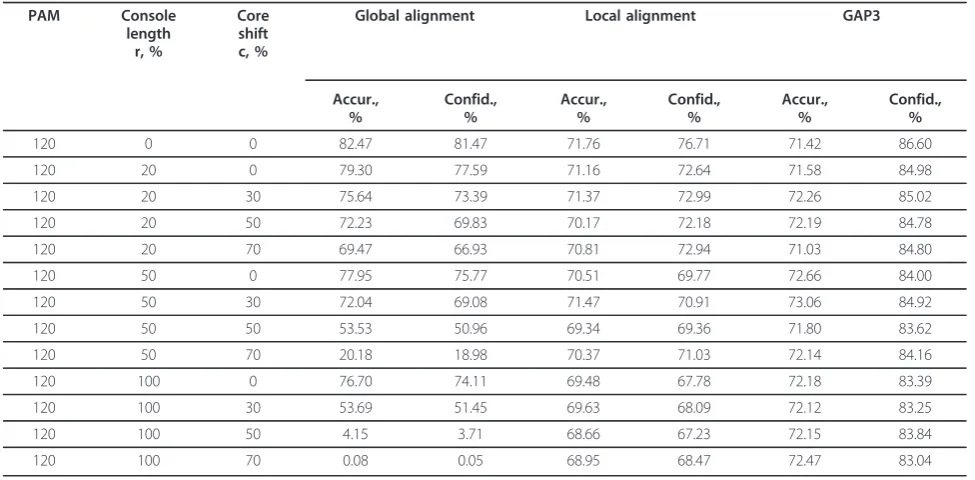
Additionally, we compared three algorithms: Needle-man-Wunsch [1], Smith-Waterman [2] and GAP3 [5]. A generalized global alignment algorithm (GAP3) is a development of the standard Needleman-Wunsch dynamic programming algorithm designed for compar-ing sequences with intermittent similarities, an ordered list of similar regions separated by different regions. (In difference to the algorithm given in [1], the algorithm described in [5] besides the usual weight substitution matrix and gap-open and gap-extension penalties, requires an additional parameter - constant penalty for each difference block.)
A comparison test was carried out on thirteen sets of 1,000 pairs of sequences each with the following para-meters (2.1.1): 1) evolutionary distance from a common ancestor to the sequence coresPAM= 120 PAM; 2) the ratio of the total length of consoles to the length of the common ancestor of sequence coresr= 20, 50, 100%; 3) the ratio of the absolute value of the difference between console lengths to their total lengthc= 0, 30, 50, 70%.
We used the GAP3 program available online (http:// deepc2.psi.iastate.edu/aat/gap3/), with matrix PAM250, and gap-open and gap-extension penalties equal to 14 and 2 and constant penalty for each difference block equal to 40. The results of comparison are shown in Table 4.
The table shows that in comparison with Smith-Waterman local alignment, in all cases the GAP3 align-ment benefits slightly in Accuracy, but advantage in Confidence is significantly larger (it means that GAP3 makes a little more correct matches than the first algo-rithm, making fewer false matches).
As for comparison with global Needleman-Wunsch alignments, in the case without consoles the GAP3 alignments have a much lower Accuracy and a slightly higher Confidence. For symmetric consoles simulta-neously with increase in their length (Core shift = 0, Console length = 20,...,100%), this tendency is reduced and becomes less prominent. It was mentioned above that as a result of the displacement of the cores of aligned sequences in the opposite direction from the center, the reliability of the global alignment is markedly reduced. However, a local alignment has no such a ten-dency. As shown, at the evolutionary distance of 120PAM, the GAP3 alignment is not only resistant to displacement, but also resistant to increasing the length of nonhomologous consoles.
4. Conclusion
The study has revealed regularities allowing for defining more exactly the areas of effective application of every algorithm: when consoles are positioned symmetrically, the global algorithm is more resistant to increasing
Alignment of random sequences:
Density vs. Length
-1.0 -0.8 -0.6 -0.4 -0.2 0.0
0 100 200 300 400 500 600
Length
Density
evolutional distance and console length than the local algorithm (about 10% accuracy and about 8% confidence at 120PAM and up to 20% accuracy and confidence at 240PAM); quite the opposite, when consoles are asym-metrical, the local algorithm is more resistant to increas-ing evolutional distance and console length than the global algorithm. The boundary of the global algorithm preference is determined roughly by the value of asym-metrical position of homologous fragments of sequences (cores) at which the reference alignment density is almost equal to the density of random sequence align-ment. The mean divergence of 5 ÷ 10%, which is typical both of accuracy and confidence of global and local alignments at a symmetrical position of cores, precondi-tions the developing of a combined method for making a more reliable alignment.
Additional material
Additional File 1: Substitution matrix and open and gap-extension penalties test for optimal global alignment. Accuracy and Confidence values for global alignments versus the following: (1) evolutional distance between sequences (PAM); (2) substitution matrix; (3) gap open and gap extension penalties (GOP, GEP).
Additional File 2: Dependence of accuracy and confidence values on three parameters (PAM,r, andc). Accuracy and Confidence values for global and local alignments versus the following: (1) evolutional distance between homologous fragments of sequences (PAM); (2) console length (r); (3) console asymmetry (core shift,c).
Acknowledgements
This work has been supported by a grant from the Presidium of the Russian Academy of Sciences (Molecular and Cell Biology Program), grants 08-01-92496 and 09-04-01053 from RFBR, grant 2011-07.514.11.4006 from MESRF and Russian-French Scientific Exchange Program.
Author details
1Engelhardt Institute of Molecular Biology, RAS, 119991, Moscow, Russia. 2
Institute of Mathematical Problems in Biology, RAS, 142290, Pushchino, Russia.
Authors’contributions
VOP performed all computations, participated in planning the research and wrote the manuscript. MAR and VGT designed the study and contributed to the manuscript. All authors fulfilled the analysis of the results, read and approved the final manuscript.
Competing interests
The authors declare that they have no competing interests.
Received: 31 December 2010 Accepted: 27 October 2011 Published: 27 October 2011
References
1. Needleman SB, Wunsch CD:A general method applicable to the search of similarity in the amino-acid sequence of two proteins.J Mol Biol1970,
48:443-453.
2. Smith TF, Waterman MS:Identification of common molecular subsequences.J Mol Biol1981,147:195-197.
3. Altschul SF, Gish W, Miller W, Myers E, Lipman DJ:Basic local alignment search tool.J Mol Biol1990,215:403-410.
4. Lipman DJ, Pearson WR:Rapid and sensitive protein similarity searches.
Science1985,227:1435-1441.
5. Huang X, Chao KM:A generalized global alignment algorithm.
Bioinformatics2003,19:228-233.
6. Huang X, Brutlag DL:Dynamic use of multiple parameter sets in sequence alignment.Nucleic Acids Res2007,35:678-686.
Table 4 Accuracy and confidence of global, local and GAP3 alignment at various consoles
PAM Console length
r, %
Core shift c, %
Global alignment Local alignment GAP3
Accur., %
Confid., %
Accur., %
Confid., %
Accur., %
Confid., %
120 0 0 82.47 81.47 71.76 76.71 71.42 86.60
120 20 0 79.30 77.59 71.16 72.64 71.58 84.98
120 20 30 75.64 73.39 71.37 72.99 72.26 85.02
120 20 50 72.23 69.83 70.17 72.18 72.19 84.78
120 20 70 69.47 66.93 70.81 72.94 71.03 84.80
120 50 0 77.95 75.77 70.51 69.77 72.66 84.00
120 50 30 72.04 69.08 71.47 70.91 73.06 84.92
120 50 50 53.53 50.96 69.34 69.36 71.80 83.62
120 50 70 20.18 18.98 70.37 71.03 72.14 84.16
120 100 0 76.70 74.11 69.48 67.78 72.18 83.39
120 100 30 53.69 51.45 69.63 68.09 72.12 83.25
120 100 50 4.15 3.71 68.66 67.23 72.15 83.84
120 100 70 0.08 0.05 68.95 68.47 72.47 83.04
7. Wallqvist A, Fukunishi Y, Murphy LR, Fadel A, Levy RM:Iterative sequence secondary structure search for protein homologs: Comparison with amino acid sequence alignments and application to fold recognition in genome databases.Bioinformatics2000,16:988-1002.
8. Litvinov II, Lobanov MI, Mironov AA, Finkelstein MA:Information on the secondary structure improves the quality of protein sequence alignment.Molecular Biology2006,40:474-480.
9. Doolittle RF:Similar amino acid sequences: chance or common ancestry?
Science1981,214:149-159.
10. Alexander PA, He Y, Chen Y, Orban J, Bryan PN:A minimal sequence code for switching protein structure and function.Proc Natl Acad Sci USA2009,
106:21149-21154.
11. Vingron M, Argos P:Determination of reliable regions in protein sequence alignments.Prot Eng1990,3:565-569.
12. Mevissen HT, Vingron M:Quantifying the local reliability of a sequence alignment.Prot Eng1996,9:127-132.
13. Schlosshauer M, Olsson M:A novel approach to local reliability of sequence alignments.Bioinformatics2002,6:847-854.
14. Vogt G, Etzold T, Argos P:An assessment of amino acid exchange matrices in aliging protein sequences: the twilight zone revisited.J Mol Biol1995,249:816-831.
15. Domingues FS, Lackner P, Andreeva A, Sippl MJ:Structure-based evaluation of squence coparison and fold recognition alignment accuracy.J Mol Biol2000,297:1003-1013.
16. Sunyaev SR, Bogopolsky GA, Oleynikova NV, Vlasov PK, Finkelstein AV, Roytberg MA:From analysis of protein structural alignments toward a novel approach to align protein sequences.Proteins: Structure, Function and Bioinforrmatics2004,54:569-582.
17. Polyanovskii VO, Demchuk EY, Tumanyan VG:Efficiency of alignment procedure in respect of reconstruction reliability.Molecular Biology1995,
28:833-835.
18. Polyanovsky V, Roytberg MA, Tumanyan VG:Reconstruction of genuine pair-wise sequence alignment.J Comp Biol2008,15:379-391. 19. Dayhoff M, Schwartz R, Orcutt B:A model of evolutionary change in
proteins.InAtlas of protein sequence and structure.Edited by: Dayhoff M. Washington: National Biomedical Research Foundation; 1978:345-352. 20. Benner SA, Cohen MA, Gonnet GH:Empirical and structural models for
insertions and deletions in the divergent evolution of proteins.J Mol Biol
1993,229:1065-1082.
21. Reese JT, Pearson WR:Empirical determination of effective gap penalties for sequence comparison.Bioinformatics2002,18:1500-1507.
22. Waterman MS:Mathematical methods for DNA sequencesBoca Raton, Florida: CRC Press, Inc; 1989.
doi:10.1186/1748-7188-6-25
Cite this article as:Polyanovskyet al.:Comparative analysis of the quality of a global algorithm and a local algorithm for alignment of two sequences.Algorithms for Molecular Biology20116:25.
Submit your next manuscript to BioMed Central and take full advantage of:
• Convenient online submission
• Thorough peer review
• No space constraints or color figure charges
• Immediate publication on acceptance
• Inclusion in PubMed, CAS, Scopus and Google Scholar
• Research which is freely available for redistribution