S H O R T R E P O R T
Open Access
ViSEAGO: a Bioconductor package for
clustering biological functions using Gene
Ontology and semantic similarity
Aurélien Brionne
*†, Amélie Juanchich
†and Christelle Hennequet-Antier
†* Correspondence: aurelien.brionne@inra.fr
†Aurélien Brionne, Amélie Juanchich
and Christelle Hennequet-Antier contributed equally to this work. BOA, INRA, Université de Tours, 37380 Nouzilly, France
Abstract
The main objective ofViSEAGOpackage is to carry out a data mining of biological functions and establish links between genes involved in the study. We developed ViSEAGOin R to facilitate functional Gene Ontology (GO) analysis of complex experimental design with multiple comparisons of interest. It allows to study large-scale datasets together and visualize GO profiles to capture biological knowledge. The acronym stands for three major concepts of the analysis:Visualization,Semantic similarity andEnrichmentAnalysis ofGeneOntology. It provides access to the last current GO annotations, which are retrieved from one of NCBI EntrezGene, Ensembl or Uniprot databases for several species. Using available R packages and novel developments,ViSEAGOextends classical functional GO analysis to focus on functional coherence by aggregating closely related biological themes while studying multiple datasets at once. It provides both a synthetic and detailed view using interactive functionalities respecting the GO graph structure and ensuring functional coherence supplied by semantic similarity.ViSEAGOhas been successfully applied on several datasets from different species with a variety of biological questions. Results can be easily shared between bioinformaticians and biologists, enhancing reporting capabilities while maintaining reproducibility. ViSEAGO is publicly available onhttps://bioconductor.org/packages/ViSEAGO.
Keywords:Gene ontology, Functional genomics, Visualization, Cluster analysis, Semantic similarity, Annotation, Enrichment test
Introduction
Large -omic datasets are nowadays easily produced. While bioinformatical and biostat-istical data analyses are quite robust, functional analysis remains a critical step of these high-throughput studies. One essential resource for such analysis is Gene Ontology (GO) [1,2], that provides an unified vocabulary to describe gene functions (GO terms) and relations between them in three categories: biological processes (BP), molecular functions (MF) and cellular components (CC). GO annotation represents the associ-ation between a gene and a GO term. For each category, GO is structured in a graph, where each GO term is a node and edges are relations between GO terms. GO term annotations including GO acyclic graph and GO terms association tables are currently maintained and improved in major databases. However, depending on the database be-ing used, there are important differences between supported species and correspondbe-ing
© The Author(s). 2019Open AccessThis article is distributed under the terms of the Creative Commons Attribution 4.0 International
genes knowledge. This has a strong impact on GO annotations, enrichment tests and downstream analyses [3]. This statement is clearly illustrated in Fig. 1 with available annotations for three golden standard models such as human, mouse, zebrafish and five livestock species such as cow, chicken, pig, sheep and rabbit. Numbers of GO annota-tions by category (MF, BP and CC) vary between databases and between species within database for the eight selected vertebrate species. Globally, GO annotations are more inferred computationally for all species, but experimental annotations represent a good part of human and mouse annotations (Fig. 1). Ensembl database contains more annotations than NCBI especially for livestock species due to the use of Ensembl Compara annotation pipeline, which increases the number of terms based on the projection of manually annotated GO terms with experimental evidence type from orthologous genes [4].
Functional enrichment analysis consists in finding which GO terms are significantly over-represented using GO annotations. Several algorithms and tools for functional en-richment test have been developed [5]. High-throughput studies produce large-scale lists of enriched GO terms, especially in the context of multi-factor experiments. The aim of functional analysis is then to explore lists of GO terms and facilitate biological interpret-ation. The GO graph provides meaningful links between GO terms, based on the various relationships (is_a, part_of, related_to, regulates…). Closest GO terms in the graph share high semantic similarity (SS) and also functional meaning. Indeed, SS is based on the like-ness of meaning between biological features. In the last decade, many tools have been de-veloped to compute SS between GO terms and sets of GO terms [6, 7] in different biological applications. SS methods are divided into three categories: those only based on term frequency in a corpus (IC-based, like Resnik’s method [8]), those only based on hier-archical relationships between terms (graph-based like Wang’s method [9]), and those
based on hybrid method (like GOGO algorithm [10]). To our knowledge, several tools are implemented to run enrichment tests combined to a downstream analysis that organized the output (using semantic similarity or other algorithms). Surprisingly, only few tools provide support for visualization of lists of GO terms and easier biological interpretation (Table1) [11–15]. We developedViSEAGOto carry out a data mining of biological func-tions supported by GO terms and establish links between terms and genes involved in the scientific study. The acronym stands for three major concepts used in the package (Fig.2):
Visualization, Semantic similarity and Enrichment Analysis of Gene Ontology (ViSEAGO). By using last current GO annotations, users can at once easily perform mul-tiple enrichment tests on large datasets from complex experimental design. It provides in-teresting functionalities to organize biological functions into clusters by using GO semantic similarity, an adapted distance computations between GO terms.ViSEAGO cap-tures functional similarity based on GO annotations by respecting the topology of GO terms in the GO graph. Hence, it allows enhancing classical functional GO analysis (Table
1). Moreover, through an user-friendly package developed in R language, it facilitates bio-logical interpretation, supported by GO annotations, using several visualizations, like den-drogram of GO terms, MDS of GO terms, heatmap of enrichmentp-values. It allows data mining of GO terms at different scales, from one term to cluster of GO terms and eventu-ally groups of clusters.
Based on the topology of the GO graph, thanks to the use of semantic similarity, it allows to look for functional coherence in large dataset and to establish relationships between genes and functions. We demonstrate its use with publicly available RNA-seq datasets (mouse and chicken) and MeDIP dataset (cattle) with different annotation databases.
Methods
ThroughViSEAGO, a functional analysis is conducted using the following steps: reading one or multiple lists of genes of interest associated with a reference gene set (i.e. gene back-ground) and loading the last current GO terms’annotations from selected database in section
“GOannotation”, performing functional enrichment tests in section“EnrichmentAnalysis”, computing semantic similarity and visualizing clusters of GO terms in section“Visualization &Semantic similarity”(Fig.2).ViSEAGOoffers the advantage of performing all analyses in the same statistical environment R, from DE genes identification to the discovery of bio-logical functions of interest. Although the package was developed with differential expression analysis in mind, it can be used with any list of genes, proteins or genomic features.
Loading experimental data and GO annotations
First, the selected genes of interest, i.e. differentially expressed genes (DE), are divided into one or more lists of genes depending on experimental design. The reference list can be cus-tomized. In the case of differential analysis, the reference list will be the list of all expressed genes. We highly recommend to perform functional analysis with all genes of interest (i.e. without threshold on fold change) to maintain a continuum between underlying biological functions. Depending on species and databases, GO term annotations are then performed on these lists of genes with category BP, MF or CC. Available species (animals, plant, fungi, bacteria...) can be displayed from the selected database withViSEAGO::available_organisms
Table 1 Description of functionalities supported by different tools focused on bi ological interpretation from GO annotation Tool Interf ace, Lan gage GO Anno tation Database Input ident ifiers for GO anno tation Enrichm ent test GO term s SS Se ts of GO te rms SS Visualizat ion Mult iple lists Gra ph interac tivity David https ://david.ncifcrf.
gov/ [11
Last current GO annotations are extracted at a given time by querying NCBI EntrezGene, Ensembl or Uniprot databases to ensure reliable functional analysis (Fig. 2, Section“GO Annotation”). To re-use data and reproduce analyses,ViSEAGOallows the use of older ver-sions of some databases.
Functional enrichment analysis
ViSEAGO addresses the problem of functional analysis in the context of complex ex-perimental designs and large lists of genes of interest. Functional enrichment tests are
Fig. 2Illustrated ViSEAGO package. A complete ViSEAGO analysis is presented from annotation of lists of features, enrichment tests to organization and viszualisation of GO terms thanks to semantic similarity. In
performed for each list of genes of interest compared to the gene background. No threshold is applied and results are combined together. The most popular test to per-form a functional enrichment analysis is the Fisher’s exact test [5]. P-values measure the degree of independence between belonging to the GO term and being enriched. They are unadjusted for multiple testing in this exploratory context. ViSEAGOoffers all statistical tests and algorithms developed in the Bioconductor topGO R package [16], taking into account the topology of GO graph by using ViSEAGO::create_topGO-data method followed by thetopGO::runTest method. A table of results that summa-rizes functional enrichment tests performed for each list of genes is built using
ViSEAGO::merge_enrich_termsmethod. The number of enriched GO terms is displayed in a barchart plot using ViSEAGO::GOcount. The number of GO terms overlapping between lists of interest is also available in the upset plot with ViSEAGO::Upset(Fig.2, Section “Enrichment Analysis”). Thus, ViSEAGO allows comparison of biological functions associated with each list of enriched GO terms in the study. Users can inter-actively sort the table of results byp-values or query by GO term.
Semantic similarity between GO terms and sets of GO terms
Exploring hundreds of statistically significant GO terms in a“flat”table can be challen-ging in a complex study with multiple conditions. To catch the group structure from the GO terms data, the choice of measure of similarity between pairs of GO terms is a key criterion. ViSEAGO offers therefore several methods based on semantic similarity (SS) to group together enriched GO terms according to their annotation and their topological position in the GO graph. The ViSEAGO::compute_SS_distance method is based on the BioconductorGOSemSimR package [17] which implements the five com-mon SS methods between GO terms. Four of the SS algorithms use the information content of a GO term (IC), which is computed as the negative log probability of occur-rence of the term in a set of GO terms. A rarely used term contains a greater amount of IC. A Graph-based method as the Wang’s method is also available to compute SS be-tween two GO terms based on the topology of GO graph. The Wang’s method method maintains topology of the GO graph throughout analyses. GO terms are organized into clusters to capture functional coherence in the study before analyzing their enrichment
p-values.
The ViSEAGO::compute_SS_distance method also computes four distance calcula-tions between sets of GO terms [17], including the Best-Match Average (BMA) method which appears to be the best combination approach [18]. BMA calculates the average of all maximum similarities over all pairs of GO terms between two GO term sets, averaged with its reciprocal to obtain a symmetric similarity [18,19].
Visualization of clusters of GO terms
a hierarchical clustering creates clusters of enriched GO terms respecting the GO graph structure with ViSEAGO::GOterms_heatmap method. An appropriate dissimilarity be-tween enriched GO terms based on SS and an aggregation criterion for the clustering are chosen to reflect the functional coherence of the analysis. Clusters of enriched GO terms are produced by cutting the dendrogram in a static or dynamic mode developed in dynamicTreeCut R package [20]. In addition to the dendrogram of GO terms with their description, a heatmap plot is produced with -log10(p-value) from functional enrichment test(s) and IC value. The organization of enriched GO terms into clusters respecting the GO graph topology is entirely supported by the dendrogram and enriched by the results of the functional enrichment tests of the study and completed by the value of IC. This clever combination ensures functional coherence and facilitates biological interpretation. In this way, GO terms within the same cluster share similar biological functions.
To gain further insights, relationships between sets of GO terms can be explored using a similar approach. Similarities between sets of GO terms defined by SS are ex-plored using a MDS plot generated withViSEAGO::MDSplotmethod. Then, sets of GO terms are organized in a colored dendrogram and grouped into clusters using
ViSEAGO::GOclusters_heatmapmethod. In addition to the dendrogram, the sets of GO terms are renamed by their first common GO term ancestor and a heatmap of the number of GO terms in each set is produced.
Reporting and interactivity
Traceability is ensured by recording major used parameters and results at each step of the analysis.ViSEAGOprovides interesting functionalities to explore the table of results according to p-values from enrichment tests and semantic similarity through GO clusters. Moreover, interactive functionalities implemented thanks to plotly R package [21] allow a visualization of biological themes at different scales.
Results
ViSEAGOpackage has been applied to three biological cases to illustrate its functional-ities. All functions and specific parameters used for the three cases are specified in additional file 1.
Case 1: role of alveolar luminal cells in the mouse mammary gland during pregnancy
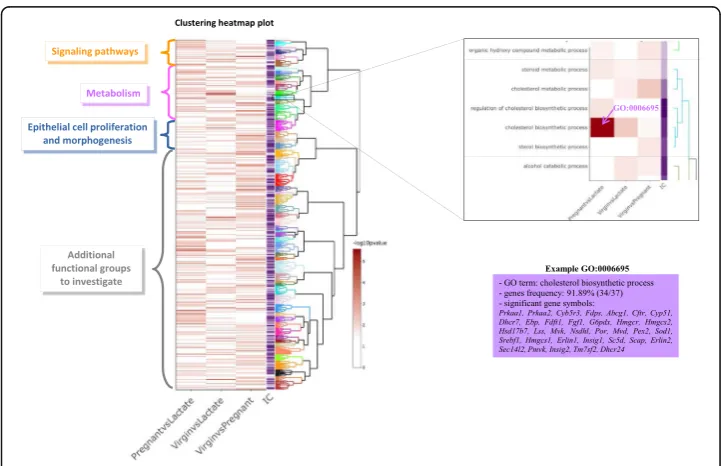
843 genes are annotated with at least one BP GO term. Enrichment tests revealed re-spectively 198, 151, and 232 BP enriched GO terms for the three comparisons (p-value < 0.01). A clustering heatmap plot (Fig. 3) using SS distance based on Wang’smethod between enriched GO terms and ward.D2 aggregation criterion allows to data mine GO terms and capture biological meaning. Enriched GO terms are organized in the dendrogram and branches are colored depending on their cluster assignation. Extract-ing biological insights from this plot highlights three major pathways: signalExtract-ing path-ways, metabolism, and epithelial cell proliferation and morphogenesis. Those pathways are already discussed in the original publication [8], but ViSEAGO highlighted other in-teresting groups revealing biological pathways to further investigate. It also pinpoints, using interactive cluster-heatmap zooming capabilities, cholesterol biosynthetic process (GO:0006695) as the most significantly enriched GO term (p-value 2.6 10−06 and gene frequency 34/37).
Case 2: functional genomics of the digestive tract in broilers
The aim of the study [24] was to gather knowledge on genes involved in digestive functions in the context of the adaptive capacity of the broilers to changing and even unfavorable dietary conditions. The transcriptome was performed on four digestive tract segments representing the digestive efficiency process (Bioproject accession number PRJNA418230). Differentially expressed genes were identified between the four digestive tract segments by fitting a generalized linear model with edgeR package [23]. Then, DE genes were organized in seven gene clusters to focus on co-regulated genes throughout the digestive tract and their functions. Enrichment tests were performed withViSEAGOpackage independently for each gene cluster containing at least 300 DE
Fig. 3Visualization of ViSEAGO’s functional analysis from mouse RNA-seq with three different transcriptomic datasets. Clustering heatmap plot that combines a dendrogram based on Wang’s semantic similarity distance and
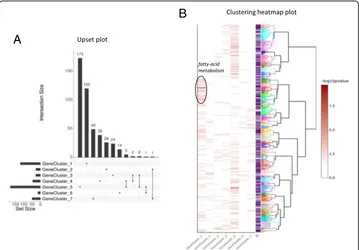
genes up to more than 3000. Annotation by GO for BP was used and Fisher’s exact test with the elim algorithm was performed [16]. This algorithm improves the enrichment analysis by taking into account local dependencies between GO terms in GO graph, especially in the case of large data sets. Among the 12,656 expressed genes, 7159 possessed at least one functional GO term in the Ensembl version 94 database (56%). Although functional annotation of the chicken genome remains poor in comparison to model species such as the mouse, functional analysis is still relevant using orthologous relationships with well-annotated species. A total of 456 GO terms were enriched (p-value < 0.01) in at least one gene cluster and, among them, 445 were unique (Fig. 4a). This shows that gene clusters are driven by specific functions. The num-ber of enriched GO terms for each gene cluster ranged from 15 to 181, which is mentioned in the output from ViSEAGO::merge_enrich_terms method, ensuring traceability of enrichment tests. Results reported in a summary table can be easily and interactively investigated by term (like cholesterol, transport, immune system...) and sorted by p-values. Exploring hundreds of statistically significant GO terms in a “flat” table can be challenging in a complex study with multiple conditions. Hence,ViSEAGO provides an interactive graphic support to facilitate biological in-terpretation. Semantic similarity between GO enriched terms are computed using Wang’s SS method to connect together related GO terms by their annotation and position in the GO graph. Enriched GO terms are organized in a dendrogram built from a hierarchical clustering using ViSEAGO::GOterms_heatmap based on SS dis-tance between enriched GO terms and ward.D2 aggregation criterion (Fig. 4b). This interactive visualization allows the user to discover at a glance the general
A
B
data structure of GO terms and to find out best functions that will explain the di-gestive efficiency process. For instance, clear groups of organized GO terms related to fatty-acid metabolism are found in the intestine (Fig. 4b). Those functions are essential in the intestine and must work properly for effective digestion.
Case 3: Hypomethylation in bull sperm targets specific genomic functions
We re-used and re-analyzed Methylated DNA immunoprecipitation (MeDIP) dataset provided by [25] to explore ViSEAGO’s functionalities and focus on relationships be-tween sets of GO terms (Gene Expression Omnibus database accession number GSE102960). One aim of the study was to identify hypomethylated CpGs genomic re-gions and their associated functions from MeDIP datasets in bull sperm in comparison to bovine somatic cells (fibroblasts and liver cells).
Among the 1632 and 3109 hypomethylated regions identified in bull sperm in com-parison to fibroblast (FvsS comcom-parison) and liver (LvsS comcom-parison) cells respectively, 732 and 1229 unique genes with a match in regulatory elements (promoter: -1 kb to + 0.1 kb along TSS; downstream: + 1 kb along TES) have been identified using Genome-Features R package (https://forgemia.inra.fr/aurelien.brionne/GenomeFeatures).
Using Fisher’s exact test, we performed enrichment tests of GO terms associated with BP category and retrieved GO annotation from Ensembl version 81 (version used by the authors). We identified 91 enriched GO terms for FvsS comparison and 53 for LvsS comparison (p-value < 0.01). Thirty of the enriched GO terms are shared by the two lists. Several GO terms were already found in the original paper ([25], Fig.4) and linked to mRNA processing and spermatogenesis (Fig. 5a). For instance, piRNA metabolic process (GO:0034587) was found with an enrichment p-value of 0.026 and is also iden-tified in our study with a p-value of 0.0018 (Fig. 5a, cluster cl3). This enrichment is supported by 4 genes (ASZ1, PLD6, PIWIL2, MAEL) including two out of three already identified (PLD6, MAEL), and reported in the results table (not shown). In comple-ment, we highlighted several GO terms that were not previously found in the study (Fig. 5a) to allow a deeper analysis of the datasets. For instance, the GO term“cellular process involved in reproduction in multicellular organism”(GO:0022412) is the most significant term in both comparisons (1.07 10−07 and 6.76 10−06 for FvsS and LvsS respectively).
ViSEAGO, we revealed three major functions involved in the study without losing information at the GO term level.
Conclusions
Functional enrichment analysis remains a major challenge especially on large datasets and complex experimental designs.ViSEAGOR package is a generic tool for functional analysis based on Gene Ontology that meets this challenge. The novelty ofViSEAGOis providing by the association of the semantic similarity and visualization to focus on biological interpretation with respect for GO graph. ViSEAGO’s functionalities are extended compared to most functional analysis tools in three major aspects: (1) emphasize functional coherence by aggregating closely related biological themes based on the GO graph topology; (2) reliability of the functional interpretation using the last current GO annotations; (3) interactive visualization both synthetic and detailed to facilitate biological interpretation. At the end,ViSEAGOhelps users to perform a repro-ducible functional analysis and to prioritize genes to investigate.
Abbreviations
BMA:Best-match average; BP: Biological process; CC: Cellular component; DE: Differentially expressed; GO: Gene ontology; IC: Information content; MDS: Multi-Dimensional Scaling; MeDIP: Methylated DNA ImmunoPrecipitation; MF: Molecular function; RNA: RiboNucleic Acid; SS: Semantic similarity; TES: Transcription end site; TSS: Transcription start site
A
B
C
Fig. 5Visualization of ViSEAGO’s functional analysis from cattle with three MeDiP datasets.aClustering heatmap plot combining a dendrogram based on Wang’s semantic similarity distance andward.D2
Acknowledgments
We would like to thank biologists who facilitated re-use of their data by describing metadata and providing useful de-tails on analyses. Authors appreciated feedback and support from members of UMR BOA at INRA.
Authors’contributions
AB, AJ and CHA conceived the project. AB conceived the R package. AB, AJ and CHA refined the proposed package. AB, AJ and CHA analyzed data and interpreted results. CHA wrote the first draft of the manuscript. AB and AJ made changes and additions to the manuscript. All authors read and approved the final manuscript.
Funding
The authors received no specific funding for this work.
Availability of data and materials
Upon publication,ViSEAGOR package will be freely available on Bioconductor:https://bioconductor.org/packages/ViSEAGO.
Ethics approval and consent to participate
Not applicable.
Consent for publication
Not applicable.
Competing interests
The authors declare that they have no competing interests.
Received: 19 February 2019 Accepted: 25 July 2019
References
1. Ashburner M, Ball CA, Blake JA, Botstein D, Butler H, Cherry JM, Davis AP, Dolinski K, Dwight SS, Eppig JT, et al. Gene ontology: tool for the unification of biology. Nat Genet. 2000;25:25.
2. The Gene Ontology Consortium. Expansion of the gene ontology knowledgebase and resources. Nucleic Acids Res. 2017;45(D1):D331–8.
3. Tomczak A, Mortensen JM, Winnenburg R, Liu C, Alessi DT, Swamy V, Vallania F, Lofgren S, Haynes W, Shah NH, et al. Interpretation of biological experiments changes with evolution of the gene ontology and its annotations. Sci Rep. 2018;8.
4. Huntley RP, Sawford T, Mutowo-Meullenet P, Shypitsyna A, Bonilla C, Martin MJ, O'Donovan C. The GOA database: gene ontology annotation updates for 2015. Nucleic Acids Res. 2015;43(D1):D1057–63.
5. Rivals I, Personnaz L, Taing L, Potier M-C. Enrichment or depletion of a GO category within a class of genes: which test? Bioinformatics. 2007;23(4):401–7.
6. Pesquita C. Semantic similarity in the gene ontology. In: Dessimoz C,Škunca N, editors. The gene ontology handbook. New York, NY: Springer New York; 2017. p. 161–73.
7. Mazandu GK, Mulder NJ. Information content-based gene ontology semantic similarity approaches: toward a unified framework theory. Biomed Res Int. 2013;2013:11.
8. Philip R. Semantic similarity in a taxonomy: an information-based measure and its application to problems of ambiguity in natural language. J Artif Intell Res. 1999;11:95–130.
9. Wang JZ, Du Z, Payattakool R, Yu PS, Chen C-F. A new method to measure the semantic similarity of GO terms. Bioinformatics. 2007;23(10):1274–81.
10. Zhao C, Wang Z. GOGO: an improved algorithm to measure the semantic similarity between gene ontology terms. Sci Rep. 2018;8(1):15107.
11. Huang DW, Sherman BT, Lempicki RA. Systematic and integrative analysis of large gene lists using DAVID bioinformatics resources. Nat Protoc. 2008;4:44.
12. Huang DW, Sherman BT, Lempicki RA. Bioinformatics enrichment tools: paths toward the comprehensive functional analysis of large gene lists. Nucleic Acids Res. 2009;37(1):1–13.
13. Yu G, Wang L-G, Han Y, He Q-Y. clusterProfiler: an R package for comparing biological themes among gene clusters. OMICS. 2012;16(5):284–7.
14. Reimand J, Arak T, Adler P, Kolberg L, Reisberg S, Peterson H, Vilo J. G:profiler—a web server for functional interpretation of gene lists (2016 update). Nucleic Acids Res. 2016;44(W1):W83–9.
15. Supek F, Bošnjak M,Škunca N,Šmuc T. REVIGO summarizes and visualizes long lists of gene ontology terms. PLoS One. 2011;6(7):e21800.
16. Alexa A, Rahnenfuhrer J, Lengauer T. Improved scoring of functional groups from gene expression data by decorrelating GO graph structure. Bioinformatics. 2006;22(13):1600–7.
17. Yu GC, Li F, Qin YD, Bo XC, Wu YB, Wang SQ. GOSemSim: an R package for measuring semantic similarity among GO terms and gene products. Bioinformatics. 2010;26(7):976–8.
18. Pesquita C, Faria D, Bastos H, Ferreira AE, Falcão AO, Couto FM. Metrics for GO based protein semantic similarity: a systematic evaluation. BMC Bioinformatics. 2008;9(5):S4.
19. Schlicker A, Domingues FS, Rahnenführer J, Lengauer T. A new measure for functional similarity of gene products based on gene ontology. BMC Bioinformatics. 2006;7(1):302.
20. Langfelder P, Zhang B, Horvath S. Defining clusters from a hierarchical cluster tree: the dynamic tree cut package for R. Bioinformatics. 2008;24(5):719–20.
22. Fu NY, Rios AC, Pal B, Soetanto R, Lun ATL, Liu K, Beck T, Best SA, Vaillant F, Bouillet P, et al. EGF-mediated induction of Mcl-1 at the switch to lactation is essential for alveolar cell survival. Nat Cell Biol. 2015;17(4):365.
23. McCarthy DJ, Chen YS, Smyth GK. Differential expression analysis of multifactor RNA-Seq experiments with respect to biological variation. Nucleic Acids Res. 2012;40(10):4288–97.
24. Juanchich A, Hennequet-Antier C, Cabau C, Le Bihan-Duval E, Duclos MJ, Mignon-Grasteau S, Narcy A. Functional genomics of the digestive tract in broilers. BMC Genomics. 2018;19(1):928.
25. Perrier J-P, Sellem E, Prézelin A, Gasselin M, Jouneau L, Piumi F, Al Adhami H, Weber M, Fritz S, Boichard D, et al. A multi-scale analysis of bull sperm methylome revealed both species peculiarities and conserved tissue-specific features. BMC Genomics. 2018;19(1):404.
Publisher’s Note