Open Access
Research
An image processing approach to computing distances between
RNA secondary structures dot plots
Tor Ivry
1, Shahar Michal
1, Assaf Avihoo
1, Guillermo Sapiro
2and
Danny Barash*
1Address: 1Department of Computer Science, Ben-Gurion University, Beersheba, Israel and 2Department of Electrical and Computer Engineering, University of Minnesota, Minneapolis, USA
Email: Tor Ivry - [email protected]; Shahar Michal - [email protected]; Assaf Avihoo - [email protected]; Guillermo Sapiro - [email protected]; Danny Barash* - [email protected]
* Corresponding author
Abstract
Background: Computing the distance between two RNA secondary structures can contribute in understanding the functional relationship between them. When used repeatedly, such a procedure may lead to finding a query RNA structure of interest in a database of structures. Several methods are available for computing distances between RNAs represented as strings or graphs, but none utilize the RNA representation with dot plots. Since dot plots are essentially digital images, there is a clear motivation to devise an algorithm for computing the distance between dot plots based on image processing methods.
Results: We have developed a new metric dubbed 'DoPloCompare', which compares two RNA structures. The method is based on comparing dot plot diagrams that represent the secondary structures. When analyzing two diagrams and motivated by image processing, the distance is based on a combination of histogram correlations and a geometrical distance measure. We introduce, describe, and illustrate the procedure by two applications that utilize this metric on RNA sequences. The first application is the RNA design problem, where the goal is to find the nucleotide sequence for a given secondary structure. Examples where our proposed distance measure outperforms others are given. The second application locates peculiar point mutations that induce significant structural alternations relative to the wild type predicted secondary structure. The approach reported in the past to solve this problem was tested on several RNA sequences with known secondary structures to affirm their prediction, as well as on a data set of ribosomal pieces. These pieces were computationally cut from a ribosome for which an experimentally derived secondary structure is available, and on each piece the prediction conveys similarity to the experimental result. Our newly proposed distance measure shows benefit in this problem as well when compared to standard methods used for assessing the distance similarity between two RNA secondary structures.
Conclusion: Inspired by image processing and the dot plot representation for RNA secondary structure, we have managed to provide a conceptually new and potentially beneficial metric for comparing two RNA secondary structures. We illustrated our approach on the RNA design problem, as well as on an application that utilizes the distance measure to detect conformational rearranging point mutations in an RNA sequence.
Published: 9 February 2009
Algorithms for Molecular Biology 2009, 4:4 doi:10.1186/1748-7188-4-4
Received: 23 March 2007 Accepted: 9 February 2009
This article is available from: http://www.almob.org/content/4/1/4
© 2009 Ivry et al; licensee BioMed Central Ltd.
Background
In the past several years, interesting novel RNA sequences were discovered that carry a diverse array of functionali-ties. By now, it is well known that RNAs are considerably involved in mediating the synthesis of proteins, regulating cellular activities, and exhibiting enzyme-like catalysis and post-transcriptional activities. In many of these cases, knowledge of the RNA secondary structure can be helpful in the understanding its functionality.
The importance of the secondary structure of RNAs presents a need for tools that rely on comparing two RNA secondary structures, which may indicate a functional commonality or divergence between them. These tools may usually accompany secondary structure prediction packages which are based on energy minimization such as Mfold [1] and the Vienna RNA package [2], both using the expanded energy rules [3] to predict the folding of RNA sequences. Calculating the distance between RNA struc-tures have been approached by several methods, some of which are based on the edit distance of a tree representa-tion of the RNA secondary structure elements [4-6]. An edit distance on homeomorphically irreducible trees (HITs) [7] was one of the original proposals for a compar-ison method. A different method was based on the align-ment of a string representation of the secondary structures [8,9], where parenthesis represent the base-pairs, and another symbol represents unpaired nucleotides [6]. This representation is known as the dot-bracket representation. All aforementioned comparison methods were imple-mented as part of the Vienna RNA package [2,6]. More recent suggestions for RNA secondary structure compari-sons include the use of context free grammars [10], align-ment by dynamic programming [11], and a more general edit distance under various score schemes [12,13]. A method for a rapid similarity analysis using the Lempel-Ziv algorithm was suggested in [14]. Another method uses the second eigenvalue of the tree graph representation for the structures comparison, [15], and was later integrated into the RNAMute [16], a Java tool, which we will use for our second application illustration. The latter aforemen-tioned method is not a metric. A comparison on metric methods is available in [17], where it was found that sim-ple metrics work sufficiently well for measuring RNA sec-ondary structure conservation.
Here, we propose an alternative distance measure, moti-vated by image processing and pattern recognition. The new metric is based on an analysis of the dot plot dia-grams of the secondary structures, and uses histogram based correlation and plane group distance to calculate the similarity between the diagrams. The measure com-bines both fine and coarse elements in the structure and can offer an alternative method to the aforementioned distance measures, with a critical advantage in
applica-tions that use energy and probability dot plots for the analysis of secondary structures.
The idea of using two dimensional plots in order to inves-tigate possible secondary structure elements in RNAs (these 2D plots in time became known as dot plots) can be traced back to a seminal work by Tinoco et al. [18]. In Trifonov and Bolshoi [19], such 2D plots have been used by their analysis to reveal common hairpins in 5S rRNA molecules. Jacobson and Zuker [20] later used dot plots to predict well defined areas in a viral genome, suggesting that the amount of cluttering in dot plots reflect the impossibility of accurate structure predictions. Horesh et al. [21] performed clustering into RNA families based on dot plots. The above works represent a variety of uses for dot plots when analyzing RNA secondary structures.
Our new distance measure will be examined in two appli-cation problems that require the use of distances between RNA secondary structures. The first is the RNA design problem, also known as the inverse RNA folding problem. The goal in this problem is to design nucleotide sequences that fold to a given RNA secondary structure. The design problem can be applied to noncoding RNAs, which are involved in gene regulation, chromosome replication, RNA modification [22], and other important processes. Various heuristic local search strategies have been used by existing programs dealing with inverse RNA folding. The original approach to inverse RNA folding was imple-mented in RNAinverse, available as part of the Vienna RNA package [6]. There, two different criteria were used to find the local optima: 1. mfe-mode: a structural distance between the mfe structure of the designed sequence and the target structure. 2. probability-mode: the probability of folding into the target structure. A second algorithm is called RNA-SSD (RNA Secondary Structure Designer) and was developed by Andronescu et al. [23]. It tries to mini-mize a structure distance via recursive stochastic local search. A recent algorithm that was devised to solve the design problem, called Info-RNA, can be found in Busch and Backofen [24].
signif-icant ones, in terms of secondary structure difference [31]. RNAMute [16] and RDMAS [32] are tools that attempt to perform such predictions and are based on energy mini-mization methods [1,2]. The RNAMute mutation analysis tool, [16], includes RNAdistance from [2,6]: the RNA edit distance of the dot bracket representation as a fine-grain comparison method, and the edit distance of the Shapiro representation, [4,5], as a coarse-grain comparison method.
We have developed a stand-alone procedure called DoPloCompare, which receives two RNA structures as an input, and calculates their similarity grade using our new distance measure algorithm. In order to illustrate our met-ric, we have constructed several test cases that use the DoPloCompare procedure for the distance measure, in the framework of the two applications described above.
In the following sections we will describe the new proce-dure DoPloCompare, the two application problems we use for illustration, and the results obtained when testing DoPloCompare on these applications. We discuss its con-tribution alongside commonly used routines such as RNAdistance [6].
DoPloCompare – comparing two RNA secondary structures
The basis for our algorithm is the fact that a base-pairing indicator dot plot diagram is a sound representation of the RNA secondary structure, as will be detailed in the next Section. In general, a dot plot is a matrix comparison of two sequences (or one with itself) and is prepared by sliding a window of user-defined size along both sequences. If the two sequences within that window match with a precision set by the mismatch limit, a dot is placed in the middle of the window signifying a match [33]. In the case of RNA sequences, we assume that a sim-ilarity between dot plot diagrams of two sequences is a good criterion for similarity between the secondary struc-tures of those sequences.
Given two dot plot diagrams of two secondary structures, we would like to develop a distance grade that best indi-cates how well the secondary structures attached to the diagrams resemble each other. When two structures are similar, we require the distance between their represent-ing dot plot diagrams to be small (discardrepresent-ing "simple" image subtraction as a non-desirable option, as can be observed in Figure 1), and alternatively, when the struc-tures are different, we require that the distance will increase.
Observations
Two main observations served as motivation in establish-ing the distance calculation formula. The first is that
sim-ilar secondary structures will maintain matching dot plot diagrams with dots in the same or in close positions. Obviously, two secondary structures will look alike if all or most of the base pairing couples will be located in the same or in proximal places in the sequences. The second observation is that two secondary structures will count as similar if both the number and order of the elements they contain are the same [15]. For example, two RNA struc-tures with four stems can be considerably different if the first structure is arranged as a one elongated structure con-taining a bulge and three consecutive loops, while the sec-ond includes a bulge, a multi-branch loop, and two additional stem-loops that branch out of the multi-branch loop. From the second observation, we concluded that the calculation should also reflect the overall arrange-ment of elearrange-ments in the secondary structure, and the groups of points in the dot plot diagrams accordingly. All these observations raise the motivation to compare dot plots, by considering them as simple images and exploit-ing tools from image processexploit-ing.
Distance calculation
Taking into account the above observations, we have developed the following distance grade formula.
Let O be the dot plot diagram of the original sequence rep-resenting its secondary structure.
Let M be the dot plot diagram of the mutated sequence representing its secondary structure.
Then:
Where Corr stands for Correlation and Dist stands for Dis-tance. For the Correlation part we used the histograms method as detailed in the Methods Section. In our imple-mentation, we used a 4-dimensional histograms correla-tion:
Where:
• Xc(O, M) is the correlation grade (see Equation 4 in Methods) between the vectors that sums all the points on each X column of the matrix
• Yc(O, M) is the correlation grade between the vectors that sums all the points on each Y row of the matrix
Distance Grade O M Dist O M Corr O M _ ( , ) ( , )
( , )
=
Corr O M
Xc O M Yc O M Dc O M Ic O M
( , )
( , ) ( , ) ( , ) ( , )
• Dc(O, M) is the correlation grade between the vectors that sums all the points on each Diagonal SW-NE
• Ic(O, M) is the correlation grade between the vectors that sums all the points on each Inverse Diagonal SE-NW
For the distance (Dist) part we used the RMS distance as explained in the Methods Section, and applied it on the groups of points of both dot plot diagrams. Note that in case the correlation value is zero, the formula will return an infinity value. There is no practical interest in this case, since it is only possible when at least one of the dot plot diagrams represents a trivial structure of a single stranded RNA, which has no biological significance from a struc-tural standpoint. For safety from the numerical stand-point, if encountering a zero correlation value, our system returns the distance (Dist) grade alone in this situation.
Formulas explanation
The histogram correlation (Corr) compares the locations of every pi and pj under the best matching shift, where pi is a pixel in the original sequence's dot plot diagram, and pj is a pixel in the mutated sequence's dot plot diagram. However, in some cases small differences in the locations of the pixels between the original and the mutated dot plot diagrams, reduces the correlation grade. Literally, the grade is reduced for every pixel in the original dot plot that is not placed on the same exact location as a pixel in the mutated dot plot. For this reason, we introduce a distance measure between the dot plot diagrams, in addition to the histogram correlation.
The histograms formula is well balanced between all the different vectors being correlated: First, the Xc and Yc vec-tors represent the base pairing arrangement along the sequence. Note that the dot plot diagrams described in this article are symmetric matrices, thus both Xc and Yc vectors are exactly the same (non symmetric diagrams are described in the Dot Plot Diagrams Subsection in the Methods Section). Future extensions might utilize non-symmetric diagrams, and will be supported by our system.
Second, the Dc vector describes the long stems arrange-ment in the structure. Finally, the Ic vector corresponds to the projection of the overall structural elements arrange-ment. This combination allows the formula to be tolerant to small structural differences. For example, when com-paring two long stems, distinguished by a single bulge in the middle, the Dc vectors will be very different between these two structures, but the other three vectors will remain similar, thus the correlation grade will remain high. The distance measure (Dist) is more tolerant to small differences and represent overall proximity between the sets of points. Moreover, if a pixel in the original dot plot is not placed on top of a pixel in the compared dot
plot, the correlation grade will be reduced equally, regard-less of the distance between the pixels, while the distance measure will be reduced in a direct proportion to the dis-tance between the pixels.
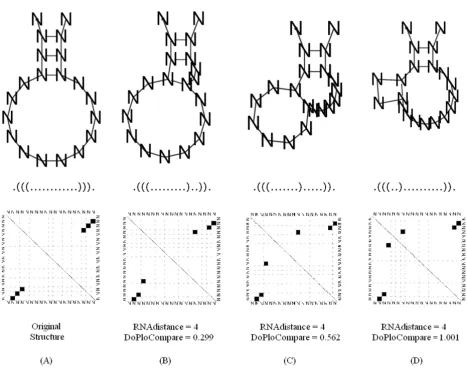
Illustration
The distance grade will be high in the following cases: when the correlation value is low and/or when the dis-tance value is high. A low correlation value will be calcu-lated when the compared diagrams' vectors are distinct. A high distance value will be calculated when the compared diagrams' groups are distant – see the example in Figure 2. From these comparisons, we argue that there is an advan-tage in using our DoPloCompare over RNAdistance since structure (D) in the Figure is more remote from structure (A) than structure (B) or (C) as DoPloCompare values indicate.
DoPloCompare program flow
DoPloCompare receives two RNA secondary structures as input, either in a dot bracket notation or as two ct files
Dot plot subtraction Figure 1
(produced by Mfold [1]). The main flow of the algorithm is made of three parts:
1. Build the dot plot matrix from the secondary structures.
2. Compare the two structures using formula (1) for the distance grade. In order to normalize the distance grade, it is divided by the length of the sequences.
3. Output the distance grade.
Building the Dot Plot Matrix
Taking the simple matrix characteristics (described in the Methods Section), one can easily build such a matrix by
traversing a folding option received as an output of any folding program, and for every base pairing nucleotides couple in the sequence set the matching matrix cell value to 1 (other cell values will be set to 0).
Incorporating DoPloCompare into RNAinverse
As part of RNAinverse (see RNA-Design Subsection under the Methods Section) operation, it uses a distance score to measure the designed sequence's structure to the input (the desired secondary structure). When the distance between the input and the structure is zero, the operation ends and the application outputs the sequence. In some cases, the input structure is undesignable, i.e. in these cases the secondary structure of the input is not
energeti-Illustration of the difference between RNAdistance and DoPloCompare Figure 2
cally favorable and it is impossible for the algorithm to predict a sequence with the same secondary structure as the input structure. In this case the algorithm finds a close match based on the structural difference, i.e. a sequence and a structure with the smallest distance from the input structure.
We have replaced the base pairing distance measure used by the RNAinverse algorithm with DoPloCompare, thus creating a new version of the algorithm for the RNA design problem that is based on our image processing distance proposed instead of base pairing distance.
Finding the most significant point mutation using DoPloCompare
The system is based on both histograms and geometry as the core comparing mechanism between the original sequence secondary structure and all the possible point mutations' folding variants. The algorithm is composed of two major parts: pre-processing and main comparing mechanism. The pseudo-code of the algorithm is given here:
Most_Significant_Mutation ( Original_Sequence )
BEGIN
Original_Matrix:= Built matrix
from the folding of Original_Sequence;
Max_Grade:=0;
Max_Sequence:=Original_Sequence;
WHILE ( Mutated_Sequence:= Next
point mutation of Original_Sequence )
BEGIN
Mutated_Matrix:=Built matrix from the
folding of Mutated_Sequence;
Grade:=Distance grade between
Original_Matrix and Mutated_Matrix;
If ( Grade > Max_Grade )
BEGIN
Max_Grade:=Grade;
Max_Sequence:=Mutated_Sequence;
END
END
Return Max_Sequence;
END.
System parameters
The system has several parameters, including:
• Folding program – either MFOLD or Vienna's RNAsub-opt.
• Number of suboptimal folding options to be considered by the algorithm.
• Geometric distance measure to be used – either RMS or Hausdorff [34] distances. The default measure is RMS.
Pre-processing
The pre-processing part is divided to three steps (each is described in detail in the Methods Section):
1. Create all single-point-mutations in the original sequence.
2. Fold the mutated sequences using the folding program of choice.
3. From the folding program's output, we build a dot plot like matrix.
Main comparing mechanism
The mutated and original secondary structures' represent-ing dot plot matrices are berepresent-ing compared usrepresent-ing the DoPloCompare application (see 'DoPloCompare' sec-tion). Each mutated sequence's dot plot matrix receives a distance grade, which represents its similarity to the origi-nal sequence's representing matrix.
Output
At this stage, the algorithm finds the dot plot with the highest distance grade, i.e., the dot plot with the greatest difference from the dot plot diagram of the original sequence. This dot plot represents the secondary structure of one of the suboptimal folding options of a mutated sequence. The algorithm reports this sequence, along with additional data:
2. The location of the point mutation and the replaced nucleotide (e.g., G15U).
3. The dot-plot-like matrix of the mutated sequence.
In addition, for user convenience, the secondary structure and the dot-plot-like matrix elements of the original sequence are also attached.
Results
The RNA-design problem
We have compared the results of RNAinverse using DoPloCompare vs. the results when using a base pairing distance. As explained above, RNAinverse deals with two types of input structures, designable and undesignable. In the designable case there is no advantage for either one of the approaches, both produce sequences that fold into the given secondary structure. This is due to the fact that iden-tical structures lead to zero distance in both distance measures. Table 1 presents an example of five designable structures. However, for the undesignable case when using RNAinverse with base pairing distance (the first taken from [24]), we found several examples where DoPloCompare is able to reach an exact answer. For fair-ness, there are also examples where RNAinverse reaches an exact answer and DoPloCompare does not, within 500 iterations. Three example secondary structures are depicted in Figures 3, 4, 5 for illustration. The first struc-ture is called Structural-Element-Tripod and describes a tripod like structure with three hairpins surrounding a multibranch loop, found in [24]. It shows a case that was noted before in the literature in which RNAinverse is not
able to provide an exact answer whereas DoPloCompare does reach an exact solution. The second and third cases, respectively, are taken from the generated sample explained in the next Section. The second case is a one in which RNAinverse succeeds to reach an exact solution whereas DoPloCompare does not, and the third case is similar to the first case by illustrating once again a success for DoPloCompare while RNAinverse fails. For all three test cases we executed 500 runs and the Figures present: (a) the given structure; (b) an exact solution found with DoPloCompare or base pairing distance, respectively; (c) the best result achieved when using base pairing distance or DoPloCompare, respectively.
Statistical comparison
Stochastic methods are needed in order to solve the RNA inverse folding problem. Therefore, a statistical compari-son on an unbiased set is required when evaluating the merits of the new distance measure for providing a better solution to the design problem. In order to generate a set of secondary structures with uniform probability, the pro-gram ranstruc [35] that was kindly given to us by the authors of this reference was used.
Without loss of generality, we first chose a minimum stem length of 7 nt, generated 1000 random structures, and compared the performance of both programs with a fixed number of starting points, 1000 each. We ran this proce-dure for sequences of three different lengths: 70, 100, and 150 nt. For 70 nt, 150 iterations of RNAinverse and DoPloCompare were used and all structures were design-able. For 100 nt, 300 iterations of RNAinverse and
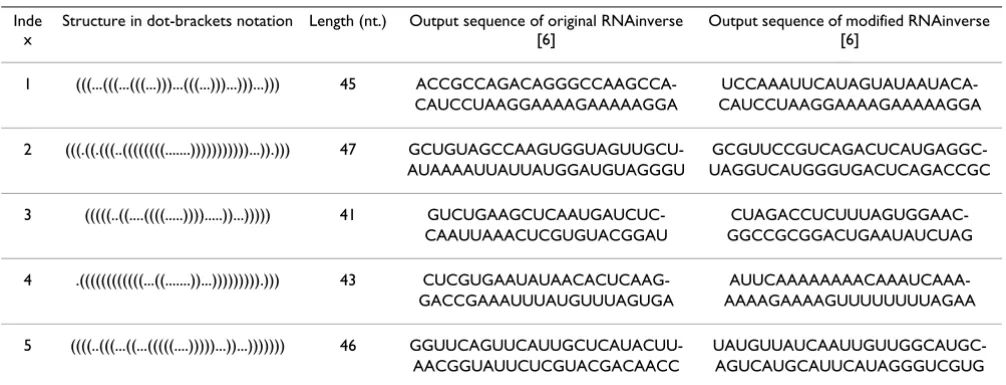
DoPlo-Table 1: Designable RNA secondary structures
Inde x
Structure in dot-brackets notation Length (nt.) Output sequence of original RNAinverse [6]
Output sequence of modified RNAinverse [6]
1 (((...(((...(((...)))...(((...)))...)))...))) 45 ACCGCCAGACAGGGCCAAGCCA- UCCAAAUUCAUAGUAUAAUACA-CAUCCUAAGGAAAAGAAAAAGGA CAUCCUAAGGAAAAGAAAAAGGA
2 (((.((.(((..((((((((...)))))))))))...)).))) 47 GCUGUAGCCAAGUGGUAGUUGCU- GCGUUCCGUCAGACUCAUGAGGC-AUAAAAUUAUUAUGGAUGUAGGGU UAGGUCAUGGGUGACUCAGACCGC
3 (((((..((....((((...))))...))...))))) 41 GUCUGAAGCUCAAUGAUCUC- CUAGACCUCUUUAGUGGAAC-CAAUUAAACUCGUGUACGGAU GGCCGCGGACUGAAUAUCUAG
4 .((((((((((((...((...))...))))))))).))) 43 CUCGUGAAUAUAACACUCAAG- AUUCAAAAAAAACAAAUCAAA-GACCGAAAUUUAUGUUUAGUGA AAAAGAAAAGUUUUUUUUAGAA
5 ((((..(((...((...(((((....)))))...))...))))))) 46 GGUUCAGUUCAUUGCUCAUACUU- UAUGUUAUCAAUUGUUGGCAUGC-AACGGUAUUCUCGUACGACAACC AGUCAUGCAUUCAUAGGGUCGUG
Compare were used and 2 structures were found undesignable. For 150 nt, 700 iterations of RNAinverse and DoPloCompare were used and 3 structures were found undesignable. There was no advantage or disadvan-tage to using DoPloCompare over the standard
RNAin-verse and vice versa. Next, we chose a minimum stem length of 3 nt, for the length of 50 nt. Out of 10,000 struc-tures generated by the progam ranstruct, 40 strucstruc-tures were more difficult to design with a low number of itera-tions, but with 500 iteraitera-tions, both DoPloCompare and
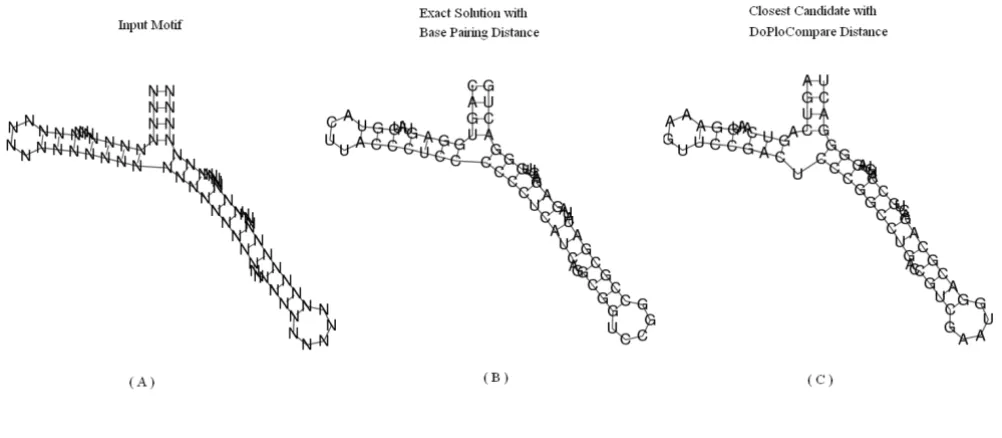
Structural element tripod showing success for DoPloCompare Figure 3
Structural element tripod showing success for DoPloCompare. The structural element Tripod [24]. (A) The desired secondary structure for which the algorithm tries to design a sequence, the element is composed of four stems, three of which with terminal hairpin, surrounding a multibranch loop. (B) The exact solution found when using the modified RNAinverse with DoPloCompare distance. (C) The closest secondary structure the algorithm returns after 500 iterations, when using the origi-nal RNAinverse with base-pairing distance.
Generated case showing success for base-pairing distance Figure 4
RNAinverse with base pairing distance were able to solve them exactly. In order to find more difficult cases that are undesignable, we generated structures of length 70 nt. Out of 500 structures generated, 15 structures were impossible to design for either one of the distances while the other was able to find an exact solution. Two of these examples are depicted in Figures 4 and 5.
These results show that RNAinverse with the integrated DoPloCompare distance grade is able to outperform the original RNAinverse that utilizes the base pairing distance in some cases, while in others the opposite occur. The sta-tistical comparison shows that there is no clear-cut advan-tage to either one of the distances but there are cases in which one method fails while the other succeeds.
Finding the most significant point mutation
We compared the three test cases that were used in [15] before and after inserting DoPloCompare. Additionally, we tested our system on a data set of ribosomal RNA pieces (the sequence for each piece is available in Addi-tional file 1.
Wild type sequences
We will describe the results for three well-studied RNA sequences that were used in [15] for a bioinformatics proof of concept. It is worthwhile noting that we are look-ing for the mutation with the largest structural difference from the wild type, while in [15] the ultimate goal was to look for a mutation that can lead to a bistable conforma-tion. We successfully locate mutations that lead to a fold-ing rearrangement with large difference from the wild type structure, and that are similar to the ones found in [15]. In addition to the second eigenvalue classification, we
specif-ically compare our results to RNAdistance's dot bracket edit distance grade, which was mentioned but not directly used for comparison in [15]. RNAdistance was later inte-grated into RNAMute [16].
Leptomonas collosoma
The first sequence is the spliced leader RNA from Lepto-monas collosoma which was studied by LeCuyer and Croth-ers [30,36], where they experimentally demonstrated a mutation induced RNA switch. In this test case, our sys-tem reported a structure with one double strand segment and a hairpin. This structure is of larger difference from the optimal wild type folding than the one reported in [15] that contains a bulge and a hairpin. We assume that this difference emerges from the different folding param-eters, because the second eigenvalue of our result is also 1.0 (see [15]). A supporting fact for the latter is that when taking the largest RNAdistance grade, we obtain the same mutation and suboptimal folding as ours. The results are presented in Figure 6.
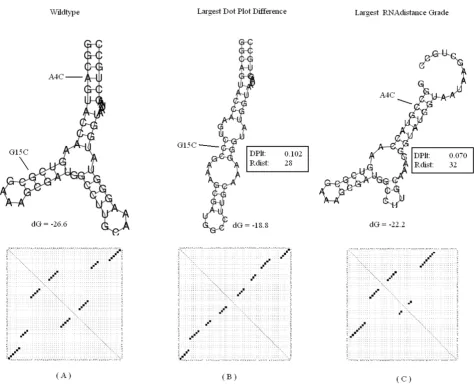
P5abc subdomain
The second sequence is the P5abc subdomain of the tet-rahymena thermophila ribozyme that was studied by Wu and Tinoco [37]. The results for the second sequence are found in Figure 7. In this test case, our system predicted the mutation G15C, which was also reported in [15] as a solution. When testing the P5abc subdomain with Mfold, both G15C and G15U produced the same dot plot matrix in one of their suboptimal folding options, thus receiving the same similarity grade. The mutation C22G produced a very similar matrix, with a somewhat lower similarity grade. In this case, the largest RNAdistance grade was received in the mutated structure of A4C, which is more
Generated case showing success for DoPloCompare Figure 5
similar to the original structure than our results. Both the A4C mutation and the original structure contain a multi-branch loop, while our reported mutation's structure does not.
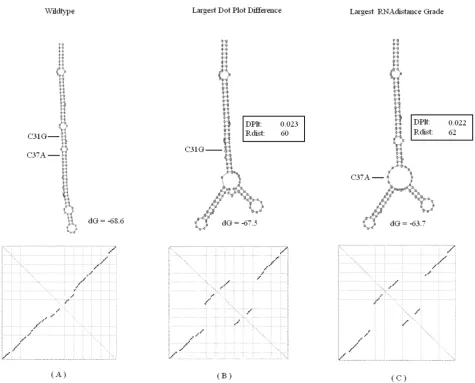
Hepatitis delta virus
The third sequence is taken from human hepatitis delta virus ribozyme that was studied by Lazinski et al. [38], for its regulation of self-cleavage activity. The results for the third sequence are found in Figure 8. In this test case, our system predicted the C31G mutation. The structure induced by this mutation is similar to the one in [15]. The U40G that was suggested in their research [38] main-tained a similarity grade that was very close to the grade of our system result. In [38], the authors mention the exist-ence of eight possible mutations that provide the desired non-linear effect in the ribozyme structure, and this may explain the variation. The largest RNAdistance score was recorded in a highly similar structure to the one found by our system.
Ribosomal data-set
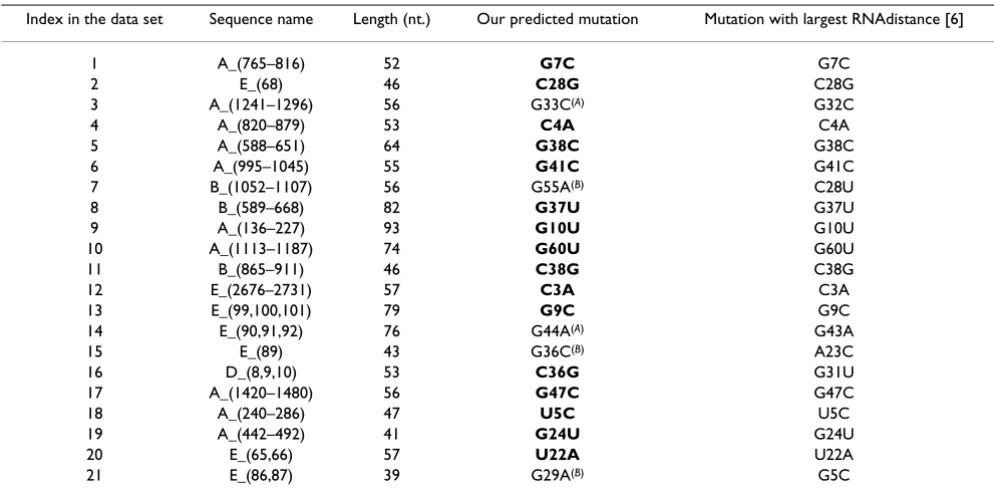
We have generated a data set of small RNA sequences, containing fragments that were cut from the rRNA of the thermus thermophilus [39]. This data set was built in order to test our system and compare its results to the RNAdis-tance results. Labels for the data set can be found in Addi-tional file 1.
Out of the 21 RNA sequences in the data set, 16 produced the same exact mutation and structure as the ones received by comparing the edit distance of the dot bracket repre-sentation of the folded structures. Two sequences pro-duced different mutations but highly similar structures to the results from RNAdistance. Regarding the remaining three sequences, there were differences between our sys-tem's result and the largest RNAdistance result:
1. Our proposed structure for the E_(89) is different than the structure with the largest RNAdistance, but it is non-obvious to determine which one of them is more signifi-cant, both of the mutations alter the structure with respect to the original structure, as observed in Figure 9(A).
2. Our proposed structure for the E_(86, 87) is quite sim-ilar to the structure with the largest RNAdistance. How-ever, both the RNAdistance structure and the original structure contains an extra loop. Thus, it can be argued that our proposed structure is less similar to the original one, as observed in Figure 9(B).
3. Our proposed structure for the B_(1052–1107) is less similar to the original structure than the structure with the largest RNAdistance. Both the original and RNAdistance's
structures contain a branch that is not present in our sys-tem's result, as can be observed in Figure 9(C).
The ribosomal data set results are summarized in Table 2. Labelings for the sequences that are used in Table 2 are reported in Additional file 1.
Discussion and future work
L. collosoma Figure 6
The distance measure presented in this article, DoPloCo-mpare, has several advantages with respect to previously suggested techniques (most commonly used are the ones described in [6]):
• The measure is used with the dot plot representation, whereas to the best of our knowledge no other measure was suggested beforehand for this type of representation. Probability and energy dot plots have an increased poten-tial to be used even more in the future, in cases where a more sophisticated analysis is needed besides inspecting the predicted secondary structures. The measure is
inversely proportional to the similarity (or proportional to the dissimilarity) between the structures being com-pared.
• The metric combines coarse and fine-grain characteris-tics, provided by the distance measure and the correlation respectively, and thus balances both the distance between the nucleotides and the structural elements (e.g., hairpin, loop, etc.) in the compared structures.
• DoPloCompare is easily tuned with regard to the dis-tance function (Hausdorff, RMS, etc.), the correlation
P5abc subdomain Figure 7
algorithm (histograms correlations, traditional correla-tion, etc.) and their combination.
• DoPloCompare can receive the structures as input from a list of popular folding programs' output files, such as Mfold and the Vienna RNA package.
• DoPloCompare can be easily incorporated into two applications as illustrated here: the RNA design, and RNA conformational rearranging mutation prediction. It pro-vides some good results in comparison to known meth-ods.
There are a number of avenues that are possible to pursue in the future for the extension of DoPloCompare and the presented application:
• DoPloCompare: operation on more sophisticated dot plots that contain more information (e.g., probability and/or energy values). Our technique using histogram correlation and RMS distance permits for potential exten-sions that will utilize numerical values contained within dots, much like in the case of digital images.
Delta virusoid Figure 8
• DoPloCompare: integrate into the RNAMute mutation analysis tool [16], which might be found beneficial in cases where dot plots are dealt with for visualization.
Based on our experiments in comparing DoPloCompare to the traditional distance measures available in RNAdis-tance, it should be noted that we still recommend
utiliz-ing the latter as default unless exceptional cases are dealt with.
Conclusion
We have provided a new technique borrowed from image processing that utilizes the dot plot representation to compare RNA secondary structures. The technique can be
Ribosomal data-set differences Figure 9
advantageous in some cases and when dot plots are dealt with it can be used as a baseline for other RNA structure based applications.
Methods
RNA suboptimal solutions
In order to make folding predictions based on an RNA sec-ondary structure, we used the RNAsubopt [40] available in the Vienna RNA package, a program that predicts all suboptimal secondary structures of a given sequence based on thermodynamics and base pairing rules [3]. Alternatively, we might as well use the suboptimal solu-tions calculated by Mfold. RNAsubopt, like many other RNA folding approaches, uses a free energy minimization procedure. It is expected that the native fold of the sequence is close to the minimum free energy (mfe) struc-ture. We are interested in all suboptimal solutions because in nature RNA often folds into a suboptimal structure (and also because of limitations of thermodynamic mod-els), which may cause the mfe structure to be different than the native fold. For a given sequence, RNAsubopt cal-culates all suboptimal secondary structures within an energy range above the minimum free energy. It outputs the suboptimal structures – sorted by mfe – in a dot-bracket notation, followed by the energy in kcals/mol. Originally, a different method for calculating suboptimal solutions was devised by Zuker [41], and is used in Mfold.
Creating the point mutations
In order to create all the possible single point mutations for a given sequence, we simply traverse along the sequence and for each position i do:
Let N1, N2 and N3 be the three possible nucleotides which are different than the nucleotide in position i. Let SEQ(j, k) denote the subsequence starting in position j in the original sequence and ending at position k (in case k <j return an empty sequence).
Return:
SEQ(1, i - 1) ⴰN1 ⴰSEQ(i + 1, m) ∪
SEQ(1, i - 1) ⴰN2 ⴰSEQ(i + 1, m) ∪
SEQ(1, i - 1) ⴰN3 ⴰSEQ(i + 1, m)
Where m is the original sequence length.
Dot plot diagrams
A dot plot is a diagram comprised of dots on two axes. Each of the axis represents some sort of data. A dot in loca-tion (x, y) represents some measure between the localoca-tion x in the X-data axis and location y in the Y-data axis. For example, the axis can represent two sentences, and the dots can represent the locations where the sentence on the
Table 2: Ribosomal data-set
Index in the data set Sequence name Length (nt.) Our predicted mutation Mutation with largest RNAdistance [6]
1 A_(765–816) 52 G7C G7C
2 E_(68) 46 C28G C28G
3 A_(1241–1296) 56 G33C(A) G32C
4 A_(820–879) 53 C4A C4A
5 A_(588–651) 64 G38C G38C
6 A_(995–1045) 55 G41C G41C
7 B_(1052–1107) 56 G55A(B) C28U
8 B_(589–668) 82 G37U G37U
9 A_(136–227) 93 G10U G10U
10 A_(1113–1187) 74 G60U G60U
11 B_(865–911) 46 C38G C38G
12 E_(2676–2731) 57 C3A C3A
13 E_(99,100,101) 79 G9C G9C
14 E_(90,91,92) 76 G44A(A) G43A
15 E_(89) 43 G36C(B) A23C
16 D_(8,9,10) 53 C36G G31U
17 A_(1420–1480) 56 G47C G47C
18 A_(240–286) 47 U5C U5C
19 A_(442–492) 41 G24U G24U
20 E_(65,66) 57 U22A U22A
21 E_(86,87) 39 G29A(B) G5C
X-axis and the sentences on the Y-axis contain the same word. In biology, dot plots are often utilized for represent-ing alignments between sequences. Specifically in RNA, a dot plot is often used as an image representation of an optimal base pairing between any two nucleotides in the RNA sequence, based on minimum free energy consider-ation. Both Mfold [1] and the Vienna RNA package [6] present dot plots as part of their standard outputs, but instead of dots they use squares. Mfold presents dot plot diagrams based on the minimum free energy of the sub-optimal folding options of the sequence, where each fold-ing option square is painted with a different color. The Vienna RNA package, on the other hand, presents a differ-ent dot plot diagram where each square in the diagram represents the probability of a base pairing in that loca-tion in the sequence; the larger the probability, the larger the representing square.
In our approach, we compare each folding option sepa-rately, and require a separate dot plot diagram for each suboptimal solution (as opposed to Mfold's dot plot, for example). To comply with this constraint, we created a simplified dot-plot-like matrix with the following proper-ties:
1. Let LEN be the length of the sequence being observed, then the matrix is of two dimensions, and of size LEN × LEN.
2. The matrix cell (i, j) can contain either one of the values {0, 1} where 1 means that i match j in the current folding option and 0 otherwise.
Giving the fact that if nucleotide in position i matches a nucleotide in position j, j will also match i, clearly the matrix is symmetric along the diagonal.
Histograms
Histograms have been widely and very successfully used in image processing and shape analysis. Although origi-nally they were used to study the data statistics, they have recently been found to be critical for identification, recog-nition, and distance computations as well, e.g., [42,43]. Histograms constitute the building block of most state of-the-art shape identification and classification systems. Moreover, it has been recently shown that under very gen-eral conditions, histograms can uniquely identify a shape with extremely high probability [44]. This provides a very clear motivation to consider histograms for RNA second-ary structure analysis, as suggested in this paper.
In order to explain the "Dist" and "Corr" components of Equation (1) in more detail, we will first concentrate on "Corr" (which is, in our case, the Cross Correlate
expressed in Equation 4). Next, in the Subsection about the distance between groups of points in the plane, we will concentrate on "Dist" (which is, in our case, the RMS expressed in Equation 5).
In this manuscript we are using normalized cross-correla-tion between two one-dimensional vectors, in order to determine the level of similarity between these vectors.
Cross correlation is a standard method of estimating the degree to which two vectors are correlated.
Consider two vectors, X(i) and Y (i), where i = 0, 1, 2...N -1.
The cross correlation Corr at delay d is defined as:
Where MX and MY are the means of the corresponding series, and d = 0, 1, 2,... N - 1 represents all the possible delays.
In this paper we refer to the cross correlation between X and Y as:
Cross_Correlate(X, Y) = Maxd(Corr(d))
Where Corr(d) is as defined in Equation 3.
In order to build a one-dimensional series vector from the two-dimensional matrix that represents the original Dot Plot diagram, we traverse the diagram, each time on a spe-cific axis, and sum all the values on that axis (e.g. sum all the columns on the X axis, or sum all the rows on the Y axis). In this manner we obtain a one-dimensional vector for each axis, which can be correlated to the matching axis vector of the second matrix that represents the mutated Dot Plot diagram (see example in Figure 10).
The Cross-Correlation grade will be maximal when the two compared vectors are identical, or contain identical areas. We have used this feature in our assumptions, as explained in the DoPloCompare Section under the formu-las explanation Subsection.
Distance between groups of points in the plane
The matching and analysis of geometric features is an important problem that arises in various computational areas, e.g., computer vision and pattern matching. In gen-eral, we are given two sets of points A and B, and we wish to determine how much they resemble each other (for more information see for example [45]). Usually we can apply certain transformation on one of the sets, e.g.,
trans-Corr d i X i MX Y i d MY
X i MX Y i d MY
( ) [( ( ) ) ( ( ) )] ( ( ) ) ( ( ) )
= ∑ − × − − −
Sum vectors for dot-plot matrix Figure 10
late, scale and/or rotate, in order to be matched with the other set as closely as possible.
In order to measure the level of affinity between two dot plot diagrams, various measure functions have been devised. Two such common measures are the Hausdorff distance [45] and the Root Mean Square distance (RMS) [46-48]. Note that the Hausdorff distance has also been popular in image processing [34]. In this paper we use the RMS measure (see the definition of RMS in Equation 5 given below), but the system can be easily adapted to use the Hausdorff distance or any other measure. No align-ment between the groups is performed prior to the meas-urement, after several trials have shown no difference, for this particular (RMS) distance, if an alignment is added, and therefore the alignment procedure was removed for performance considerations.
The Root Mean Square distance for a set B from set A is:
Where n is the size of group A and NB(a) is the nearest neighbor of point a in group B.
The mark || in this context refers to the Euclidean norm.
The measure simply sums and normalizes the distances between each point in A to its nearest neighbor in set B. Clearly, when the two sets lie on top each other, the RMS score will be zero. Alternatively, for sets of different spreading in the plane the RMS distance will increase.
RMS distance between groups of points uses nearest neighbor queries in order to find the point from the other group from which to calculate each point's distance. In order to calculate nearest neighbor queries we imple-mented a version of planar Voronoi diagram [49], with pre-process time of O(n log n), which answers nearest neighbor queries in O(log n) for a group of n locations in the plane. We chose not to further discuss standard Voro-noi diagram since its implementation and use have no influence on the system output but only on the algorithm run-time.
In our approach, we look for the distance between groups of dots in the base pairing plane, i.e., we look for the RMS distance between two dot plot diagrams as described in the "DoPloCompare" Section.
Base-pairing distance
As a baseline method for comparing two secondary struc-tures we used RNAdistance, which is part of the Vienna RNA package. It reads RNA secondary structures and
cal-culates a "base-pair distance" given by the number of base pairs present in one structure-but not the other. We use this method as a measure of success in identifying the larg-est distance between the original sequence and the mutated sequence. We compare our results to the RNAdis-tance fine-grain method where two structures in dot-bracket notations are being compared. The coarse-grain method was also considered, however it provides poor results and therefore it was discarded.
RNA-design
We use for illustration the RNAinverse as an RNA-design bioinformatics method that is part of the Vienna RNA package. It searches for sequences folding into a prede-fined structure, thereby contituting an inverse folding algorithm. For each search the output includes both the best sequence that was found and its Hamming distance to the start sequence. If the the search was unsuccessful (i.e., the structure is undesignable), a structural distance to the target by using the standard base pairing distance is added to the output. We have replaced the base pairing distance with our DoPloCompare distance in RNAinverse, and compared our results to the original RNAinverse before the replacement.
Competing interests
The authors declare that they have no competing interests.
Authors' contributions
TI and SM and AA worked on the software design, carried our development and implementation, and participated in drafting the manuscript. DB and GS conceived the study, coordinated the software design and drafted the manuscript.
Additional material
Acknowledgements
We thank the anonymous referees for their critical comments. TI and SM would like to thank Boaz Rosenberg who provided some insightful ideas on implementing the correlation algorithm. We acknowledge the support of the Lynn and William Frankel Center for Computer Sciences at Ben-Gurion University. GS is supported by DARPA, NSF, and ONR.
RMS A B
n a NB a
a A
( , )= − ( )
∈
∑
1 2
Additional file 1
Dataset of ribosomal RNA fragments. A supplementary file containing a dataset of ribosomal RNA fragments of thermus thermophilus HB8. The dataset is based on the experiment described in [39]. It contains 21 fragments that are used for testing the new method introduced here for measuring distances between RNA secondary structures and comparing it with traditional methods.
Click here for file
Publish with BioMed Central and every scientist can read your work free of charge
"BioMed Central will be the most significant development for disseminating the results of biomedical researc h in our lifetime."
Sir Paul Nurse, Cancer Research UK
Your research papers will be:
available free of charge to the entire biomedical community
peer reviewed and published immediately upon acceptance
cited in PubMed and archived on PubMed Central
yours — you keep the copyright
Submit your manuscript here:
http://www.biomedcentral.com/info/publishing_adv.asp
BioMedcentral
References
1. Zuker M: Mfold Web Server for Nucleic Acid Folding and Hybridization Prediction. Nucleic Acids Res 2003, 31:3406-3415. 2. Hofacker I: Vienna RNA Secondary Structure Server. Nucleic
Acids Res 2003, 31:3429-3431.
3. Mathews DH, Sabina J, Zuker M, Turner DH: Expanded Sequence Dependence of Thermodynamic Parameters Improves Pre-diction of RNA Secondary Structure. J Mol Biol 1999,
288:911-940.
4. Shapiro BA: An Algorithm for Comparing Multiple RNA Sec-ondary Structures. CABIOS 1988, 4:381-393.
5. Shapiro BA, Zhang K: Comparing Multiple RNA Secondary Structures Using Tree Comparisons. CABIOS 1993, 33:309-318. 6. Hofacker I, Fontana W, Stadler P, Bonhoeffer LS, Tacker M, Schuster P: Fast Folding and Comparison of RNA Secondary Struc-tures. Monatsh Chem 1994, 125:167-188.
7. Fontana W, Konings D, Stadler P, Schuster P: Statistics of RNA Secondary Structures. Biopolymers 1993, 33:1389-1404. 8. Hogeweg P, Hesper B: Energy Directed Folding of RNA
Sequences. Nucleic Acids Res 1984, 12:67-74.
9. Konings DAM, Hogeweg P: Pattern Analysis of RNA Secondary Structure Similarity and Consensus of Minimal-Energy Fold-ing. J Mol Biol 1989, 207:597-614.
10. Holmes I, Rubin GM: Pairwise RNA Structure Comparison with Stochastic Context-Free Grammars. Pac Symp Biocomput
2002:163-174.
11. Veksler-Lublinsky I, Ziv-Ukelson M, Barash D, Kedem K: A struc-ture-based flexible search method for motifs in RNA. J Com-put Biol 2007, 14:908-926.
12. Jiang T, Lin G, Ma B, Zhang K: A General Edit Distance between RNA Structures. J Comput Biol 2002, 9:371-388.
13. Hochsmann M, Voss B, Giegerich R: Pure multiple RNA second-ary structure alignments: a progressive profile approach.
IEEE/ACM Trans Comput Biol Bioinform 2004, 1:53-62.
14. Liu N, Wang T: A Method for Rapid Similarity Analysis of RNA Secondary Structures. BMC Bioinformatics 2004, 7(493):. 15. Barash D: Second Eigenvalue of the Laplacian Matrix for
Pre-dicting RNA Conformational Switch by Mutation. Bioinformat-ics 2004, 20:1861-1869.
16. Churkin A, Barash D: RNAmute: RNA Secondary Structure Mutation Analysis Tool. BMC Bioinformatics 2006, 7(201):. 17. Gruber A, Bernhart S, Hofacker I, Washietl S: Strategies for
Meas-uring Evolutionary Conservation of RNA Secondary Struc-tures. BMC Bioinformatics 2008, 9:122.
18. Tinoco I, Uhlenbeck O, Levine M: Open and closed 5S ribosomal RNA, the only two universal structures encoded in the nucle-otide sequences. J Mol Biol 1971, 230:363-367.
19. Trifonov E, Bolshoi G: Open and closed 5S ribosomal RNA, the only two universal structures encoded in the nucleotide sequences. J Mol Biol 1983, 169:1-13.
20. Jacobson A, Zuker M: Structural analysis by energy dot plot of a large mRNA. J Mol Biol 1993, 233:261-269.
21. Horesh Y, Amir A, Michaeli S, Unger R: RNAMAT: An Efficient Method to Detect Classes of RNA Molecules and their Struc-tural Features. Proceedings of the 26th Int Conf of the IEEE Engineer-ing in Medicine and Biology (EMBS) 2004, 4:2869-2872.
22. Storz G: An expanding universe of noncoding RNAs. Science
2002, 296:1260-1263.
23. Andronescu M, Fejes AP, Hutter F, Condon A, Hoos HH: A new algorithm for RNA secondary structure design. J Mol Biol
2004, 336:607-624.
24. Busch A, Backofen R: INFO-RNA-a fast approach to inverse RNA folding. Bioinformatics 2006, 22(151823-1831 [http://bioinfor matics.oxfordjournals.org/cgi/content/abstract/22/15/1823]. 25. Schultz EA, Bartel D: One Sequence, Two Ribozymes. Science
2000, 289:448-452.
26. Mironov AS, Gusarov I, Rafikov R, Lopez LE, Shatalin K, Kreneva RA, Perumov DA, Nudler E: Sensing Small Molecules by Nascent RNA: a Mechanism to Control Transcription in Bacteria. Cell
2002, 111:747-756.
27. Winkler W, Nahvi A, Breaker RR: Thiamine Derivatives Bind Messenger RNAs Directly to Regulate Bacterial Gene Expression. Nature 2002, 419:952-956.
28. Biebricher CK, Diekmann S, Luce R: Structural Analysis of Self-Replicating RNA Synthesis by QβReplicase. J Mol Biol 1982,
154:629-648.
29. Biebricher CK, Luce R: In Vitro Recombination and Terminal Elongation of RNA by Qβ Replicase. EMBO J 1992,
11:5129-5135.
30. LeCuyer KA, Crothers DM: Kinetics of an RNA Molecular Switch. Proceedings of the National Academy of Sciences, USA 1994,
91:3373-3377.
31. Barash D: Deleterious Mutation Prediction in the Secondary Structure of RNAs. Nucleic Acids Res 2003, 31:6578-6584. 32. Shu W, Bo X, Liu R, Zhao D, Zheng Z, Wang S: RDMAS: a web
server forRNA deleterious mutation analysis. BMC Bioinfor-matics 2006, 7(404):.
33. Maizel J, Lenk R: Enhanced graphic matrix analysis of nucleic acid and protein sequences. Proc Natl Acad Sci USA 1981,
78:7665-7669.
34. Huttenlocher D, Klanderman G, Rucklidge W: Comparing Images Using the Hausdorff Distance? IEEE Trans Patt Anal Mach Intell
1993, 15(9):850-863.
35. Hofacker I, Schuster P, Stadler P: Combinatorics of RNA Second-ary Structures. Discrete Appl Math 1998, 88:207-237.
36. Zimmerman J, Maher L: In vivo selection of spectinomycin-bind-ing RNAs. Nucleic Acids Res 2002, 30:5425-5435.
37. Wu M, Tinoco I: RNA Folding Causes Secondary Structure Rearrangement. Proceedings of the National Academy of Sciences, USA 1998, 95:11555-11560.
38. Lazinski DW, Taylor JM: Regulation of Hepatitis Delta Virus Ribozymes: to Cleave or not to Cleave? RNA 1995, 1:225-233. 39. Yusupov MM, Yusupova GZ, Baucom A, Lieberman K, Earnest TN, Cate JH, Noller HF: Crystal structure of the ribosome at 5.5 A resolution. Science 2001, 292:883-896.
40. Wuchty S, Fontana W, Hofacker I, Schuster P: Complete Subopti-mal Folding of RNA and the Stability of Secondary Struc-tures. Biopolymers 1999, 49:145-165.
41. Zuker M: On Finding All Suboptimal Foldings of an RNA Mol-ecule. Science 1989, 244:48-52.
42. Funkhouser T, Kazhdan M, Min P, Shilane P: Shape-Based Retrieval and Analysis of 3D Models? Comm of the ACM 2005, 48(6):58-64. 43. Lowe DG: Distinctive Image Features from Scale-Invariant
Keypoints? Int J Comput Vision 2004, 60(2):91-110.
44. Boutin M, Kemper G: Which Point Configurations are Deter-mined by the Distribution of their Pairwise Distances? Int J Compt Geometry and Appl 2007, 17:31-43.
45. Alt H, Guibas L: Discrete Geometric Shapes: Matching, Inter-polation, and Approximation. In Handbook of Computational Geometry 1st edition. Edited by: Sack JR, Urrutia J. Amsterdam: Else-vier; 1999:121-153.
46. Besl PJ, McKay ND: A Method for Registration of 3-d Shapes.
IEEE Trans Pattern Analysis and Machine Intelligence 1992, 14:239-256. 47. Gelfand N, Ikemoto L, Rusinkiewicz S, Levoy M: Geometrically Stable Sampling for the ICP Algorithm. Proc International Con-ference on 3D Digital Imaging and Modeling, Canada 2003:260-267. 48. Har-Peled S, Sadri B: How Fast is the K-Means Method?
Algorith-mica 2005, 41:185-202.