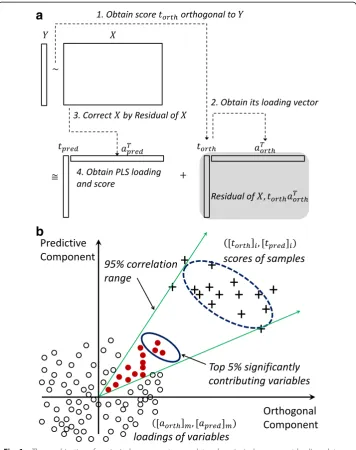
A biplot correlation range for group-wise metabolite selection in mass spectrometry
Full text
Figure
Related documents
In case the thesis is imple- mented in an R & D project of the University of Applied Sciences, the student shall act as a real developer in the project, and the project
(PDF Format) User 1.0 Request examination result slip Matric No Examination ID IC No NowSMS IC No Examination ID Matric No 4.0 Send examination result slip Examination results slip
Users Mobile Network Operators Global Carriers / Service Providers Digital Enterprises Unlimited Capability On-demand Artificial Intelligence Hyperscale database Cloud
Note that if buyer market power does characterise the UK food sector, then the supply and demand shifters should enter our econometric model of the margin between retail
While the thermal denatu- ration curves of reduced barstar and barstar(ESOA) obtained by far and near UV CD are virtually identical, the tertiary structure in both
Any SSO architecture that may employ multiple authentication servers (authentication information replication, token-based, proxy-based, and identity-provider redirection
The post-outburst spectra of the two classical novae were obtained using the High Dispersion Spectrograph (HDS) (Noguchi et al. Figure 1 shows the AAVSO light curves of two novae
Numerical Approximation of Partial Differential Equations, Preconditioning Techniques, Computational Fluid Mechanics, Domain Decomposition Methods, Multiscale Modeling,


