Growth of Very Low Birth Weight Infants to Age 20 Years
Maureen Hack, MB, ChB*; Mark Schluchter, PhD*; Lydia Cartar, MA*; Mahboob Rahman, MD, MS‡;
Leona Cuttler, MD*; and Elaine Borawski, PhD§
ABSTRACT. Objective. Intrauterine and neonatal
growth failure of very low birth weight (VLBW;<1500 g) infants may influence adult growth attainment and have long-term implications for adult health. As part of a longitudinal study of VLBW infants, we sought to exam-ine gender-specific changes in growth from birth to 20 years old and to identify the correlates of growth attain-ment at 20 years old.
Design, Setting, Participants. A cohort of 103 male and 92 female VLBW infants who had a mean birth weight of 1189 g and mean gestational age of 29.8 weeks, were born from 1977 through 1979 and treated at Rain-bow Babies and Children’s Hospital in Cleveland, Ohio, and were free of neurosensory impairment were fol-lowed prospectively from birth and compared with a population-based sample of 101 male and 107 female normal birth weight (NBW) controls selected at 8 years old. Maternal sociodemographic status and infant birth and neonatal data did not differ significantly between male and female VLBW subjects. However, male VLBW subjects had significantly higher rates of rehospitaliza-tion during infancy than female VLBW (39% vs 21%). At 20 years, their rates of chronic illness were similar (18% vs 24%).
Main Outcome Measures. Weight and heightzscores were computed at birth, 40 weeks, 8 and 20 months, and 8 and 20 years among the VLBW subjects, and at 8 and 20 years among the NBW controls. Body mass index (BMI)z
scores were computed at 8 and 20 years. Among the VLBW subjects, gender-specific longitudinal growth measures were examined at birth, at the expected term date (40 weeks corrected age), and at 8 and 20 months, and 8 and 20 years of age. In addition, we compared the weight, height, and BMI of the VLBW and NBW controls at 8 and 20 years. Predictors of 20-year growth were examined via multivariate analyses.
Results. Among the VLBW males, mean weight for agez scores at birth, 40 weeks, and 8 years wereⴚ0.7,
ⴚ1.8, and ⴚ0.5; and height for age zscores were ⴚ1.2,
ⴚ2.6, and ⴚ0.5, respectively. For VLBW females, mean weight for age zscores were ⴚ1.1, ⴚ2.0, and ⴚ0.2 and height for agezscores wereⴚ1.2,ⴚ2.4, andⴚ0.2, respec-tively. At 8 years of age, VLBW males had a significantly lower mean weight, height, and BMI than NBW controls, whereas VLBW females differed significantly from their NBW controls in mean weight and BMI but not in height. Catch-up growth in weight, height, and BMI occurred between 8 and 20 years among VLBW females but not among VLBW males who remained significantly smaller
than their controls at 20 years old. At 20 years mean weight of VLBW males was 69 kg versus 80 kg for con-trols (z score ⴚ0.4 vs ⴙ0.5); mean height was 174 cm versus 177 cm (zscoreⴚ0.4 vsⴙ0.03) and mean BMI was 23 versus 26, respectively. For VLBW females, mean weight was 65 kg versus 68 kg for controls (zscoreⴙ0.3 vsⴙ0.5), mean height was 162 versus 163 cm (zscoreⴚ0.3 vsⴚ0.1) and mean BMI was 25 versus 25, respectively. Rates of obesity (BMI >30) for VLBW males were 7% compared with 15% for controls and for VLBW females 15% compared with 18% for controls. Age of menarche was 12.4 years for VLBW females and 12.3 years for controls.
Nineteen (18%) male and 20 (22%) female VLBW sub-jects were born small for gestational age (SGA; weight less thanⴚ2 standard deviation for gestational age). At 20 years, significantly more SGA than appropriate for ges-tational age VLBW males remained subnormal (less than
ⴚ2 standard deviation) in weight (32% vs 6%) and height (21% vs 4%), whereas rates of subnormal growth did not differ significantly between SGA and appropriate for gestational age females (weight 5% vs 1%, height 0% vs 7%).
Predictor variables included in the multivariate analy-ses of 20-year growth attainment were maternal educa-tion and height, race, birth weightzscore (a measure of intrauterine growth failure), neonatal hospital stay (a mea-sure of neonatal illness), and chronic illness at 20 years.
Twenty-year weight was predicted by black race and chronic illness among females. Twenty-year height was predicted by maternal height and birth weight zscore among both males and females and by duration of neo-natal hospital stay among males only. In a separate model, when we examined the effect of being SGA at birth instead of the effect of birth weightzscore, SGA birth was predictive of 20-year height among males but not among females.
Conclusions. VLBW females catch up in growth by 20 years of age whereas VLBW males remain significantly shorter and lighter than controls. Since catch-up growth may be associated with metabolic and cardiovascular risk later in life, these findings may have implications for the future adult health of VLBW survivors. Pediatrics
2003;112:e30 –e38. URL: http://www.pediatrics.org/cgi/ content/full/112/1/e30; growth, adult, very low birth weight.
ABBREVIATIONS. VLBW, very low birth weight; NBW, normal birth weight; BMI, body mass index; SGA, small for gestational age; AGA, appropriate for gestational age; SD, standard deviation; CDC, Centers for Disease Control and Prevention.
D
isturbances of intrauterine and postnatal
growth during critical periods of human
de-velopment may have long-term implications
for adult health. It has been hypothesized that
adap-From the *Departments of Pediatrics, ‡Medicine, and §Epidemiology and Biostatistics, Case Western Reserve University, Cleveland, Ohio. Received for publication Dec 6, 2002; accepted Mar 14, 2003.
Reprint requests to (M.H.) Division of Neonatology, Ste 3100, Rainbow Babies and Children’s Hospital, University Hospitals of Cleveland, 11100 Euclid Ave, Cleveland, OH 44106. E-mail: mxh7@po.cwru.edu
tations the fetus or young infant makes when
under-nourished induce alterations in metabolism,
hor-monal output, and distribution of cardiac output,
which result in central obesity, diabetes, and
cardio-vascular disease in middle age.
1There is also
evi-dence that subjects who demonstrate catch-up
growth are at greatest risk for these sequelae.
2–5Studies of the long-term growth of very low birth
weight (VLBW) infants (those weighing
⬍
1500 g),
the majority of whom experience intrauterine and/or
neonatal growth failure may thus yield important
information in this regard.
6 –9Recent reports of the
adolescent growth attainment of VLBW infants
indi-cate that catch-up occurs during childhood;
how-ever, they continue to lag behind in growth when
compared with normal birth weight (NBW)
con-trols.
10 –15The only report of the adult growth
attain-ment of VLBW infants is a report of 19-year-old male
conscripts to the Swedish army that found that those
born with VLBW were shorter and lighter than the
rest of the population.
16There have been no reports
of adult growth attainment of VLBW women.
As part of a longitudinal study of the outcomes of
VLBW infants we sought to examine gender-specific
changes in growth from birth to 20 years and to
identify the correlates of growth attainment at 20
years old.
17–19METHODS VLBW Group
A cohort of 490 VLBW infants was admitted to Rainbow Babies and Children’s Hospital in Cleveland, Ohio, between 1977 and 1979, of whom 312 children (64%) survived. Seventy subjects were lost to follow-up and 242 (78%) subjects were followed to 20 years of age.20 Forty-seven subjects were excluded from the present
20-year study of growth; 25 had neurosensory impairments, 1 had Liddles syndrome, 12 women were pregnant, and 9 had missing growth measurements. The population thus included 195 VLBW
subjects who had weight and height measures at 20 years old. They constituted 68% of the birth cohort who did not have neu-rosensory impairments. They had a mean birth weight of 1189 g and mean gestational age of 29.8 weeks; 105 were black and 90 white; 103 were male and 92 female. Length was measured at birth in 72 of the males and 59 of the females. Height was measured in 159 of their mothers.
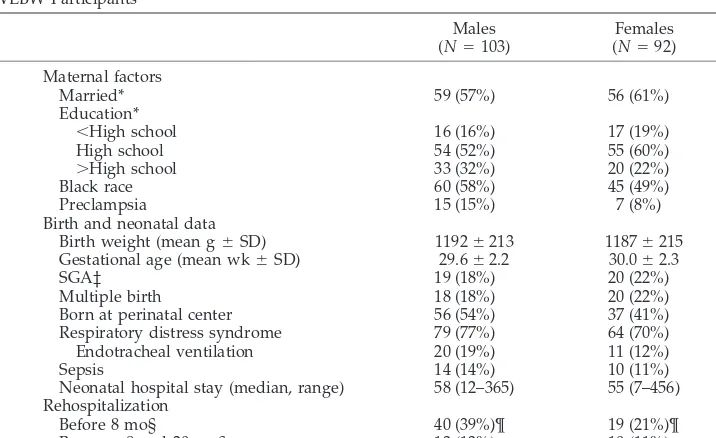
A description of maternal sociodemographic status, infant data, and rates of rehospitalization of the VLBW cohort is presented in Table 1. Males and females did not differ in maternal sociodemo-graphic status or in infant birth data, but the males had signifi-cantly higher rates of rehospitalization before 8 months. At 20 years, 18% of the males and 24% of the females reported chronic conditions (P⫽.29). These included medical or psychiatric illness lasting 12 months or more.20
The 20-year-old participants did not differ significantly from the birth cohort of nonparticipant survivors in maternal sociode-mographic status or in infant birth or neonatal descriptors with the exception that there were fewer females (47% vs 61%), attrib-utable to the exclusion of those pregnant at the time of study. The female participants had a significantly shorter neonatal hospital stay than the female nonparticipants (P⬍.05). Female participants who had birth length measures had a significantly higher birth weight and gestational age than those without birth length mea-sures (P⬍.05). Fewer of the mothers who had height measured compared with those who did not have height measured (n⫽36) had less than high school education (13% vs 36%, P ⬍ .01), although they did not differ in marital status, race, or in their children’s birth data.
NBW Control Group
The original control group included 366 NBW children born in 1977, 1978, and 1979, who were selected at age 8 years by means of a population sampling procedure.21Two hundred thirty-three
(64%) were followed to 20 years old, of whom 25 were excluded from the growth study; 1 had neurosensory impairment, 9 women were pregnant, and 15 had missing growth measures. The control population thus included 208 participants. They constituted 57% of those recruited at 8 years of age. Height was measured in 180 of their mothers.
The 208 controls had a mean birth weight of 3277 g. They were born at term gestation (⬎37 weeks); however, specific information on their gestational age was not available: 110 were black and 98 white; 101 were male and 107 female. They did not differ in birth
TABLE 1. Maternal Demographic Status and Infant Birth and Neonatal Data for Male and Female VLBW Participants
Males (N⫽103)
Females (N⫽92) Maternal factors
Married* 59 (57%) 56 (61%)
Education*
⬍High school 16 (16%) 17 (19%)
High school 54 (52%) 55 (60%)
⬎High school 33 (32%) 20 (22%)
Black race 60 (58%) 45 (49%)
Preclampsia 15 (15%) 7 (8%)
Birth and neonatal data
Birth weight (mean g⫾SD) 1192⫾213 1187⫾215 Gestational age (mean wk⫾SD) 29.6⫾2.2 30.0⫾2.3
SGA‡ 19 (18%) 20 (22%)
Multiple birth 18 (18%) 20 (22%)
Born at perinatal center 56 (54%) 37 (41%) Respiratory distress syndrome 79 (77%) 64 (70%) Endotracheal ventilation 20 (19%) 11 (12%)
Sepsis 14 (14%) 10 (11%)
Neonatal hospital stay (median, range) 58 (12–365) 55 (7–456) Rehospitalization
Before 8 mo§ 40 (39%)¶ 19 (21%)¶
Between 8 and 20 mo§ 13 (13%) 10 (11%)
* The maternal status at the child’s eighth year. ‡ Less than⫺2 SD.26
weight or gender from the 156 nonparticipants, but 10% of the participants’ mothers had less than high school education com-pared with 26% of the nonparticipants’ mothers; 64% versus 42% were married and 53% versus 75% were black (P⬍.001 for all comparisons). The mothers who had height measured did not differ in race, education, or marital status from those not mea-sured.
Comparison of VLBW to Control Group
Fewer mothers of the VLBW participants than mothers of the controls had graduated from high school (17% vs 10%, respec-tively,P⬍.05). They did not differ in marital status (59% vs 64% married) or race (54% vs 53% black). Age of menarche was 12.4 years for the VLBW and 12.3 years for the NBW participants (P⫽
.55).
Follow-up Protocol
The methods of neonatal care have been previously de-scribed.9,22Weight and length were measured at birth and
longi-tudinally at the expected term date of delivery (40 weeks after the last menstrual period), and then at 8 months, 20 months, and 8 years of age corrected for preterm birth, and at 20 years postnatal age. Participants were weighed unclothed at all time periods before 20 years. At 20 years, they were weighed lightly clothed on an electronic portable scale. To correct for the weight of clothing, similar to others, we subtracted 0.5 kg from the measured weight of females and 1.0 kg from that of males.23,24At birth, length was
measured with a tape measure in the isolette or crib. At 40 weeks and at 8 and 20 months, length was measured supine using a Harpenden Infantometer. At 8 and 20 years, standing height was measured with a Harpenden Stadiometer after removing shoes and stockings.25
At birth and at the corrected term date, weight and lengthz
scores (ie, standard deviation [SD] scores) were computed from the intrauterine growth standards of Usher.26 We used these
norms, which include mainly white infants and are not sex-spe-cific because available intrauterine growth data in the United States do not include length or head circumference27–29. At 8 and
20 months and 8 and 20 years, weight and heightzscores were computed from the revised Centers for Disease Control and Pre-vention (CDC) growth data, which are sex-specific.30We usedz
scores because they provide a more sensitive assessment of growth than percentile cut-offs.25,31Because clinicians are
inter-ested in classifying children categorically, participants were also categorized as having subnormal weight or height if the measure fell below⫺2 SD for age.30We used the 20-year norms for the 12
subjects (7 male, 5 female) who were 21 years and older. Body mass index (BMI) was calculated as the relation of body weight to height squared (wt/ht2kg/m2), andzscores were computed at 8
and 20 years.30 The study was approved by the Institutional
Review Board of University Hospitals of Cleveland and written informed consent obtained from all participants.
Documentation of Correlates of Growth
Variables examined for their relationship to growth included maternal marital status, level of education, race, height, and pre-eclampsia. Infant data considered included birth weight, gesta-tional age, the birth weightzscore used as a measure of intrauter-ine growth, multiple birth, and the duration of the neonatal hospital stay. We used the duration of neonatal hospital stay as the measure of severity of neonatal illness because it represents an index of immaturity and severity of respiratory distress syndrome such as oxygen and ventilator dependence.32,33Rehospitalization
was used as a measure of morbidity during infancy. Additional variables included age at menarche and chronic illness at 20 years, which had lasted 12 months or more. We used the mother’s educational status at the time the child was 8 years old as a proxy for social class, because it was considered to span childhood and be more relevant to child growth and development than their 20-year educational status.20Results pertaining to head
circumfer-ence measures and their correlates will be the subject of a separate report.
Data Analysis
The analyses were conducted separately for male and female participants. Within the VLBW cohort, we first examined weight, length, and BMI and their respectivezscores at each time of study. We also compared the VLBW and NBW controls, using 2 sample
ttests at 8 years and 20 years of age with regard to weight, height, BMI, and their respectivez scores. This comparison was made because our Cleveland population differs sociodemographically from the national population used for the CDC norms.30 The
results of the comparisons were adjusted for maternal level of education and race via multiple linear regression.
We initially performed univariate linear regression analyses to examine the effects of the potential correlates of the weight, height/length, and BMIzscores at 20 years. Multivariate linear regression analyses were then performed with maternal level of education and race entered together with the main factors found to be significant in the univariate analyses. In separate models, we examined the effects of being small for gestational age (SGA; less than⫺2 SD birth weight for gestation), the effect of multiple birth, and among females, the effect of age of menarche. Logistic regres-sion was also used to examine correlates of subnormal (less than
⫺2 SD) weight and height at 20 years old.
RESULTS Growth From Birth to 20 Years Weight
The mean weight
z
scores at birth for VLBW males
and females were
⫺
0.73 and
⫺
1.12, respectively.
These decreased to
⫺
1.79 and
⫺
2.0 by 40 weeks
because of neonatal growth failure and then
in-TABLE 2. VLBW Participants: Weight and Height Measures From Birth to 20 Months Corrected Age
Weight Height
N Mean⫾SD (kg)
zScore⫾SD* Less Than
⫺2 SD*
N Mean⫾SD (cm)
zScore⫾SD* Less Than
⫺2 SD* Males†
Birth 103 1.2⫾0.2 ⫺0.73⫾1.34 19 (18%) 72 38⫾3 ⫺1.18⫾2.16 19 (26%) 40 wk (term) 101 2.6⫾0.7 ⫺1.79⫾1.44 58 (57%) 85 46⫾3 ⫺2.56⫾1.71 51 (60%) 8 mo 99 7.8⫾1.3 ⫺1.70⫾1.48 38 (38%) 96 69⫾4 ⫺0.94⫾1.53 22 (23%) 20 mo 100 11.0⫾1.7 ⫺1.16⫾1.43 24 (24%) 100 83⫾5 ⫺0.55⫾1.26 13 (13%) Females§
Birth 92 1.2⫾0.2 ⫺1.12⫾1.09 20 (22%) 59 39⫾3 ⫺1.22⫾1.65 17 (29%) 40 wk (term) 90 2.5⫾0.5 ⫺2.00⫾1.02 45 (50%) 75 46⫾3 ⫺2.38⫾1.38 45 (60%) 8 mo 91 7.6⫾1.2 ⫺1.09⫾1.35 19 (21%) 91 68⫾4 ⫺0.51⫾1.18 9 (10%) 20 mo 90 10.8⫾1.5 ⫺0.82⫾1.37 16 (18%) 89 83⫾5 ⫺0.16⫾1.37 9 (10%) * Usher’s norms used at birth and 40 weeks26and CDC norms30at 8 months and 20 months corrected age.
† For males, mean corrected ages for growth measures were 40.3 weeks at the term assessment, 8.6 months at the 8-month assessment, and 21.1 months at the 20-month assessment.
creased to
⫺
0.35 and
⫹
0.26, respectively, by 20 years
(Tables 2 and 4 and Fig 1). The decrease in weight
z
score from birth to 40 weeks was similar among
males and females (Table 3). However, between 40
weeks and 8 months, and between 8 years and 20
years, VLBW females demonstrated a significantly
greater increase in weight
z
score than males. In
contrast, among the NBW controls, the increases in
weight
z
score between 8 years and 20 years were
similar for males and females.
Compared with their NBW controls, VLBW males
and females had significantly lower mean weight
z
scores at 8 years of age. These differences persisted
among the males at 20 years, whereas among the
females they were no longer significant. At 20 years,
VLBW males weighed a mean of 11 kg less than their
NBW controls, whereas the females weighed only 2
kg less than their controls (Table 4).
Height
The mean length
z
scores at birth for VLBW males
and females were
⫺
1.18 and
⫺
1.22, respectively.
These decreased to
⫺
2.56 and
⫺
2.38 by 40 weeks and
increased to
⫺
0.44 and
⫺
0.26 by 20 years (Tables 2, 4,
and Fig 1).
The decrease in length
z
scores from birth to 40
weeks and the later increases in height
z
scores
be-tween the various time periods of the study did not
differ significantly between males and females (Table
3).
Compared with their NBW controls, VLBW males
had significantly lower mean height
z
scores at both
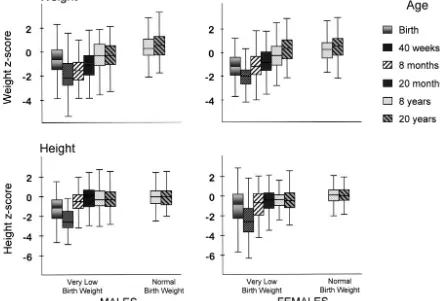
Fig 1. Weight and heightzscores at each age, contrasted between males and females. Box plots show median (solid line in box), the interquartile range (top and bottom of the box), and the range of the data.
TABLE 3. Distance Growth of Weight and Height Expressed as Changes in zScores Between Time Periods of Study
Changes inzScores Weight Height
Males Females P Males Females P
VLBW*
Birth to 40 wk ⫺1.05 ⫺0.88 0.36 ⫺1.32 ⫺1.13 0.60 40 wk to 8 mo 0.20 0.93 ⬍0.001 1.78 1.97 0.44
8 mo to 20 mo 0.53 0.27 0.06 0.39 0.32 0.66
20 mo to 8 y 0.66 0.58 0.63 0.09 ⫺.06 0.29
8 y to 20 y 0.13 0.49 0.002 0.03 ⫺0.09 0.24
NBW
8 y to 20 y 0.20 0.25 0.67 0.01 ⫺0.08 0.39
8 and 20 years, whereas the females did not differ
significantly from their controls at either 8 or 20
years.
The mothers of the VLBW males tended to be
shorter than mothers of controls (mean height 161.6
vs 163.5 with
z
scores of
⫺
0.26 and 0.02, respectively,
P
⫽
.06). The mean height of mothers of the VLBW
females was similar to that of their control mothers
(162.3 vs 163.1 cm with
z
scores of
⫺
0.16 and
⫺
0.04,
respectively,
P
⫽
.48). There was a significant
rela-tionship between the maternal height
z
score and
that of her young adult child;
r
⫽
0.50 and 0.32 for
VLBW males and females and their mothers,
respec-tively, and
r
⫽
0.44 and 0.57 for the NBW controls
and their mothers, respectively (all
P
⬍
.05).
BMI
Compared with their NBW controls, the VLBW
males had a significantly lower BMI at both 8 years
and 20 years, whereas the VLBW females differed
from their controls at 8 years but not at 20 years
(Table 4). This was because of the significantly
greater female increase in BMI
z
score between 8 and
20 years (0.58 vs 0.02,
P
⬍
.001). At 20 years, 6% of the
VLBW males were underweight (BMI
⬍
18.5)
com-pared with 2% of their controls; 18% versus 29%
were overweight (BMI 25–29.9) and 7% versus 15%,
respectively, were obese (BMI
ⱖ
30;
2for trend,
P
⫽
.02).
25In contrast, at 20 years 2% of the VLBW
fe-males were underweight compared with 7% of the
controls; 21% vs 23% were overweight, and 15% vs
18%, respectively, were obese (
2for trend,
P
⫽
.36)
.
Growth Outcomes of SGA Infants
Nineteen (18%) male and 20 (22%) female VLBW
participants had a subnormal (less than
⫺
2 SD) birth
weight for gestational age and were considered
SGA.
26The rates of subnormal growth attainment for
the SGA and appropriate for gestational age (AGA)
subjects at the various time points of study are
pre-sented in Fig 2. At 20 years, significantly more SGA
than AGA males remained subnormal (less than
⫺
2
SD) in weight (32% vs 6%,
P
⫽
.005) and in height
(21% vs 4%,
P
⫽
.02), whereas SGA females did not
differ significantly from their AGA counterparts in
rates of subnormal weight (5% vs 1%,
P
⫽
.39) or
subnormal height (0% vs 7%,
P
⫽
.58).
Correlates of 20-Year Weight, Height, and BMIzScores
Predictor variables included in the multivariate
analyses of 20-year growth attainment were maternal
education, race, maternal height, birth weight
z
score, the neonatal hospital stay, and chronic illness.
Among females, black race and chronic illness were
TABLE 4. Comparison of Weight, Height, and BMI Between VLBW and NBW Participants at 8 and 20 Years
Males Females
VLBW (N⫽103)
NBW (N⫽101)
Mean Difference or Odds Ratio†§
(95% CI)
VLBW (N⫽92)
NBW (N⫽107)
Mean Difference or Odds Ratio†§
(95% CI)
8 y†† Weight¶
Mean (kg⫾SD) 26.9⫾5.1 31.1⫾6.3 ⫺4.3 (⫺5.9,⫺2.7)*** 28.0⫾6.3 31.7⫾8.1 ⫺3.6 (⫺5.7,⫺1.5)**
zscore⫾SD ⫺0.46⫾1.31 0.34⫾.96 ⫺0.78 (⫺1.10,⫺0.46)*** ⫺0.23⫾1.14 0.20⫾1.10 ⫺0.39 (⫺0.71,⫺0.07)* Less than⫺2 SD 11 (11%) 1 (1%) 10.6 (1.3, 85.3)* 3 (4%) 2 (2%) 2.0 (0.3, 13.2) Height¶
Mean (cm⫾SD) 129.2⫾6.4 133.1⫾5.9 ⫺3.9 (⫺5.6,⫺2.1)*** 130.2⫾7.6 133.2⫾7.0 ⫺2.9 (⫺5.0,⫺0.8)**
zscore⫾SD ⫺0.45⫾1.04 0.02⫾0.91 ⫺0.46 (⫺0.74,⫺0.18)** ⫺0.20⫾1.16 0.03⫾1.04 ⫺0.21 (⫺0.52, 0.10) Less than⫺2 SD 8 (8%) 3 (3%) 2.6 (0.7, 10.3) 5 (6%) 2 (2%) 2.7 (0.5, 15.0) BMI
Mean (kg/m2⫾SD) 16.0⫾2.2 17.4⫾2.6 ⫺1.5 (⫺2.1,⫺0.8)*** 16.3⫾2.3 17.7⫾3.1 ⫺1.3 (⫺2.1,⫺0.5)**
zscore⫾SD ⫺0.35⫾1.21 0.38⫾0.94 ⫺0.72 (⫺1.03,⫺0.42)*** ⫺0.16⫾1.05 0.29⫾1.03 ⫺0.41 (⫺0.72,⫺0.11)** 20 y§§
Weight
Mean (kg⫾SD) 69.2⫾13.9 79.9⫾16.7 ⫺10.5 (⫺14.8,⫺6.2)*** 64.9⫾16.8 67.6⫾18.3 ⫺2.0 (⫺6.9, 2.8)
zscore⫾SD ⫺0.35⫾1.25 0.53⫾1.06 ⫺0.86 (⫺1.19,⫺0.54)*** 0.26⫾1.17 0.45⫾1.16 ⫺0.14 (⫺0.47, 0.18) Less than⫺2 SD 11 (11%) 0 ⫺‡ (2.23,⬁) 2 (2%) 3 (3%) 0.8 (0.1, 5.1) Height
Mean (cm⫾SD) 173.7⫾7.9 177.0⫾6.8 ⫺3.1 (⫺5.2,⫺1.1)** 161.7⫾7.3 163.0⫾7.0 ⫺1.2 (⫺3.2, 0.9)
zscore⫾SD ⫺0.44⫾1.10 0.03⫾0.95 ⫺0.44 (⫺0.72,⫺0.15)** ⫺0.26⫾1.13 ⫺0.06⫾1.08 ⫺0.18 (⫺0.50, 0.14) Less than⫺2 SD 7 (7%) 3 (3%) 2.3 (0.6, 9.3) 5 (5%) 1 (1%) 4.0 (0.4,36.4) BMI
Mean (kg/m2⫾SD) 22.9⫾4.2 25.5⫾4.9 ⫺2.6 (⫺3.8,⫺1.3)*** 24.7⫾5.2 25.4⫾6.2 ⫺0.5 (⫺2.1, 1.0)
zscore⫾SD ⫺0.33⫾1.24 0.42⫾1.09 ⫺0.75 (⫺1.08,⫺0.43)*** 0.42⫾0.93 0.45⫾1.24 0.03 (⫺0.27, 0.34) CI indicates confidence interval.
*P⬍.05. **P⬍.01. ***P⬍.001.
† Adjusted for maternal education and race.
§ Odds ratio pertains to rates of subnormal (less than⫺2 SD) weight and height.30
‡ Infinite odds ratio.
¶ 99 male and 87 female VLBW and all the NBW subjects had weight and height measurements at age 8 years.
†† For males, mean age at the 8-year assessment was 8.7 years for VLBW and 8.9 years for NBW subjects. For females, mean age at the 8-year assessment was 8.6 years for VLBW and 9.0 years for NBW subjects.
significantly related to the weight
z
score, whereas
among males no individual factor was significant
(Table 5). Among both males and females, maternal
height and birth weight
z
score were significantly
related to the 20-year height
z
score, whereas length
of hospital stay was significant for males only. This
model explained 40% of the variance in 20-year
height attainment among males and 16% of the
vari-ance among females. When correlates of BMI were
examined, maternal education was significantly
re-lated to the 20-year BMI
z
score among males,
whereas black race and the presence of chronic
ill-ness were related to the 20-year BMI
z
score among
females (Table 5).
When we used separate models to examine the
effect of being SGA at birth instead of the effect of the
birth weight
z
score, the findings were similar, with
the exception that among males maternal education
also predicted 20-year height and being SGA was not
predictive of 20-year height among females. In a
separate model when the effect of age of menarche
was examined in females, age of menarche predicted
20-year BMI but not 20-year weight and height.
Compared with the singleton births, the 38
partic-ipants who were of multiple birth (35 twins and 3
triplets) had a significantly lower birth weight
z-score (
⫺
1.47 vs
⫺
0.78,
P
⫽
.002) and higher rates of
subnormal intrauterine growth, ie, more were SGA
at birth (40% vs 15%,
P
⬍
.001). In a model that
examined the correlates of 20-year growth for
single-ton births only, the results were similar to those
when multiple births were included, with the
excep-tion that among singleton males the birth weight
z
score was not related to the 20-year height
z
score,
and among singleton females, maternal height was
related to the 20-year weight
z
score. Exclusion of
multiple births from the model thus resulted in a
diminished effect of the birth weight
z
score on
height attainment among males.
DISCUSSION
This is the first report of the gender-specific
trajec-tory of the growth of VLBW infants born during the
initial years of neonatal intensive care and followed
to young adulthood. The outcomes described in this
report pertain to VLBW infants born in the 1970s.
Since that time, progressive advances in neonatal
intensive care have increased survival. However,
the rates of intrauterine growth failure and of the
neonatal complications of prematurity have not
changed. Furthermore, neonatal growth failure
con-tinues to be a major problem, especially among the
smallest and sickest infants.
8,34Our findings thus
have relevance to current survivors.
The results reveal that male and female VLBW
infants had similar rates of intrauterine and neonatal
growth failure. However, the females demonstrated
greater catch-up in growth than their male
counter-parts such that by 20 years old they did not differ
significantly in weight, height, or BMI when
com-pared with their NBW peers. In contrast, the VLBW
males remained shorter and weighed less than their
NBW controls. The negative effect of neonatal illness
on 20-year height attainment was greater among
males, whereas the positive effects of black race and
chronic illness on 20-year weight and BMI were
Fig 2. Percentage of VLBW infants born AGA or SGA (less than⫺2 SD26) with subnormal (less than⫺2 SD30) weight or height for age
greater among females. The effects of maternal
height on their children’s height and of intrauterine
growth failure were similar for males and females.
We included multiple births in the study because
they constitute a fairly large proportion of VLBW
births. Their high rates of intrauterine growth failure
explain the diminished effect of the birth weight
z
score on growth when only singletons were included
in the multiple regression analyses of growth.
The strengths of this longitudinal study include its
gender specificity, its large size, and the use of
z
scores, which are comparable across ages and
pro-vide a more sensitive assessment of deviations of
growth than the use of percentiles or cut-offs of
subnormal growth.
25,31Consideration of possible
weaknesses include the lack of the fathers’ height, of
parents’ weight, of information concerning neonatal
and childhood nutritional intake, and of the timing
of puberty among males. We may have
underesti-mated final height for some males who can grow
after 20 years old, although the vast majority attain
final height by 18 years old.
35–37Similar to other
studies, length measures at birth were missing for
about a third of the VLBW subjects, mainly because
of the difficulty in stretching immature and sick
in-fants.
11,38This difficulty may also explain the lower
mean birth-length
z
scores when compared with the
corresponding mean birth weight
z
scores. The
fe-male participants had a significantly shorter neonatal
hospital stay and thus less neonatal morbidity than
nonparticipants, which might have contributed to
their better growth attainment. Because males have
higher birth weights than females,
27,28our use of the
Usher growth norms, which are not gender-specific,
may have led to an overestimation of the birth
weight
z
scores among males and a corresponding
underestimation among females, thus influencing
the results of the multiple regression analyses.
How-ever, additional analyses using sex-specific birth
weight norms of both Alexander and Kramer
27,28revealed the effects of the birth weight
z
score on
growth to be similar to those using Usher’s norms,
reassuring the validity of our results (data not
shown).
We and others have previously identified
signifi-cant correlates of growth and catch-up among VLBW
infants including the negative effects of intrauterine
growth failure during childhood and into
adoles-cence;
9,10 –12,15,17,33,38 – 41of neonatal complications
during infancy and early childhood;
8,9,17,33,39and of
parental height during childhood and
adoles-cence.
12,13,15,38,41,42Thus, it is not surprising that
these effects persist into adulthood.
Similar to our findings of poor catch-up growth
among VLBW males, inferior rates of catch-up
growth have been reported for male term-born SGA
children at 4 years and among males with birth
weights of
⬍
1000 g at 14 years.
12,43Saigal
12similarly
reported that females with birth weights of
⬍
1000 g
had a greater increase in BMI than males between
age 8 and 14 years. The sex differences in growth are
probably multifactorial. The greater susceptibility of
VLBW males to neonatal complications is well
de-scribed.
44In our population, males had higher rates
of respiratory distress syndrome and a longer
neo-natal hospital stay than females, but the differences
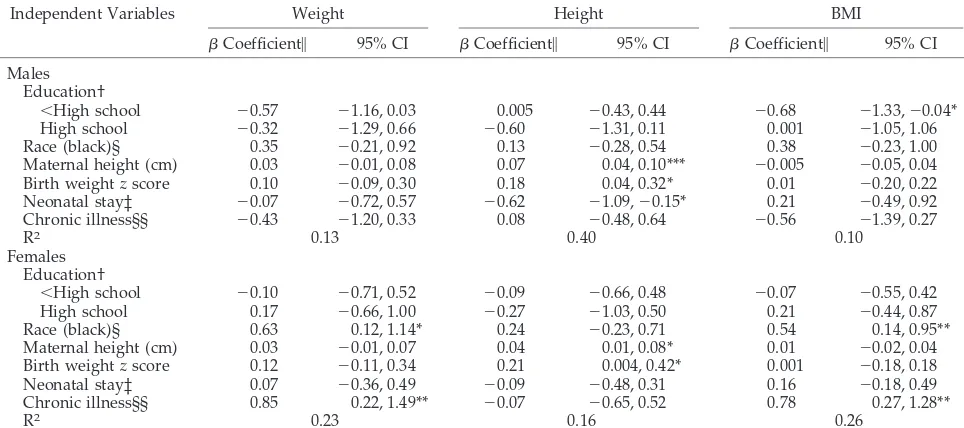
TABLE 5. Multivariate Analysis of Correlates of Weight, Height, and BMIzScores at 20 Years of VLBW Males and Females
Independent Variables Weight Height BMI
Coefficient㛳 95% CI Coefficient㛳 95% CI Coefficient㛳 95% CI Males
Education†
⬍High school ⫺0.57 ⫺1.16, 0.03 0.005 ⫺0.43, 0.44 ⫺0.68 ⫺1.33,⫺0.04* High school ⫺0.32 ⫺1.29, 0.66 ⫺0.60 ⫺1.31, 0.11 0.001 ⫺1.05, 1.06 Race (black)§ 0.35 ⫺0.21, 0.92 0.13 ⫺0.28, 0.54 0.38 ⫺0.23, 1.00 Maternal height (cm) 0.03 ⫺0.01, 0.08 0.07 0.04, 0.10*** ⫺0.005 ⫺0.05, 0.04 Birth weightzscore 0.10 ⫺0.09, 0.30 0.18 0.04, 0.32* 0.01 ⫺0.20, 0.22 Neonatal stay‡ ⫺0.07 ⫺0.72, 0.57 ⫺0.62 ⫺1.09,⫺0.15* 0.21 ⫺0.49, 0.92 Chronic illness§§ ⫺0.43 ⫺1.20, 0.33 0.08 ⫺0.48, 0.64 ⫺0.56 ⫺1.39, 0.27
R2 0.13 0.40 0.10
Females Education†
⬍High school ⫺0.10 ⫺0.71, 0.52 ⫺0.09 ⫺0.66, 0.48 ⫺0.07 ⫺0.55, 0.42 High school 0.17 ⫺0.66, 1.00 ⫺0.27 ⫺1.03, 0.50 0.21 ⫺0.44, 0.87 Race (black)§ 0.63 0.12, 1.14* 0.24 ⫺0.23, 0.71 0.54 0.14, 0.95** Maternal height (cm) 0.03 ⫺0.01, 0.07 0.04 0.01, 0.08* 0.01 ⫺0.02, 0.04 Birth weightzscore 0.12 ⫺0.11, 0.34 0.21 0.004, 0.42* 0.001 ⫺0.18, 0.18 Neonatal stay‡ 0.07 ⫺0.36, 0.49 ⫺0.09 ⫺0.48, 0.31 0.16 ⫺0.18, 0.49 Chronic illness§§ 0.85 0.22, 1.49** ⫺0.07 ⫺0.65, 0.52 0.78 0.27, 1.28**
R2 0.23 0.16 0.26
CI indicates confidence interval. *P⬍.05.
**P⬍.01. ***P⬍.001.
㛳Refers to the unstandardized coefficient of the independent variable in the linear regression model with weightzscore as the dependent variable and containing maternal education, race and height, birth weightzscore, neonatal hospital stay and chronic illness.
† Maternal status at child’s eighth year. Reference group consists of mothers with more than high school education. § Maternal race used, coded as 1 black, 0 white.
‡ Natural log of the length of the neonatal hospital stay (in days).
were not significant. Their higher rates of
rehospital-ization and inferior growth between 40 weeks and 8
months are indicative of poor health resulting from
neonatal sequelae. Genetic potential may also have
played a role since mothers of the male VLBW
sub-jects tended to be shorter than mothers of their
con-trols.
The ability to catch-up in weight among females
might be partly related to their lesser neonatal and
early childhood morbidity. We and others have
noted a similar age of menarche, a correlate of
growth, for the VLBW females and their NBW
con-trols.
10 –12,41,45The relationship of black race to
20-year weight and BMI attainment among the VLBW
females in our cohort is in agreement with the
re-ported association between black race, female sex,
and obesity.
46,47The positive relationship between
chronic illness and 20-year weight and BMI among
our VLBW females is also in agreement with the
reported relationship between asthma and BMI in
women.
48,49We found little evidence in our
popula-tion of a relapopula-tionship between social class, as
mea-sured by maternal education and childhood growth.
The literature in this regard among both normal and
VLBW populations has been inconsistent.
24,46,50,51On the surface, it appears that the male VLBW
subjects might be at a disadvantage in that they
remain shorter than their NBW controls. However,
we are more concerned about the future health of the
VLBW females who as a group caught up in weight
more than in height, 21% of whom were overweight
and 15% obese at 20 years of age. There is growing
evidence that children who grow rapidly during
childhood are more likely to be obese as adults and
at risk for metabolic disturbances such as insulin
resistance and noninsulin-dependent diabetes
melli-tus, and for hypertension and cardiovascular
dis-ease.
2– 4,52,53This risk also pertains to catch-up
growth among term born children following
intra-uterine growth restriction and/or growth failure
during infancy.
CONCLUSIONS
VLBW females catch up in growth by 20 years,
whereas males remain significantly shorter and
thin-ner than controls. Neonatal intensive care has
re-sulted in an increase in the numbers of preterm and
SGA infants who will survive to adulthood. Thus, it
will be important to continue to follow this cohort
into mature adulthood to fully understand the
long-term metabolic and cardiovascular implications of
the preferential catch-up growth of VLBW females.
ACKNOWLEDGMENTS
Supported by grants (RO1 HD34177 and M01 RR00080, General Clinical Research Center) of the National Institutes of Health and in part by a grant (96-46) from the Genentech Foundation for Growth and Development.
We thank Blanche Caron, Debra Hoffman, Susan McGrath, Miriam Curran, Elizabeth Carter, and Terry Reid for their assis-tance in compiling and analyzing the data, and Alpher Torres for creating the figures.
REFERENCES
1. Barker DJP.Mothers, Babies and Health in Later Life.Edinburgh, Scotland: Churchill Livingston; 1998
2. Forsen T, Eriksson JG, Tuomilehto J, Osmond C, Barker DJP. Growth in utero and during childhood among women who develop coronary heart disease: longitudinal study.BMJ. 1999;319:1403–1407
3. Law C. Adult obesity and growth in childhood. BMJ. 2001;323: 1320 –1321
4. Cianfarani S, Germani D, Branca F. Low birthweight and adult insulin resistance: the “catch-up growth” hypothesis.Arch Dis Child Fetal
Neo-natal Ed. 1999;81:F71–F73
5. Fall CHD, Osmond C, Barker DJP, et al. Fetal and infant growth and cardiovascular risk factors in women.BMJ. 1995;310:428 – 432 6. Bukowski R, Gahn D, Denning J, Saade G. Impairment of growth in
fetuses destined to deliver preterm. Am J Obstet Gynecol. 2001;185: 463– 467
7. Hediger ML, Overpeck MD, Kuczmarski RJ, McGlynn A, Maurer KR, Davis WW. Muscularity and fatness of infants and young children born small or large-for-gestational-age.Pediatrics. 2002;102:1–7
8. Ehrenkranz RA, Younes N, Lemons JA, et al. Longitudinal growth of hospitalized very low-birth-weight infants.Pediatrics. 1999;104:280 –289 9. Hack M, Merkatz IR, Gordon D, Jones PK, Fanaroff AA. The prognostic significance of postnatal growth in low-birth-weight infants.Am J Obstet
Gynecol. 1982;143:693– 699
10. Powls A, Botting N, Cooke RWI, Pilling D, Marlow N. Growth impair-ment in very low birth-weight children at 12 years: correlation with perinatal and outcome variables.Arch Dis Child. 1996;75:F152–F157 11. Ford GW, Doyle LW, Davis NM, Callanan C. Very low birth weight and
growth into adolescence.Arch Pediatr Adolesc Med. 2000;154:778 –784 12. Saigal S, Stoskopf BL, Streiner DL, Burrows E. Physical growth and
current health status of infants who were of extremely low birth weight and controls at adolescence.Pediatrics. 2001;108:407– 415
13. Doyle LW. Growth and respiratory health in adolescence of the ex-tremely low-birth-weight survivor.Clin Perinatol. 2000;27:421– 432 14. Hack M, Weissman B, Breslau N, Klein N, Borawski-Clark E, Fanaroff
AA. Health of very low-birth-weight children during their first 8 years.
J Pediatr. 1993;122:887– 892
15. Hack M, Weissman B, Borawski-Clark E. Catch-up growth during child-hood among very-low birth-weight children.Arch Pediatr Adolesc Med. 1996;150:1122–1129
16. Ericson A, Kallen B. Very low birthweight boys at the age of 19.Arch Dis
Child Fetal Neonatal Ed. 1998;78:F171–F174
17. Hack M, Merkatz IR, McGrath SK, Jones PK, Fanaroff AA. Catch-up growth in very low-birth-weight infants: clinical correlates.Am J Dis
Child. 1984;138:370 –375
18. Hack M, Breslau N. Very low birth weight infants: effects of brain growth during infancy on intelligence quotient at 3 years of age. Pedi-atrics. 1986;77:196 –202
19. Hack M, Breslau N, Fanaroff AA. Differential effects of intrauterine and postnatal brain growth failure in infants of very low birth weight.Am J
Dis Child. 1989;143:63– 68
20. Hack M, Flannery DJ, Schluchter M, Cartar L, Borawski E, Klein N. Outcomes in young adulthood for very-low-birth-weight infants.
N Engl J Med. 2002;346:149 –157
21. Hack M, Breslau N, Aram D, Weissman B, Klein N, Borawski-Clark E. The effect of very low birth weight and social risk on neurocognitive abilities at school age.J Dev Behav Pediatr. 1992;13:412– 420
22. Klaus MH, Fanaroff AA.Care of the High Risk Neonate. 2nd ed. Phila-delphia, PA: W. B. Saunders; 1979
23. Freeman JV, Cole TJ, Chinn S, Jones PRM, White EM, Preece MA. Cross sectional stature and weight reference curves for the UK, 1990.Arch Dis
Child. 1995;73:17–24
24. Hardy R, Wadsworth M, Kuh D. The influence of childhood weight and socioeconomic status on change in adult body mass index in a British national birth cohort.Int J Obes. 2000;24:725–734
25. Physical status: the use and interpretation of anthropometry: report of a WHO expert committee:WHO Tech Rep Ser.1995;854:1– 452 26. Usher R, McLean F. Intrauterine growth of live-born Caucasian infants
at sea level: standards obtained from measurements in 7 dimensions of infants born between 25 and 44 weeks of gestation.Pediatrics. 1969;74: 901–910
27. Alexander GR, Himes JH, Kaufman RB, Mor J, Kogan M. A United States National Reference for fetal growth. Obstet Gynecol. 1996;87: 163–168
28. Kramer MS, Platt RW, Wen SW. A new and improved population-based Canadian reference for birth weight for gestational age. Pediatrics 2001; 108(2). Available at: www.pediatric.org/cig/content/full/108/2/e35 29. Zhang J, Bowes WA, Jr. Birth-weight-for-gestational-age patterns by
race, sex, and parity in the United States population.Obstet Gynecol. 1995;86:200 –208
charts: United States. Advance data from vital and health statistics; no. 314. Hyattsville, Maryland: National Center for Health Statistics, 2000 31. Shann F. Nutritional indices: Z, centile, or percent?Lancet. 1993;341:
526 –527
32. Cotten M, Oh W, McDonald S, Fanaroff AA, et al. Predictors of pro-longed hospital stay (PHS) for extremely low birth weight (ELBW) infants [abstract].Pediatr Res.2002;51:375A
33. Ross G, Krauss AN, Auld PAM. Growth achievement in low-birth-weight premature infants: relationship to neurobehavioral outcome at one year.J Pediat. 1983;103:105–108
34. Embleton NE, Pang N, Cooke RJ. Postnatal malnutrition and growth retardation: an inevitable consequence of current recommendations in preterm infants.Pediatrics. 2001;107:270
35. Kemper HCG, ed.The Amsterdam Growth Study: A Longitudinal Analysis
of Health, Fitness, and Lifestyle.Champaign, IL: Human Kinetics
Publish-ers Inc; 1995
36. Roche AF, Davila GH. Late adolescent growth in stature.Pediatrics. 1972;50:874 – 890
37. He Q, Albertsson-Wikland K, Karlberg J. Population-based body mass index reference values from Go¨teborg, Sweden: birth to 18 years of age.
Acta Pædiatr. 2000;89:582–592
38. Fewtrell MS, Cole TJ, Bishop NJ, Lucas A. Neonatal factors predicting childhood height in preterm infants: evidence for a persisting effect of early metabolic bone disease.J Pediatr. 2000;137:668 – 673
39. Astbury J, Orgill AA, Bajuk B, Yu VYH. Sequelae of growth failure in appropriate for gestational age, very low-birth-weight infants.Dev Med
Child Neurol. 1986;28:472– 479
40. Elliman A, Bryan E, Elliman A, Walker J, Harvey D. The growth of low-birth-weight children.Acta Pædiatr. 1992;81:311–314
41. Peralta-Carcelen M, Jackson DS, Goran MI, Royald SA, Mayo MS, Nelson KG. Growth of adolescents who were born at extremely low birth weight without major disability.J Pediatr. 2000;136:633– 640 42. Qvigstad E, Verloove-Vanhorick SP, Ens-Dokkum MH, et al. Prediction
of height achievement at five years of age in children born very preterm
or with very low-birth-weight: continuation of catch-up growth after two years of age.Acta Pædiatr. 1993;82:444 – 448
43. Albertsson-Wikland K, Wennergren G, Wennergren M, Vilbergsson G, Rosberg S. Longitudinal follow-up of growth in children born small for gestational age.Acta Pædiatr. 1993;82:438 – 443
44. Stevenson DK, Verter J, Fanaroff AA, et al. Sex differences in outcomes of very low-birth-weight infants: the newborn male disadvantage.Arch
Dis Child Fetal Neonatal Ed. 2000;83:F182–F185
45. Kaplowitz PB, Slora EJ, Wasserman RC, Pedlow SE, Herman-Giddens ME. Earlier onset of puberty in girls: relation to increased body mass index and race.Pediatrics. 2001;108:347–353
46. Stettler N, Tershakovec AM, Zemel BS, et al. Early risk factors for increased adiposity: a cohort study of African American subjects fol-lowed from birth to young adulthood.Am J Clin Nutr. 2000;72:378 –383 47. Troiano RP, Flegal KM, Kuczmarski RJ, Campbell SM, Johnson CL. Overweight prevalence and trends for children and adolescents.Arch
Pediatr Adolec Med. 1995;149:1085–1091
48. Chen Y, Dales R, Tang M, Krewski D. Obesity may increase the inci-dence of asthma in women but not in men: longitudinal observations from the Canadian National Population Health Surveys.Am J Epidemiol. 2002;155:191–197
49. Shaheen SO, Sterne AC, Montgomery SM, Azima H. Birth weight, body mass index and asthma in young adults.Thorax. 1999;54:396 – 402 50. Teranishi H, Nakagawa H, Marmot M. Social class difference in catch
up growth in a national British cohort.Arch Dis Child. 2001;184:218 –221 51. Seidman DS, Gale R, Stevenson DK, Laor A, Bettane PA, Danon YL. Is the association between birthweight and height attainment independent of the confounding effect of ethnic and socioeconomic factors?Isr J Med Sci. 1993;29:772–776
52. Eriksson JG, Forse´n T, Tuomilehto J, Osmond C, Barker DJP. Early growth and coronary heart disease in later life: longitudinal study.BMJ. 2001;318:427– 431