O R I G I N A L R E S E A R C H
Decreased PTGDS Expression Predicting Poor
Survival of Endometrial Cancer by Integrating
Weighted Gene Co-Expression Network Analysis
and Immunohistochemical Validation
This article was published in the following Dove Press journal: Cancer Management and Research
Ruoyao Zou1,2
Mingjun Zheng3
Mingzi Tan4
Haoya Xu1,2
Nannan Luan1
Liancheng Zhu 1,2
1Department of Obstetrics and
Gynecology, Shengjing Hospital of China Medical University, Shenyang, Liaoning 110004, People’s Republic of China;2Key
Laboratory of Maternal-Fetal Medicine of Liaoning Province, Key Laboratory of Obstetrics and Gynecology of Higher Education of Liaoning Province, Shenyang, Liaoning, People’s Republic of China;
3Department of Obstetrics and
Gynecology, University Hospital, LMU Munich, Munich, Germany;4Department
of Gynecology, Cancer Hospital of China Medical University, Liaoning Cancer Hospital & Institute, Shenyang, Liaoning 110042, People’s Republic of China
Purpose:To identify key pathogenic genes and reveal the potential molecular mechanisms of endometrial cancer (EC) using bioinformatics analysis and immunohistochemistry validation.
Materials and Methods: Through weighted gene co-expression network analysis (WGCNA), a co-expression network was constructed based on the top 25% variant genes in the GSE50830 dataset downloaded from gene expression omnibus (GEO). GO and KEGG pathway enrichment analyses were performed using the DAVID online tool. Candidate genes
were selected using the cytoHubba plug-in of Cytoscape, mRNA expression levels and
prognostic values in EC were analyzed by Oncomine, GEPIA, and Kaplan–Meier Plotter
database to determine hub genes. One hub gene was validated by immunohistochemical
(IHC) staining of 116 paraffin-embedded endometrial tissues and TCGA-UCEC cohort.
Genes co-expressed with this hub gene were identified by LinkedOmics. Finally, its
correla-tion with immune infiltration was evaluated by TIMER.
Results:Three co-expression modules andfive candidate genes in each module were obtained
by WGCNA; four hub genes were identified (LGR5, SST, ZNF558, and PTGDS). The mRNA
levels of LGR5 and SST were significantly upregulated in EC, whereas those of ZNF558 and
PTGDS were significantly downregulated; the expression of all four genes was associated with
EC prognosis. Further validation demonstrated that PTGDS was significantly downregulated in
the EC group compared with the atypical hyperplasia and normal endometrial groups, and its low expression was an independent risk factor for worse prognosis of EC. Biological function analysis indicated that PTGDS might be involved in the adaptive immune response, leukocyte migration, as well as in the regulation of cell adhesion molecules and chemokine signaling.
Additionally, PTGDS expression was positively correlated with immune infiltration status of B
cells, CD4+T cells and macrophages.
Conclusion: LGR5, SST, ZNF558, and PTGDS may participate in the development, progression, and prognosis of EC, in which PTGDS may be a novel biomarker and ther-apeutic target for EC.
Keywords:endometrial cancer, bioinformatics analysis, WGCNA, immunohistochemistry, PTGDS
Introduction
Endometrial cancer (EC) is the second most common gynecological malignancy after cervical cancer.1 EC treatment strategies, such as hysterectomy, hormone
Correspondence: Liancheng Zhu Department of Obstetrics and Gynecology, Shengjing Hospital of China Medical University, Shenyang, Liaoning 110004, People’s Republic of China Email medecin@126.com
Cancer Management and Research
Dove
press
open access to scientific and medical research
Open Access Full Text Article
Cancer Management and Research downloaded from https://www.dovepress.com/ by 118.70.13.36 on 27-Aug-2020
therapy, chemotherapy, and radiation therapy, are usually effective in early patients; however, treatment of advanced stages is still unsatisfactory.2The outcomes of EC patients in different stages are very different. The 5-year survival rate in early EC patients is greater than 90%. However, once EC has progressed to a late stage, characterized by aggressive metastasis and high recurrence rate, the 5-year survival rate drops sharply to less than 20%.3 Hence, searching for tumor biomarkers with high sensitivity and specificity and studying their mechanism in the develop-ment of EC are critically important and in high demand.
In the genomic era, a large number of genomic sequen-cing technologies and related databases have emerged, such as The Cancer Genome Atlas (TCGA),4 the Gene Expression Omnibus (GEO) database,5and ArrayExpress. Bioinformatics analysis has become an important tool to screen cancer target genes, contributing to the diagnosis and prognostic prediction of tumors. Gene expression pro-file data of EC has been uploaded to the GEO database. However, few studies have used the GEO database to seek EC-associated genes, and experimental validation offi nd-ings obtained by bioinformatics analysis is lacking.6
Weighted gene co-expression network analysis (WGCNA) explores candidate biomarkers or molecular targets by constructing a scale-free gene co-expression network. The tool has been widely used in cancer-related studies. WGCNA can comprehensively capture key infor-mation in biological networks, and screen gene modules with highly correlated expression. Genes from the same module may have similar biological regulatory functions.7 Based on the correlation between gene modules and phe-notypes, genes that are significantly correlated with certain phenotypes can be identified, which helps to determine the biological processes underlying the clinical characteristics and better understand the mechanisms of hub genes in cancer progression.8
In this study, we analyzed EC expression profile data from the GEO public database using WGCNA and identi-fied EC associated gene modules. Four hub genes includ-ing LGR5, SST, ZNF558 and PTGDS were eventually screened in selected modules. Then we combined the IHC assays of our patient samples and the TCGA-UCEC cohort to verify the differential expression of PTGDS in EC tissues and its value in prognosis prediction. Moreover, our study preliminarily explored the molecular mechan-isms of PTGDS in the development and progression of EC, and the potential connection between PTGDS and
tumor immune infiltration. Our findings provide insight for the diagnosis and treatment of EC.
Materials and Methods
Dataset Collection and Processing
The workflow of this study is shown inFigure 1. Briefly, the GSE50830 gene expression profile dataset provided by Dezso et al (2014) in the GEO database (https://www.ncbi. nlm.nih.gov/geo) was retrieved and analyzed.9 The gene expression data containing 168 EC samples was obtained based on the GPL570 platform (Affymetrix Human Genome U133 Plus 2.0 Array; Affymetrix, Santa Clara, CA, USA). The top 25% variant genes were chosen to construct weighted co-expression networks.
We also downloaded the gene expression data (WorkflowType: HTSeqFPKM) for 543 EC samples and 35 normal endometrial samples from TCGA database (http://cancergenome.nih.gov/). Clinical information was used to assess the influence of PTGDS on the prognosis of patients with EC.
Weight Gene Co-Expression Network
Construction
A scale-free gene co-expression network was constructed using the“WGCNA”in R software.8To ensure reliability of the network structure, samples with limited expression information were removed, and the rest of the samples were used to construct the co-expression network. According to Pearson’s coefficients of pairwise gene cor-relations, the gene expression profile matrix was converted to a Pearson’s correlation matrix. The similarity between gene “m” and gene “n” was defined as Smn=|cor(m, n)|,
and a weighted adjacency matrix was constructed by the power function: amn=power (Smn, β)=|Smn|β. The
correla-tion between genes was emphasized through the soft-thresholding parameter β, and weak correlations were penalized. The pickSoftThreshold function of the WGCNA package was used to determine an appropriate β-value to obtain a scale-free network. Next, the adjacency matrix was converted to a topological overlap matrix and the corresponding dissimilarity values (1-TOM) were calculated.10 Topological overlap measures the biological similarity of two genes according to the correlation of their expression.8 Dissimilarity-based clustering analysis was performed to construct a hierarchically clustering tree. Each branch in the tree represents a gene module and each leaf in the branch represents a gene. Gene modules
Cancer Management and Research downloaded from https://www.dovepress.com/ by 118.70.13.36 on 27-Aug-2020
were obtained using the dynamic tree cut method. The deep split parameter was set as 2 and the minimum size cutoff was set as 30. Highly similar modules were clus-tered together with a height cutoff of 0.25.
Identi
fi
cation of Modules with Clinical
Signi
fi
cance
We used two methods to screen modules related to certain clinical features of EC. First, module eigengene (ME), the principal component of each module, captures most of the information contained in a module. Correlations between ME and various clinical features were measured by Pearson’s correlation coefficients. Highly correlated modules (P<0.05) were screened out. Second, gene significance (GS) represents the degree of correlation between the expression level of each gene and a certain clinical feature. Module significance (MS) can be defined as the average gene sig-nificance across the module genes. Modules with a high MS value are considered to be strongly correlated with certain clinical features. Module membership (MM) measures the correlation between each gene in a module and the ME of the module. Clinical significant modules were further screened by analyzing the correlations between GS and MM. Modules
most significantly correlated with EC phenotypes were selected by the two methods for subsequent analysis.
Function and Pathway Enrichment Analysis
To explore the underlying molecular mechanisms of the modules, Gene Ontology (GO) function and Kyoto Encyclopedia of Genes and Genomes (KEGG) pathway enrichment analyses were performed based on the Database for Annotation, Visualization, and Integrated Discovery (DAVID) (https://david.ncifcrf.gov) to under-stand the biological processes in which the key modules are involved.11 P<0.05 was considered to be significantly enriched.
Identi
fi
cation and Validation of Hub Genes
in Pivotal Modules
CytoHubbaplug-in of Cytoscape 3.5.1 was used to iden-tify hub genes with a high degree of connectivity in the co-expression network, which play a central role in the network.12 According to the degree score provided by
cytoHubba, genes in the network were ranked from high to low. The topfive nodes with the highest degree score were selected as candidate genes. The Kaplan-Meier plot Figure 1Flowchart of the analysis procedure: data preparation, processing, analysis, and validation.
Cancer Management and Research downloaded from https://www.dovepress.com/ by 118.70.13.36 on 27-Aug-2020
(http://kmplot.com) was used to conduct survival analysis to determine if the hub genes were associated with the prognosis of EC.13 Differential expression of the hub genes was analyzed using GEPIA ( http://gepia.cancer-pku.cn/),14 an online tool to analyze gene expression in cancer and paracancerous tissues. In addition, differential expression of the hub genes in various histological types of EC as well as normal endometrial tissues were analyzed using the Oncomine database (https://www.oncomine.org/ ), which is one of the largest cancer microarray integrated data-mining platforms including 715 datasets and 86,733 cancer and normal tissue samples.15Results were summar-ized and comprehensively compared. Differences were considered statistically significant atP<0.05.
Sample Sources and Clinical Data
A total of 116 endometrial paraffin-embedded tissue sam-ples were collected from patients who underwent surgical treatment at the Shengjing Hospital of China Medical University from 2008 to 2014. Pathological diagnosis was made by two pathologists from the Department of Pathology. All EC cases in this study were primary EC and none of the patients received chemotherapy or hor-mone treatment before surgery. Clinical information of the patients was complete. The study was approved by the Clinical Research Ethics Committee of Shengjing Hospital of China Medical University, and all patients provided signed informed consent.
The 116 samples included 87 cases of EC (70 cases of endometrioid adenocarcinoma, 14 cases of serous adeno-carcinoma, and 3 cases of clear cell carcinoma), 17 cases of atypical endometrial hyperplasia, and 12 cases of nor-mal endometrium tissue. The age range (median age) of the patients was 33–70 (57) years in the EC group, 33–65 (49) years in the endometrial atypical hyperplasia group, and 41–57 (47.5) years in the normal endometrial group. There was no significant difference in age distribution among the three groups (P>0.05). In the EC group, there were 16, 34, and 37 cases of well, moderately, and poorly differentiated samples, respectively. According to the International Federation of Gynecology and Obstetrics staging standard (FIGO 2009), there were 38 stage I–II cases and 49 stage III–IV cases. In addition, cases with and without lymph node metastasis were 38 and 49, respectively. There were 42 cases with <1/2 myometrial invasion and 45 cases with ≥1/2 myometrial invasion.
Immunohistochemistry and Result
Criteria
Endometrial tissue paraffin-embedded samples were pro-cessed into 5-μm-thick slices after 10% formalin fixation. The slices were dewaxed by an ethanol gradient, blocked with endogenous
peroxidase, and then subjected to antigen heat repair treat-ment by heating in a microwave and naturally cooled to room temperature. The slices were incubated at 37°C in goat-block-ing serum and then incubated overnight at 4°C in rabbit anti-human PTGDS antibody (Proteintech, 10754-2-AP, 1:800, Chicago, IL, USA). Next, the slices were incubated at 37°C in horseradish-labeled goat anti-rabbit secondary antibody and stained by 3.3′-diaminobenzidine. The cell nucleus was stained blue by hematoxylin. Sections were then dehydrated, cleared by xylene, and mounted. Human normal lung tissue slices with positive expression of PTGDS were used as a positive control and phosphate-buffered saline was used instead of the antibody as a negative control. The streptavidin peroxidase-conjugated (SP) method was used in IHC staining. Immunohistochemistry kit were obtained from Proteintech Group (Wuhan, China). The experiments were performed in strict accordance with the SP kit instructions.
Five high powerfields (×400) were randomly selected under the microscope and eachfield was scored. If brown-yellow or brown-yellow particles were found in the cytoplasm and cell membrane, it was considered positive. According to cell staining, non-stained or unclearly stained, shallow-yellow, brown-shallow-yellow, and brown were scored as 0, 1, 2, and 3 points, respectively; According to the percentage of positive cells, <5% was scored as 0 point; 5–25% was scored as 1 point; 26–50% was scored as 2 points; 51–75% was scored as 3 points; and >75% was scored as 4 points. Thefinal score was the product of the cell staining inten-sity score and the positive cell rate score: 0–2 was negative (-), 3–4 was weakly positive (+), 5–8 was moderately positive (++), and 9–12 was strongly positive (+++). Negative and weakly positive were classified as low expression and moderately and strongly positive were classified as high expression. To control the error, two pathologists checked the sections independently, and when the results were inconsistent, the third pathologist resolved the issue.
LinkedOmics Database Analysis
The LinkedOmics database (http://www.linkedomics.org/ login.php) contains multi-omics and clinical data of 32
Cancer Management and Research downloaded from https://www.dovepress.com/ by 118.70.13.36 on 27-Aug-2020
cancer types and 11,158 patients from TCGA.16 PTGDS co-expression genes were analyzed statistically using Pearson’s correlation coefficient, and the results were pre-sented in volcano and heat map plots. The LinkedOmics function module analyzes GO categories and KEGG path-ways through gene set enrichment analysis (GSEA). The rank criterion was a false discovery rate (FDR) <0.05 and 500 simulations were performed.
TIMER Analysis
The TIMER database (https://cistrome.shinyapps.io/timer/) is an effective tool for inferring the abundance of tumor infiltrating immune cells (TIICs) from target gene expression profiles; it can comprehensively analyze the clinical impact of different immune cells in different types of cancer.17The database includes 10,897 samples from 32 cancer types in TCGA. Infiltration levels of six types of immune cells (B cells, CD8+T cells, CD4+T cells, macrophages, neutrophils, and dendritic cells) are pre-calculated. In the“Gene”module, the correlation between hub gene expression and immune infiltration abundance was analyzed by Spearman correla-tion. The“Survival”module can output TIICs and hub gene-related Kaplan–Meier plots, demonstrating the relationship between clinical outcomes and immune cell infiltration or hub gene expression.18
Statistical Analysis
SPSS software (version 22; SPSS Inc., Chicago, IL, USA) was used for statistical analysis. Chi-squared and Fisher’s exact tests were used to compare the count data. The Wilcox test was used to compare the expression of PTGDS between tumor and normal tissues. The Kaplan– Meier method was used for survival analysis and the Log rank test was used to test for significance. A Cox propor-tional regression model was used to analyze the impact of PTGDS expression and clinicopathologic parameters on the overall survival (OS) of EC patients. Follow-up was applied to all of the 87 EC cases. OS was defined as the time interval between the date of surgery and the date of death. For end points, the last date of follow-up (September 30, 2019) was used for censored subjects.
P<0.05 was considered statistically significant.
Results
Gene Screening
The gene expression profile dataset was downloaded from the NCBI GEO database and included 168 EC samples
and 23,516 genes. The top 25% variant genes (5879 genes) were selected to construct the co-expression network. Gene expression data and associated clinical information are provided inSupplementary Tables 1 and 2.
Construction of the Co-Expression
Network Using WGCNA
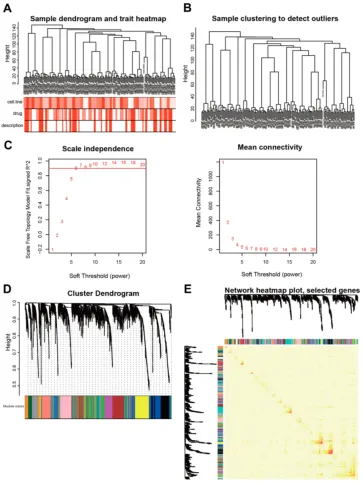
Hierarchical clustering was performed on the selected genes using the “FlashClust” package in R (Figure 2A). There were no outlier samples and all samples were used to construct the co-expression network (Figure 2B). We tried a soft thresholding value (β) from 1 to 20 to calculate scale independence and mean connectivity. With a soft thresholding value of β=6, the degree of independence was greater than 0.8 and the corresponding mean connec-tivity was close to zero, indicating the network met the requirements for a scale-free network distribution. Therefore, a soft thresholding β value of 6 was used to construct the co-expression network (Figure 2C). Gene modules close to each other were identified and combined using the dynamic tree cut method. A total of 27 gene modules were obtained finally (grey module included genes that were not co-expressed with other genes; Figure 2D). Correlation among the 27 modules were ana-lyzed and plotted in the heat map (Figure 2E).
Modules with Clinical Signi
fi
cance
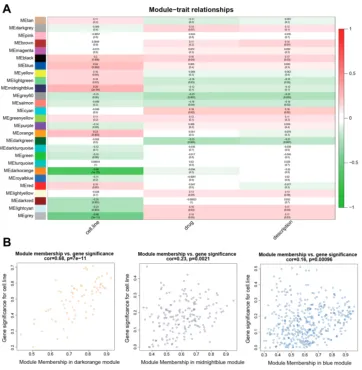
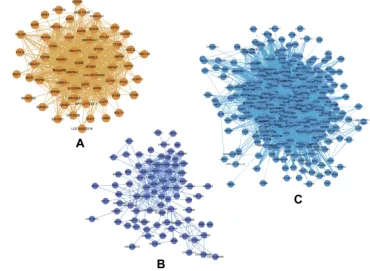
By relating the gene modules to clinical features, modules that were significantly correlated with certain clinical fea-tures were selected (Figure 3A). The dark orange and dark red modules show a significant negative correlation with cell line (P=1E-23 and P=0.001, respectively), and the midnight blue and blue modules were positively correlated with cell line (P=2E-04 and P=0.002, respectively). Correlation between GS and MM was further analyzed and the results showed that GS and MM of three modules (dark orange, midnight blue, and blue) were significantly correlated (cor=0.68, P=7e-11; cor=0.23, P=0.0021; and cor=0.16, P=0.00096, respectively), suggesting the three modules may be associated with EC (Figure 3B). Networks of the three modules are shown inFigure 4A–C.
Functional Enrichment Analysis of Genes
in Clinically Meaningful Modules
Through GO (biological process, cellular component, and molecular function) and KEGG pathway enrichment ana-lyses, the biological significance of the three modules was
Cancer Management and Research downloaded from https://www.dovepress.com/ by 118.70.13.36 on 27-Aug-2020
investigated (Supplementary Table 3). Our results showed that the dark orange module mainly involved GO:0006281 (DNA repair), and was significantly enriched in hsa03013 (RNA transport). The midnight blue module mainly involved GO:0008152 (metabolic process), and was significantly enriched in hsa00982 (drug metabolism) and hsa05204
(chemical carcinogenesis). The blue module mainly involved biological processes, including GO:0000122 (negative reg-ulation of transcription from RNA polymerase II promoter), GO:0043123 (positive regulation of I-κB kinase/NF-κB sig-naling), GO:0060548 (negative regulation of cell death), GO:0043065 (positive regulation of apoptotic process), and Figure 2Co-expression network constructed with WGCNA. (A) Hierarchical clustering of the top 25% variant genes in the GSE50830 dataset and associated clinical information. Color intensity was positively correlated with cell line, drug, and description. (B) Outlier samples were identified based on the above hierarchical clustering analysis. There were no outlier samples identified. (C) Determination of the optimal soft thresholding value (β) of the sample. (D) Dendrogram of the top 25% variant genes clustered based on dissimilarity measure (1-TOM). The upper panel shows the gene dendrogram, and the lower panel shows 27 gene modules displayed in different colors including the grey module. (E) Correlation heat map of the gene modules. Different colors on the horizontal and vertical axes represent different modules. Yellow indicates the degree of correlation between different modules, and the color intensity is proportional to the correlation degree.
Abbreviations:WGCNA, weighted gene coexpression network analysis; TOM, topological overlap matrix.
Cancer Management and Research downloaded from https://www.dovepress.com/ by 118.70.13.36 on 27-Aug-2020
was significantly enriched in hsa04060 (cytokine-cytokine receptor interaction) (Figure 5).
Screening Hub Genes in Pivotal Modules
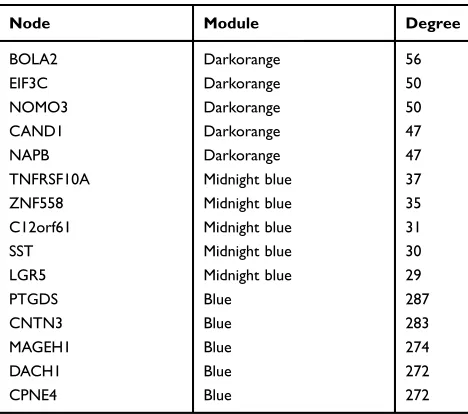
The degree of each node in the three modules was calcu-lated based on Cytoscape. The top five nodes with the highest degree were selected as candidate genes. A total of 15 genes including BolA family member 2 (BOLA2), eukaryotic initiation factor 3c (EIF3C), nodal modulator 3 (NOMO3), Cullin-associated and neddylation-dissociated 1 (CAND1), and sodium phenylbutyrate (NAPB) in the dark orange module, TNF receptor superfamily member 10a (TNFRSF10A), zinc finger 558 (ZNF558), C12orf61, somatostatin (SST), and leucine-rich repeat-containing G-protein coupled receptor 5 (LGR5) in the midnight blue module, and prostaglandin D2 synthase (PTGDS),
Contactin 3 (CNTN3), melanoma antigen-encoding gene H1 (MAGEH1), Dachshund homolog 1 (DACH1), and Copine 4 (CPNE4) in the blue module were selected as candidate genes (Table 1). The degree of each node is shown inSupplementary Table 4.
Expression and Clinical Signi
fi
cance of the
Hub Genes
Survival analysis of the 15 candidate genes was performed using the KM Plotter online tool. Four genes were signifi -cantly associated with EC prognosis including LGR5, SST, ZNF558, and PTGDS (P<0.05). High expression of LGR5 and SST was associated with poor prognosis (P=0.0099 and 9.3E-05, respectively), while low expression of ZNF558 and PTGDS was associated with poor prognosis (P=0.021 and 0.0057, respectively;Figure 6A). Differential Figure 3Identification of modules related to the clinical features of EC. (A) Heat map of the correlation between modules and clinical features. The number above each cell represents the correlation between the module and the feature, and the number below each cell represents the correspondingP-value. Red represents positive correlation and green represents negative correlation. (B) Scatter plot shows the correlation between GS and MM in three modules (dark orange, midnight blue, and blue). Abbreviations:EC, endometrial cancer; GS, gene significance; MM, module membership.
Cancer Management and Research downloaded from https://www.dovepress.com/ by 118.70.13.36 on 27-Aug-2020
expression levels of the four genes were validated using the GEPIA database, when compared with normal endometrial tissue, LGR5 and SST were significantly upregulated in EC tissue, and ZNF558 and PTGDS were significantly down-regulated in EC tissue (P<0.05, Figure 6B). Expression levels of the hub genes in various types of cancers were analyzed using the Oncomine database. LGR5 was upregu-lated in most cancers, while PTGDS and SST exhibited downregulation in most cancers. Studies regarding ZNF558 are limited, only three studies of brain and central nervous system cancer showed downregulation (Figure 6C– a). The expression information of the hub genes in the EC dataset was extracted from the Oncomine database. We found that in the TCGA cohort, compared with normal endometrial tissue, LGR5 was significantly upregulated in endometrial endometrioid adenocarcinoma and endometrial serous adenocarcinoma (P=6.69E-6 and 0.033, respec-tively), SST was significantly upregulated in endometrial endometrioid adenocarcinoma, endometrial serous adeno-carcinoma and endometrial mixed adenocarcinoma (P=8.40E-6, 7.10E-9, and 0.006, respectively). Expression levels of PTDGS and ZNF558 between normal endometrial tissue and different pathological types of EC did not exhibit any significant differences (Figure 6C–b).
Validation of PTGDS in Our Clinical
Samples
Expression of PTGDS in Endometrial Tissue in the Different Groups
LGR5 and SST have been studied in EC, while data related to ZNF558 is limited. As a member of the prostaglandin (PG) family, expression of PTGDS has been shown to be low in many cancers and has significant prognostic value. However, the role of PTGDS in EC is still unclear. We thereby chose PTGDS to validate our abovefindings.
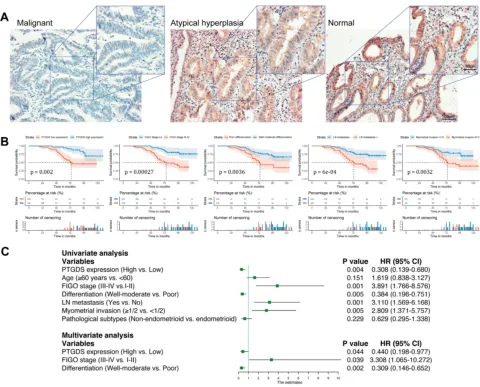
We performed IHC staining of 116 endometrial tissue samples including 87 EC, 17 endometrial atypical hyper-plasia, and 12 normal endometrial tissue samples. IHC staining demonstrated that PTGDS was mainly localized in the cytoplasm and cell membrane (Figure 7A). The rates of positive and highly positive expression of PTGDS in EC tissue (56.32% and 37.93%, respectively) were both significantly lower than those in endometrial atypical hyperplasia tissue (82.35% and 64.70%, P=0.045 and 0.041, respectively) as well as in normal endometrial tis-sue (91.67% and 75.00%, P=0.042 and 0.015, respec-tively). There was no significant difference between the endometrial atypical hyperplasia and the normal endome-trial groups (Table 2).
Figure 4(A–C) Gene co-expression networks of the dark orange, midnight blue, and blue modules visualized by Cytoscape. Nodes in the networks represent genes in the module, edges between the nodes indicate that the two genes were co-expressed.
Cancer Management and Research downloaded from https://www.dovepress.com/ by 118.70.13.36 on 27-Aug-2020
Relationship Between PTGDS Expression and Clinical Pathological Parameters of EC
Eighty-seven EC samples were divided into two groups: PTGDS high expression (++/+++) and PTGDS low expression (-/+). IHC staining found that the high positive rate of PTGDS in FIGO Stage III–IV patients was signifi -cantly lower than that in FIGO Stage I–II patients (28.57% vs 50.00%,P=0.041). The high positive rate of PTGDS in the poor differentiation group was significantly lower than that in the well-moderate differentiation group (24.32% vs 48.00%,P=0.024). The high positive rate of PTGDS in the lymph node metastasis positive group was also signifi -cantly lower than that in the lymph node metastasis nega-tive group (26.32% vs 46.94%, P=0.049). The expression level of PTGDS was not significantly correlated with age,
depth of myometrial invasion, and pathological subtype of EC (P>0.05,Table 3).
Relationship Between PTGDS Expression and Prognosis in Patients with EC
During the follow-up period, among 87 EC patients, 36 died (41.38%) and 13 were lost to follow-up (14.94%). The 5-year overall survival rate was 75.9% and mean survival time was 98.4 months (95% confidence interval [CI]: 90.5–106.2 months). Kaplan–Meier survival analysis revealed that the mean OS in the PTGDS low expression group, FIGO Stage III–IV group, poor differentiation group, lymph node metas-tasis group, and≥1/2 myometrial invasion group was sig-nificantly lower than that in the PTGDS high expression group, FIGO Stage I–II group, well-moderate differentiation Figure 5Bar plots of GO and KEGG enrichment analyses of the three modules (dark orange, midnight blue, and blue). The x-axis represents enriched terms, the left y-axis represents the -log10P-value, and the right y-axis represents the number of enriched genes (gray line).
Abbreviations:GO, gene ontology; KEGG, Kyoto Encyclopedia of Genes and Genomes.
Cancer Management and Research downloaded from https://www.dovepress.com/ by 118.70.13.36 on 27-Aug-2020
group, no lymph node metastasis group, and < 1/2 myome-trial invasion group, respectively (P=0.002, 0.00027, 0.0036, 6E-04 and 0.0032, respectively). The survival curve shown inFigure 7Bwas generated by the“survminer”R package. There was no significant correlation between age or patholo-gical type and OS (P>0.05,Table 4)
A Cox regression model was used to predict prognostic risk factors. Univariate analysis showed PTGDS expression, FIGO Stage, histological differentiation, lymph node metas-tasis, and myometrial invasion were significantly correlated with OS (hazard ratio (HR): 0.308, 3.891, 0.384, 3.110 and 2.809, respectively, all P<0.05). Multivariate analysis showed that the low expression of PTGDS, advanced stage, and poor differentiation were independent risk factors for OS of patients with EC (HR: 0.440, 3.308 and 0.309, respec-tively, allP<0.05;Figure 7C).
Validation of PTGDS in TCGA Cohort
Gene expression data and associated clinical information from TCGA-UCEC cohort are provided inSupplementary Table 5. As shown inFigure 8A, PTGDS expression was significantly lower in EC than in normal tissues. The results were consistent in 23 matched samples of tumor and normal tissues (Figure 8B). Thefirst 30% of expres-sion value was considered as the PTGDS high expresexpres-sion group, and the latter 70% was considered as the PTGDS low expression group. Kaplan–Meier survival analysis revealed that the mean OS in the PTGDS low expression group was significantly lower than that in the PTGDS high
expression group (121.7±9.3 vs 186.2±9.6, P=0.013; Figure 8C). Multivariate Cox analysis suggested that the low expression of PTGDS, advanced stage, and deeper myometrial invasion were independent risk factors affect-ing the prognosis of patients with EC (HR: 0.555, 3.969, and 1.854, respectively, allP<0.05;Figure 8D).
Possible Molecular Mechanism of PTGDS
in EC
To investigate the potential biological role and molecular mechanism of PTGDS in EC, we used LinkedOmics to analyze the co-expressed genes of PTGDS in UCEC. A total of 10,269 genes (dark red dots) were significantly positively correlated with PTGDS, and 9629 genes (dark green dots) were significantly negatively correlated with PTGDS (Figure 9A). The top 50 significant genes posi-tively and negaposi-tively correlated with PTGDS are shown in the heat map (Figure 9B). Related information of the co-expressed genes is shown Supplementary Table 6. Significant GO annotations of GSEA indicated that co-expressed genes of PTGDS were mainly involved in immune-related biological processes such as the adaptive immune response, regulation of leukocyte activation, leu-kocyte migration, and regulation of the inflammatory response, while cell cycle activities such as phase transi-tion, organellefission, mRNA processing, and nucleobase-containing compound transport were inhibited. KEGG pathway analysis showed that the positively correlated co-expressed genes of PTGDS were mainly enriched in cell adhesion molecules (CAMs), ribosome, cytokine-cytokine receptor interaction, and chemokine signaling pathway, suggesting expression of PTGDS may have effects on the immune system (Figure 9C).
Correlation Analysis of PTGDS
Expression and Immune In
fi
ltration Status
of UCEC
To investigate the potential correlation between PTGDS and the immune microenvironment of UCEC, we used the TIMER database to evaluate the relationship between PTGDS expression and the level of immune infiltration in TCGA-UCEC cohort. The expression of PTGDS was positively correlated with the infiltration levels of B cells, CD4+ T cells, and macrophages in UCEC patients (r=0.227, P=9.59E-5; r=0.323, P=1.72E-8; and r=0.279,
P=1.24E-6, respectively) (Figure 10A). The copy number variation of PTGDS was significantly correlated with the
Table 1 Screening of Hub Genes by cytoHubba (Degrees Ranking)
Node Module Degree
BOLA2 Darkorange 56
EIF3C Darkorange 50
NOMO3 Darkorange 50
CAND1 Darkorange 47
NAPB Darkorange 47
TNFRSF10A Midnight blue 37
ZNF558 Midnight blue 35
C12orf61 Midnight blue 31
SST Midnight blue 30
LGR5 Midnight blue 29
PTGDS Blue 287
CNTN3 Blue 283
MAGEH1 Blue 274
DACH1 Blue 272
CPNE4 Blue 272
Cancer Management and Research downloaded from https://www.dovepress.com/ by 118.70.13.36 on 27-Aug-2020
Figure 6Survival analysis and differential expression of hub genes. (A) Survival analysis of the hub genes in EC (Kaplan–Meier plot). (B) Differential expression of hub genes analyzed using the GEPIA database. Box plots show mRNA expression of hub genes in EC (red plot) and the corresponding normal tissues (gray plot). *P<0.05. (C) Differential expression of hub genes analyzed using the Oncomine database. (C-a): Differential expression of hub genes in different tumors. The intensity of color (red or blue) is positively correlated with the degree of significance of upregulation or downregulation, respectively. (C-b): Differential expression of hub genes in different pathological types of EC.
Abbreviation:EC, endometrial carcinoma.
Cancer Management and Research downloaded from https://www.dovepress.com/ by 118.70.13.36 on 27-Aug-2020
infiltration levels of B cells, CD8+ T cells, macrophages, and dendritic cells (Figure 10B). In addition, using the survival module to draw the survival curve of immune cell infiltration level and patient prognosis, we found that in UCEC patients, low B cell and CD8+T cell infiltration was significantly correlated with poor prognosis (P=0.019 and P=0.022, respectively) (Figure 10C). These results
indicated that PTGDS may participate in immune activity in the UCEC microenvironment through various immune cells.
Discussion
In this study, we analyzed the GSE50830 gene expression profile dataset in the GEO database, including 168 Figure 7Expression of PTGDS in different endometrial tissues and survival analysis based on our clinical samples. (A) Expression of PTGDS in EC tissue, atypical hyperplasia tissue, and normal endometrial tissue (IHC staining). Scale bars: upper, 50μm; lower, 100μm. (B) Correlation of PTGDS expression, FIGO Stage, differentiation, lymph node metastasis, and myometrial invasion with OS. (C) Forest plot based on univariate and multivariate Cox regression analysis of OS.
Abbreviations:EC, endometrial cancer; PTGDS, prostaglandin D2 synthase; IHC, immunohistochemical; FIGO, International Federation of Gynecology and Obstetrics; OS, overall survival.
Table 2PTGDS Expression in 116 Cases of Endometrial Tissues
Groups n − + ++ +++ Positive Expression [n (%)] High Expression [n (%)]
Malignant 87 38 16 22 11 49 (56.32) 33 (37.93)
Atypical hyperplasia 17 3 3 7 4 14 (82.35) 11 (64.70)
Normal 12 1 2 4 5 11 (91.67) 9 (75.00)
Cancer Management and Research downloaded from https://www.dovepress.com/ by 118.70.13.36 on 27-Aug-2020
endometrial cancer tissue samples, and screened potential biomarkers related to the progress and prognosis of EC. By constructing a co-expression network of 5879 most variable genes by WGCNA, a total of 27 independent modules were identified. Then, we used the DAVID database to conduct enrichment analysis on three selected modules, and found that genes in the dark orange module were mainly involved in DNA repair and enriched in the RNA transport pathway, whereas genes in the midnight blue module were involved in metabolic processes, and enriched in drug metabolism and chemical carcinogenesis. In the blue module, the genes were involved in biological processes such as negative regulation of transcription from RNA polymerase II promoter, negative regulation of cell death, and positive regulation of apoptosis, and also enriched in the cytokine-cytokine receptor interaction pathway. Cell cycle-related biological functions are involved in the development of many tumors, including EC, while chemical resistance is the main cause of cancer recurrence and death. Thus, these modules may affect the progression and prognosis of EC by regulating the above biological processes and pathways.
We used thecytoHubbaplug-in in Cytoscape to screen the top five genes with the highest degree in the dark orange, midnight blue, and blue modules. We further
performed survival analysis and differential expression analysis against the 15 genes and found the expression of LGR5 and SST were negatively correlated with patient prognosis, while the expression of ZNF558 and PTGDS were positively correlated with patient prognosis; the mRNA levels of LGR5 and SST were significantly upre-gulated in EC, whereas those of ZNF558 and PTGDS were significantly downregulated. Finally, four hub genes (LGR5, SST, ZNF558, and PTGDS) were selected, which may be core genes affecting EC development.
LGR5 also known as GPR49 or GPR67, is a member of the G protein coupled receptor (GPCR) family. GPCRs are transmembrane proteins essential for cell signal transduction.19 Recent studies have reported that LGR5, as a potential human cancer stem cell marker, is a receptor of the R-spondin ligand family. Activation of LGR5 mediated by R-spondin can promote the transduction of Wnt/β-catenin signaling, which helps stem cell tion and self-renewal, and promotes cancer cell prolifera-tion, invasion, drug resistance, and metastasis.20,21 LGR5 is overexpressed in a variety of tumors, and its high expression level is associated with poor prognosis of var-ious cancers, including colorectal, gastric, hepatocellular, and ovarian cancer.22–25 Studies have shown that the
Table 3Relationship Between PTGDS Expression and Clinical Pathological Parameters in 87 Cases of Malignant Endometrial Cancer
Parameters n − + ++ +++ High Expression [n (%)] P
Age (years) 0.950
<60 55 23 11 14 7 21 (38.18)
≥60 32 15 5 8 4 12 (37.50)
FIGO stage 0.041*
I–II 38 14 5 14 5 19 (50.00)
III–IV 49 24 11 8 6 14 (28.57)
Differentiation 0.024*
Poor 37 25 3 4 5 9 (24.32)
Well-moderate 50 13 13 18 6 24 (48.00)
Myometrial invasion 0.360
<1/2 42 16 8 15 3 18 (42.86)
≥1/2 45 22 8 7 8 15 (33.33)
LN metastasis 0.049*
No 49 20 6 16 7 23 (46.94)
Yes 38 18 10 6 4 10 (26.32)
Pathological subtype 0.055
non-endometrioid 17 11 3 1 2 3 (17.65)
endometrioid 70 12 28 19 11 31 (42.86)
Note:*P<0.05.
Abbreviations:FIGO, International Federation of Gynecology and Obstetrics; LN, lymph node.
Cancer Management and Research downloaded from https://www.dovepress.com/ by 118.70.13.36 on 27-Aug-2020
increased expression of LGR5 occurs in the initial stage of EC development. With proliferation and growth of tumor epithelial cells, the expression of LGR5 becomes undetect-able, likely because of the inhibitory effect of estrogen and progesterone on LGR5, suggesting LGR5 may be a bio-marker for the diagnosis of early EC.26
SST is an inhibitor of cell proliferation and hormone secretion, and has endocrine, paracrine, and autocrine activities. It exhibits biological effects via five subtypes of somatostatin receptors, which are also G protein-coupled receptors (GPCRs). SST-2 and SST-5 are the most studied subtypes in human cancers so far; they have become the main therapeutic targets for pituitary adenomas and neuroendocrine tumors.27 The antitumor properties of SST and its analogs have been demonstrated in a variety of cancers. The stable somatostatin analog RC-160 can inhibit the growth of human EC cells in vivo and in vitro, indicating that functional somatostatin receptors are expressed in EC cells.28Other studies have shown that somatostatin binding sites have been detected in the
peritumoral veins of EC.29 Schulz et al found that in 28 EC tissue samples, SST1, SST2A, and SST3 were highly expressed, while the expression of somatostatin receptors was not detected in adjacent normal endometrium.30This indicates that somatostatin may be involved in EC pro-gression and may be a potential target for treatment.
ZNF558 is a DNA-binding protein of the ZNF family, which plays a role in transcription regulation.31 To date, there have been few studies on ZNF558. One study showed that ZNF558 is downregulated in the cell popula-tion of Leber congenital amaurosis (LCA), suggesting that this gene may be related to the underlying molecular mechanism of LCA.32 However, the role of ZNF558 in cancers including EC will require further investigation.
Prostaglandins (PGs) are a family of bioactive endo-genous metabolites derived from arachidonic acid through the cyclooxygenase (COX) pathway, and include five major bioactive prostaglandins: PGE2, PGI2, PGD2, PGF2, and thromboxane A2 (TXA2). PGD2, also known as PTGDS, has important vascular functions. A Lack of
Table 4Kaplan-Meier Survival Analysis of Clinicopathological Features and PTGDS Expression in 87 Cases of Malignant Endometrial Cancer
Characteristics [n(%)] OS (xs, months) 95% CI χ2(P)
Age (years)
<60 55 (63.2) 97.8 ± 4.0 89.8–105.7 2.113 (0.146)
≥60 32 (36.8) 90.2 ± 7.1 76.3–104.1
FIGO stage
I–II 38 (43.7) 115.0 ± 4.4 106.4–123.7 13.234 (0.00027*)
III–IV 49 (56.3) 79.7 ± 4.5 70.9–88.6
Differentiation
Poor 37 (74.0) 82.9 ± 6.2 70.8–95.0 8.462 (0.0036*)
Well-moderate 50 (26.0) 108.2 ± 4.6 99.2–117.2
Myometrial invasion
<1/2 42 (48.3) 103.7 ± 4.4 95.1–112.3 8.701 (0.0032*)
≥1/2 45 (51.7) 87.4 ± 5.7 76.2–98.5
LN metastasis
No 49 (56.3) 110.0 ± 4.6 101.1–119.0 11.769 (6E-04*)
Yes 38 (43.7) 78.1 ± 5.0 68.3–88.0
Pathological subtype
non-endometrioid 17 (19.5) 88.6 ± 9.6 69.8–107.4 1.485 (0.223)
endometrioid 70 (80.5) 98.6 ± 4.1 90.6–106.6
PTGDS expression
Low 54 (62.1) 83.8 ± 4.6 74.6–92.9 9.515 (0.002*)
High 33 (37.9) 114.5 ± 4.5 105.6–123.4
Note:*P<0.05.
Abbreviation:OS, overall survival; CI, confidence interval; FIGO, International Federation of Gynecology and Obstetrics; LN, lymph node.
Cancer Management and Research downloaded from https://www.dovepress.com/ by 118.70.13.36 on 27-Aug-2020
PTGDS leads to changes in the function of tumor endothe-lial cells, such as accelerated vascular hyperpermeability, angiogenesis, and the endothelial-to-mesenchymal transi-tion (EMT), thereby reducing tumor cell apoptosis.33,34 The tumor suppressive function of PTGDS has been con-firmed in testicular cancer and intestinal tumors. For example, in testicular cancer mediated by H-rev107, PTGDS inhibited the migration and invasion of cancer cells through PTGDS-cAMP-SOX9 signaling.35In intest-inal tumors, PTGDS exerted anti-cancer effects by coop-erating with the prostaglandin D2 receptor (PTGDR).36 Recent experiments showed that PTGDS is usually down-regulated in lung,34ovarian,37and gastric cancer,38and its low expression is associated with poor prognosis, includ-ing in breast cancers.39 In 2019, it was found that higher expression levels of PTGDS were correlated with longer disease-free survival and higher sensitivity to platinum drugs in patients with high grade serous ovarian cancer; thus, positive expression of PTGDS is an indicator of good prognosis in these patients.40In the same year, a bioinfor-matics study found that the expression level of PTGDS in
diffuse large B cell lymphoma (DLBCL) was significantly lower than that of normal tissues and low PTGDS expres-sion was significantly correlated with poor OS of patients with DLBCL.41
Previous studies have shown that LGR5 and SST have clinical significance in the development of EC, while data regarding ZNF558 is limited. No study has investigated the role of PTGDS in EC thus far. Therefore, we chose PTGDS as a key hub gene for in-depth validation and analyzed the expression of PTGDS in EC as well as its association with pathological characteristics and prognosis.
IHC staining showed that both the positive and high expression rate of PTGDS in the EC group was signifi -cantly lower than that of the endometrial atypical hyper-plasia and normal endometria groups. Decreased expression of PTGDS was associated with advanced FIGO Stage, poor differentiation, and lymphatic metastasis (all P<0.05). The Cox multivariate regression model demonstrated that low PTGDS expression, advanced FIGO Stage, and poor differentiation were independent Figure 8Differential expression of PTGDS between EC and normal endometrial tissues and survival analysis based on TCGA-UCEC cohort. (A) Expression level of PTGDS in normal and tumor samples. (B) Expression level of PTGDS in paired samples. (C) Correlation between PTGDS expression and OS in EC patients. (D) Forest plot based on univariate and multivariate Cox regression analysis of OS.
Abbreviations:PTGDS, prostaglandin D2 synthase; UCEC, uterine corpus endometrial carcinoma; OS, overall survival.
Cancer Management and Research downloaded from https://www.dovepress.com/ by 118.70.13.36 on 27-Aug-2020
risk factors affecting the prognosis of EC. The analysis based on TCGA-UCEC cohort further confirmed our pre-vious conclusions that PTGDS expression was signifi -cantly downregulated in EC, and its low expression could predict poor prognosis in EC patients. Therefore, downregulation or deletion of PTGDS may be involved in EC malignancy, and PTGDS may be a useful biomarker for early diagnosis or evaluation of the prognosis of EC patients.
To explore the biological functions and related mechanisms of PTGDS in EC, we performed GO and KEGG pathway enrichment analyses. We found that the genes positively co-expressed with PTGDS were enriched in immune-related biological processes such as the
adaptive immune response, regulation of leukocyte activa-tion, leukocyte migraactiva-tion, and regulation of the infl amma-tory response, as well as immune-related pathways including CAMs, cytokine-cytokine receptor interaction, and chemokine signaling. The results demonstrated that PTGDS may modulate the proliferation and apoptosis of cancer cells by participating in the inflammatory immune response in EC.
It has been shown recently that infiltration of immune cells in tumors is closely related to the clinical outcome of patients. Immune cell infiltration refers to the migration of immune cells from the blood to tumor tissue, which plays a role in the immune escape mechanism of cancer. Immune cell infiltration is also a target of anti-cancer Figure 9PTGDS co-expressed genes in UCEC (LinkedOmics). (A) PTGDS highly correlated genes identified by Pearson’s test in UCEC. (B) Heat map shows the top 50 genes positively and negatively correlated with PTGDS in UCEC. Red and green indicate positively and negatively correlated genes, respectively. (C) GO and KEGG pathway enrichment analyses of PTGDS co-expressed genes in UCEC.
Abbreviations:UCEC, uterine corpus endometrial carcinoma; PTGDS, prostaglandin D2 synthase; GO, gene ontology; KEGG, Kyoto Encyclopedia of Genes and Genomes.
Cancer Management and Research downloaded from https://www.dovepress.com/ by 118.70.13.36 on 27-Aug-2020
treatments.42 TIMER analysis showed the infiltration levels of B cells, CD4+ T cells, and macrophages were positively correlated with PTGDS in UCEC patients. PTGDS copy number variation can also affect the infi ltra-tion levels of B cells, CD8+ T cells, macrophages, and dendritic cells, while low infiltration levels of B cells and CD8+T cells predict a worse prognosis in UCEC. Deficiency or dysfunction of tumor immune cell infi ltra-tion can lead to immune escape and promote tumor pro-gression. Novel therapies targeting tumor immune escape, particularly inhibitory receptors involved in the regulation of T cell activity, have been investigated.43 To identify reliable EC immunotherapy targets, the relationship between PTGDS and immune infiltrating cells and the effect of PTGDS on the EC immune system will require further experimental verification.
Conclusion
Through construction of the co-expression network by WGCNA and bioinformatics analysis, we screened four
EC hub genes: LGR5, SST, ZNF558, and PTGDS. These genes may participate in EC and impact EC prognosis. Moreover, we speculate that PTGDS may act as a tumor suppressor gene in the development of EC through immune-related biological processes and pathways. The clinical value and molecular mechanisms will require further exploration in future studies.
Ethical Approval and Informed
Consent
Ethical approval for this study was obtained from the Clinical Research Ethics Committee of Shengjing Hospital of China Medical University, and all patients provided signed informed consent in accordance with the Declaration of Helsinki.
Funding
This work was supported by grants from the National Natural Science Foundation of China Youth Science Foundation (No. 81602438), Doctoral Start-up Fund of Figure 10Association between PTGDS expression and immune signature (TIMER). (A) Relationship between PTGDS expression and infiltration levels of six subsets of immune cells (B cells, CD4+
T cells, CD8+
T cells, macrophages, neutrophils, and dendritic cells) in UCEC. (B) Kaplan–Meier curves of the six subsets of immune cell infiltration levels in UCEC. (C) PTGDS copy number variation affects the infiltration levels of B cells, CD8+
T cells, macrophages, and dendritic cells in UCEC. *P<0.05, **P<0.01, and ***P<0.001.
Abbreviations:UCEC, uterine corpus endometrial carcinoma; PTGDS, prostaglandin D2 synthase.
Cancer Management and Research downloaded from https://www.dovepress.com/ by 118.70.13.36 on 27-Aug-2020
Liaoning Province (Grant No. 201601133), and 345 Talent Project of Shengjing Hospital.
Disclosure
The authors declare that they have no competing interests.
References
1. Montagnana M, Benati M, Danese E, et al. Aberrant MicroRNA expression in patients with endometrial cancer. Int J Gynecol Cancer.2017;27(3):459–466. doi:10.1097/igc.0000000000000913 2. Chen HX, Xu XX, Tan BZ, et al. MicroRNA-29b inhibits
angiogen-esis by targeting VEGFA through the MAPK/ERK and PI3K/Akt signaling pathways in endometrial carcinoma. Cell Physiol Biochem.2017;41(3):933–946. doi:10.1159/000460510
3. Siegel RL, Miller KD, Jemal A. Cancer statistics, 2018.CA Cancer J Clin.2019;68(1):7–30. doi:10.3322/caac.21442
4. Weinstein JN, Collisson EA, Mills GB, et al. The cancer genome atlas pan-cancer analysis project.Nat Genet.2013;45(10):1113–1120. doi:10.1038/ng.2764
5. Clough E, Barrett T. The gene expression omnibus database.Methods Mol Biol.2016;1418:93–110. doi:10.1007/978-1-4939-3578-9_5 6. Lee MY, da Silva B, Ramirez DC, et al. Novel HMGA2-YAP1 fusion
gene in aggressive angiomyxoma. BMJ Case Rep. 2019;12(5): e227475. doi:10.1136/bcr-2018-227475
7. Huo X, Sun H, Liu Q, et al. Clinical and expression significance of AKT1 by co-expression network analysis in endometrial cancer. Front Oncol.2019;9:1147. doi:10.3389/fonc.2019.01147
8. Langfelder P, Horvath S. WGCNA: an R package for weighted correlation network analysis. BMC Bioinformatics. 2008;9(1):559. doi:10.1186/1471-2105-9-559
9. DezsőZ, Oestreicher J, Weaver A, et al. Gene expression profiling reveals epithelial mesenchymal transition (EMT) genes can selec-tively differentiate eribulin sensitive breast cancer cells.PLoS One.
2014;9(8):e106131. doi:10.1371/journal.pone.0106131
10. Botía JA, Vandrovcova J, Forabosco P, et al. An additional k-means clustering step improves the biological features of WGCNA gene co-expression networks. BMC Syst Biol. 2017;11(1):47. doi:10.1186/ s12918-017-0420-6
11. Huang da W, Sherman BT, Lempicki RA. Systematic and integrative analysis of large gene lists using DAVID bioinformatics resources. Nat Protoc.2009;4(1):44–57. doi:10.1038/nprot.2008.211
12. Chin CH, Chen SH, Wu HH, et al. cytoHubba: identifying hub objects and sub-networks from complex interactome. BMC Syst Biol.2014;8(Suppl 4):S11. doi:10.1186/1752-0509-8-s4-s11 13. Gyorffy B, Lánczky A, Szállási Z. Implementing an online tool for
genome-wide validation of survival-associated biomarkers in ovar-ian-cancer using microarray data from 1287 patients. Endocr Relat Cancer.2012;19(2):197–208. doi:10.1530/erc-11-0329
14. Tang Z, Li C, Kang B, et al. GEPIA: a web server for cancer and normal gene expression profiling and interactive analyses.Nucleic Acids Res.2017;45(W1):W98–W102. doi:10.1093/nar/gkx247 15. Rhodes DR, Kalyana-Sundaram S, Mahavisno V, et al. Oncomine
3.0: genes, pathways, and networks in a collection of 18,000 cancer gene expression profiles. Neoplasia. 2007;9(2):166–180. doi:10.1593/neo.07112
16. Vasaikar SV, Straub P, Wang J, et al. LinkedOmics: analyzing multi-omics data within and across 32 cancer types. Nucleic Acids Res.
2018;46(D1):D956–D963. doi:10.1093/nar/gkx1090
17. Li B, Severson E, Pignon JC, et al. Comprehensive analyses of tumor immunity: implications for cancer immunotherapy. Genome Biol.
2016;17(1):174. doi:10.1186/s13059-016-1028-7
18. Li T, Fan J, Wang B, et al. TIMER: a web server for comprehensive analysis of tumor-infiltrating immune cells.Cancer Res.2017;77(21): e108–e110. doi:10.1158/0008-5472.Can-17-0307
19. Birchmeier W. Stem cells: orphan receptorsfind a home. Nature.
2011;476(7360):287–288. doi:10.1038/476287a
20. Scannell CA, Pedersen EA, Mosher JT, et al. LGR5 is expressed by ewing sarcoma and potentiates Wnt/β-catenin signaling.Front Oncol.
2013;3:81. doi:10.3389/fonc.2013.00081
21. Hoffmeyer K, Raggioli A, Rudloff S, et al. Wnt/β-catenin signaling regulates telomerase in stem cells and cancer cells.Science.2012;336 (6088):1549–1554. doi:10.1126/science.1218370
22. Salehizadeh S, Hasanzad M, Kadijani AA, et al. The expression analysis of intestinal cancer stem cell marker Lgr5 in colorectal cancer patients and the correlation with histopathological markers. J Gastrointest Cancer.2020;51(2):591–599. doi:10.1007/s12029-019-00295-w 23. Liu XS, Lin XK, Mei Y, et al. Regulatory T cells promote
over-expression of Lgr5 on gastric cancer cells via TGF-beta1 and confer poor prognosis in gastric cancer. Front Immunol. 2019;10:1741. doi:10.3389/fimmu.2019.01741
24. Ko CJ, Li CJ, Wu MY, et al. Overexpression of LGR-5 as a predictor of poor outcome in patients with hepatocellular carcinoma.Int J Environ Res Public Health.2019;16(10):10. doi:10.3390/ijerph16101836 25. Sun Y, Jia X, Wu X. High expressions of Lgr5 and ALDH1 in
primary epithelial ovarian cancer correlate with advanced tumor stage and grade as well as poor prognosis of the patients.Gynecol Obstet Invest.2015;81(2):162–168. doi:10.1159/000431222 26. Sun X, Jackson L, Dey SK, et al. In pursuit of leucine-rich
repeat-containing G protein-coupled receptor-5 regulation and function in the uterus. Endocrinology. 2009;150(11):5065–5073. doi:10.1210/ en.2009-0690
27. Günther T, Tulipano G, Dournaud P, et al. International union of basic and clinical pharmacology. CV. somatostatin receptors: struc-ture, function, ligands, and new nomenclature. Pharmacol Rev.
2018;70(4):763–835. doi:10.1124/pr.117.015388
28. Mishima M, Yano T, Jimbo H, et al. Inhibition of human endometrial cancer cell growth in vitro and in vivo by somatostatin analog RC-160.Am J Obstet Gynecol.1999;181(3):583–590. doi:10.1016/s0002-9378(99)70496-5
29. Denzler B, Reubi JC. Expression of somatostatin receptors in peritu-moral veins of human tumors. Cancer. 1999;85(1):188–198.
doi:10.1002/(SICI)1097-0142(19990101)85:1<188::AID-CNCR26>3.0.CO;2-3
30. Schulz S, Schmitt J, Weise W. Frequent expression of immunoreac-tive somatostatin receptors in cervical and endometrial cancer. Gynecol Oncol. 2003;89(3):385–390. doi:10.1016/s0090-8258(03) 00078-7
31. Matthews JM, Sunde M. Zinc fingers–folds for many occasions. IUBMB Life.2002;54(6):351–355. doi:10.1080/15216540216035 32. Lustremant C, Habeler W, Plancheron A, et al. Human induced
pluripotent stem cells as a tool to model a form of Leber congenital amaurosis. Cell Reprogram. 2013;15(3):233–246. doi:10.1089/ cell.2012.0076
33. Hirawa N, Uehara Y, Yamakado M, et al. Lipocalin-type prostaglan-din d synthase in essential hypertension. Hypertension. 2002;39 (2):449–454. doi:10.1161/hy0202.102835
34. Ragolia L, Palaia T, Hall CE, et al. Diminished lipocalin-type pros-taglandin D(2) synthase expression in human lung tumors. Lung Cancer.2010;70(1):103–109. doi:10.1016/j.lungcan.2010.01.011 35. Shyu RY, Wu CC, Wang CH, et al. H-rev107 regulates prostaglandin
D2 synthase-mediated suppression of cellular invasion in testicular cancer cells.J Biomed Sci. 2013;20(1):30. doi:10.1186/1423-0127-20-30
36. Tippin BL, Kwong AM, Inadomi MJ, et al. Intestinal tumor suppres-sion in ApcMin/+ mice by prostaglandin D2 receptor PTGDR. Cancer Med.2014;3(4):1041–1051. doi:10.1002/cam4.251
Cancer Management and Research downloaded from https://www.dovepress.com/ by 118.70.13.36 on 27-Aug-2020
37. Lim W, Bae SM, Jo G, et al. Prostaglandin D2 synthase related to estrogen in the female reproductive tract. Biochem Biophys Res Commun.2015;456(1):355–360. doi:10.1016/j.bbrc.2014.11.086 38. Zhang B, Bie Q, Wu P, et al. PGD2/PTGDR2 signaling restricts the
self-renewal and tumorigenesis of gastric cancer.Stem Cells.2018;36 (7):990–1003. doi:10.1002/stem.2821
39. Kim GE, Kim NI, Lee JS, et al. Differentially expressed genes in matched normal, cancer, and lymph node metastases predict clinical outcomes in patients with breast cancer.Appl Immunohistochem Mol Morphol.2018. doi:10.1097/pai.0000000000000717
40. Alves MR, Do Amaral NS, Marchi FA, et al. Prostaglandin D2 expression is prognostic in high-grade serous ovarian cancer.Oncol Rep.2019;41(4):2254–2264. doi:10.3892/or.2019.6984
41. Sun C, Cheng X, Wang C, et al. Gene expression profiles analysis identifies a novel two-gene signature to predict overall survival in diffuse large B-cell lymphoma.Biosci Rep.2019;39(1). doi:10.1042/ bsr20181293
42. Xia W, Mao W, Chen R, et al. Epidermal growth factor receptor mutations in resectable non-small cell lung cancer patients and their potential role in the immune landscape. Med Sci Monit.
2019;25:8764–8776. doi:10.12659/msm.920042
43. Antomarchi J, Ambrosetti D, Cohen C, et al. Immunosuppressive tumor microenvironment status and histological grading of endome-trial carcinoma. Cancer Microenviron. 2019;12(2–3):169–179. doi:10.1007/s12307-019-00225-1
Cancer Management and Research
Dove
press
Publish your work in this journal
Cancer Management and Research is an international, peer-reviewed open access journal focusing on cancer research and the optimal use of preventative and integrated treatment interventions to achieve improved outcomes, enhanced survival and quality of life for the cancer patient.
The manuscript management system is completely online and includes a very quick and fair peer-review system, which is all easy to use. Visit http://www.dovepress.com/testimonials.php to read real quotes from published authors.
Submit your manuscript here:https://www.dovepress.com/cancer-management-and-research-journal
Cancer Management and Research downloaded from https://www.dovepress.com/ by 118.70.13.36 on 27-Aug-2020