University of Pennsylvania
ScholarlyCommons
Publicly Accessible Penn Dissertations
Winter 12-22-2009
Evolution of Genome-wide Gene Regulation in the
Budding Yeast Cell-Division Cycle
Daniel F. Simola
University of Pennsylvania, simola@mail.med.upenn.edu
Follow this and additional works at:http://repository.upenn.edu/edissertations
Part of theComputational Biology Commons,Evolution Commons,Genomics Commons, and
theSystems Biology Commons
This paper is posted at ScholarlyCommons.http://repository.upenn.edu/edissertations/67
For more information, please contactlibraryrepository@pobox.upenn.edu.
Recommended Citation
Simola, Daniel F., "Evolution of Genome-wide Gene Regulation in the Budding Yeast Cell-Division Cycle" (2009).Publicly Accessible
Penn Dissertations. 67.
Evolution of Genome-wide Gene Regulation in the Budding Yeast
Cell-Division Cycle
Abstract
Genome-wide regulation of gene expression involves a dynamic epigenetic structure which generates an organism's life-cycle. Although changes in gene expression during development have broad effects on many basic phenomena including cell growth, differentiation, morphogenesis, and disease progression, the evolutionary forces influencing gene expression dynamics and gene regulation remain largely unknown, due to the nature of gene expression as a polygenic, quantitative trait. Moreover, gene expression is regulated differentially over time, so evolutionary forces may be influenced by developmental context. To advance the understanding of evolution in the context of the life-cycle, the architecture of gene expression timing control and its influence on expression dynamics must be revealed. This dissertation presents two experimental investigations of the evolution of genes and related structural regions and time-dependent gene expression, using the budding yeasts Saccharomyces cerevisiae and Saccharomyces paradoxus and their mitotic cell-division cycle as model organism and life-cycle. Comparative methodologies were employed to analyze genome-wide patterns of genetic and phenotypic diversity within and between species. Analysis of several dozen yeast genomes reveals a dominant evolutionary mode of purifying selection. Despite limited genetic variability, differences in transcriptional regulation appear to contribute predominantly to interspecies divergence, and altered post-transcriptional regulation of ribosomal genes may have altered the timing of each species' transition from vegetative growth to reproduction, a classic life-history trait. In addition, natural variation in genome-wide gene expression was measured as a time-series through the mitotic cell-division cycle of 10 yeast lines, including one outgroup species. Despite levels of variation consistent with strong stabilizing selection, transcriptome coexpression dynamics have diverged significantly within and between species. A model involving timing pattern changes explains 61% of the between-genome variation in expression dynamics, suggesting that the major mode of transcriptome evolution involves changes in timing (heterochrony) rather than changes in levels (heterometry) of expression. Analysis of heterochrony patterns suggests that timing control is organized into distinct and dynamically-autonomous modules. Divergence in expression dynamics may be explained by pleiotropic changes in modular timing control. Genome-wide gene regulation may utilize a general architecture comprised of multiple discrete event timelines, whose
superposition could produce combinatorial complexity in timing patterns.
Degree Type Dissertation
Degree Name
Doctor of Philosophy (PhD)
Graduate Group
Genomics & Computational Biology
Keywords
yeast, genomics, evolution, dynamics, heterochrony, modularity
Subject Categories
EVOLUTION OF GENOME-WIDE GENE REGULATION
IN THE BUDDING YEAST CELL-DIVISION CYCLE
Daniel F. Simola
A DISSERTATION
in
Genomics and Computational Biology
Presented to the Faculties of the University of Pennsylvania
in
Partial Fulfillment of the Requirements for the
Degree of Doctor of Philosophy
2009
Junhyong Kim, Dissertation Supervisor
Maja Bucan, Graduate Group Chair
Dissertation Committee
Mark Goulian, Ph.D. (Committee Chair)
Wei Guo, Ph.D.
Vijay Kumar, Ph.D.
Evolution of Genome-wide Gene Regulation
in the Budding Yeast Cell-Division Cycle
COPYRIGHT
2009
Daniel Francis Simola
This work is licensed under the
Creative Commons Attribution-No Derivative Works 3.0 United States License.
Acknowledgements
As someone whose habit it is to think in a breadth-first rather than depth-first manner,
perhaps the most difficult part of graduate school for me was learning how to translate
my thoughts, skills, and interests into specific aims. During the past six years many
peo-ple have assisted me in this regard by offering their encouragement, advice, and support.
Foremost among these are the members of my thesis committee—Mark Goulian, Wei Guo,
Vijay Kumar, Paul Sniegowski, and Junhyong Kim—who oversaw my progress throughout
graduate school, from initially formulating a coherent research project to eventually
grad-uating. Through their varying research interests, they have offered constructive criticism
and helpful advice. Moreover, their enthusiasm for science provided a refreshing influence
on my work. Mark, thank you for being a willing and able committee chair. Paul, thank
you for your discussions about yeast evolution when I first began research. Wei and Vijay,
thank you for providing your encouragement, attention, and time from your busy
sched-ules. Junhyong, you have delivered nothing short of an exceptional mentoring experience.
More than anything I thank you for your patience and for providing ample room for
intel-lectual growth, the chance to explore new concepts and various research interests, and a
flexible work environment. You taught me how to focus on the details, see the big picture,
and then communicate these insights to others. I have never worked with anyone so able
to balance responsibilities, and I will be able to point to your guidance and example in any
I would also like to thank the faculty who taught me in various regards. Maja Bucan and
Jim Eberwine provided great mentoring during laboratory rotations; Maja jump-started my
experience working with gene expression data, and Jim provided cutting-edge opportunities
to develop my wet lab skills. They both offered helpful advice during prelims. Warren
Ewens, Sridhar Hannenhalli, and Sampath Kannan offered their time and talents guiding
me through independent studies.
Chantal, Dexter, Fan, Hoa, Li-San, Miler, Sheng, Shreedhar, and Stephen have all
con-tributed to making our lab a comfortable second home. Chantal’s bright smile boosts the
afternoon mood, and her company and skills in the wet lab made working more enjoyable.
Thank you especially for your initial efforts working with our yeast strains; without them
this dissertation would not have been possible. Dexter, Fan, and Sheng led the way towards
graduation and showed me how to remain persistent to the end. Li-San brought great
en-ergy and enthusiasm to discussions and presentations in the lab. Hoa and Shreedhar have
provided useful insights, advice, and help in the lab. I would have run into many hurdles if
it hadn’t been for Stephen, who has adeptly managed all of our computer and electronics
equipment and any other lab necessities, while tackling his own research projects and
an-other job. He has been incredibly responsive to my questions and needs and is a remarkable
asset to the lab. Miler and I have been like “GCB twins” throughout graduate school; we
started the program together, joined Junhyong’s lab at the same time, got stuck sharing a
windowless concrete closest in Goddard, collaborated on research, and are finally
graduat-ing together. Miler, thank you for your companionship, not to mention your many edible
contributions to the lab.
Miler, Praveen, and Tom have been great friends throughout. They helped take the
stress out of graduate school, helped me pass through various hurdles, and have provided
Helen taught me proper PCR technique and helped generate gene expression data for
the mutation accumulation lines. Cara helped me develop protocols for processing
microar-rays during her rotation in the lab. Overall, it has been a pleasure working with everyone
in the GCB program. Your dedication and drive are what makes this program great.
One of the first things I realized after beginning research was how long it might take
to get to this point. Junhyong has commented that graduate school is essentially an
en-durance test to determine, more than anything else, whether you can follow a question to
its conclusion, while constantly faced with the slow progression of research and the fast
pace of everyday life. Although this challenge obviously applies to students, it inevitably
confronts family as well. I am very grateful to my long-time friend and wife who has been
incredibly receptive of this challenge. Despite my false claims of “finishing soon”, Melissa
has wholeheartedly supported me throughout graduate school with an impressive degree of
patience. I’m not sure how it might have turned out otherwise, but I cannot begin to thank
her enough for how it did. In addition, my parents, Frank and Veronica, have served as a
constant source of support throughout my life; they taught me how to pursue my interests
with hard work.
ABSTRACT
EVOLUTION OF GENOME-WIDE GENE REGULATION
IN THE BUDDING YEAST CELL-DIVISION CYCLE
Daniel F. Simola
Junhyong Kim
Genome-wide regulation of gene expression involves a dynamic epigenetic structure which
generates an organism’s life-cycle. Although changes in gene expression during
develop-ment have broad effects on many basic phenomena including cell growth, differentiation,
morphogenesis, and disease progression, the evolutionary forces influencing gene
expres-sion dynamics and gene regulation remain largely unknown, due to the nature of gene
expression as a polygenic, quantitative trait. Moreover, gene expression is regulated
differ-entially over time, so evolutionary forces may be influenced by developmental context. To
advance the understanding of evolution in the context of the life-cycle, the architecture of
gene expression timing control and its influence on expression dynamics must be revealed.
This dissertation presents two experimental investigations of the evolution of genes and
related structural regions and time-dependent gene expression, using the budding yeasts
cycle as model organism and life-cycle. Comparative methodologies were employed to
analyze genome-wide patterns of genetic and phenotypic diversity within and between
species. Analysis of several dozen yeast genomes reveals a dominant evolutionary mode
of purifying selection. Despite limited genetic variability, differences in transcriptional
regulation appear to contribute predominantly to interspecies divergence, and altered
post-transcriptional regulation of ribosomal genes may have altered the timing of each species’
transition from vegetative growth to reproduction, a classic life-history trait. In addition,
natural variation in genome-wide gene expression was measured as a time-series through
the mitotic cell-division cycle of 10 yeast lines, including one outgroup species. Despite
levels of variation consistent with strong stabilizing selection, transcriptome coexpression
dynamics have diverged significantly within and between species. A model involving
tim-ing pattern changes explains 61% of the between-genome variation in expression
dynam-ics, suggesting that the major mode of transcriptome evolution involves changes in timing
(heterochrony) rather than changes in levels (heterometry) of expression. Analysis of
het-erochrony patterns suggests that timing control is organized into distinct and
dynamically-autonomous modules. Divergence in expression dynamics may be explained by pleiotropic
changes in modular timing control. Genome-wide gene regulation may utilize a general
architecture comprised of multiple discrete event timelines, whose superposition could
Table of Contents
1 Introduction 1
1.1 Background . . . 3
1.1.1 Yeast and its cell-division cycle as model organism and life-cycle . 3 1.1.2 Population structure and evolutionary history ofSaccharomyces . . 5
1.1.3 Genome-scale molecular evolution in yeast . . . 6
1.1.4 Gene expression . . . 8
1.1.5 Evolution of genome-wide gene expression . . . 9
1.1.6 Life-cycle evolution and heterochrony . . . 12
1.2 Overview of Dissertation . . . 13
2 Evolutionary Dynamics of theSaccharomycesGenome and a Resource for Population Genomics 27 2.1 Abstract . . . 27
2.2 Introduction . . . 28
2.3 Results . . . 30
2.3.1 Identification and partitioning of protein-coding loci . . . 30
2.3.2 Heterozygosity within GSR categories . . . 32
2.3.3 Evolution of GSR categories within species . . . 33
2.3.4 Polymorphism and divergence of GSR categories . . . 36
2.4 Discussion . . . 43
2.4.1 Confounding selection with demographics . . . 45
2.4.2 Recombination and linkage disequilibrium . . . 46
2.4.3 Population parameter estimates using neutral loci . . . 47
3 Heterochronic Evolution Reveals Modular Timing Changes in Budding Yeast
Transcriptomes 74
3.1 Abstract . . . 74
3.2 Introduction . . . 75
3.3 Results . . . 76
3.3.1 Genome-wide expression levels show much less variability than expected, but CDC-temporal expression patterns display broad di-vergence . . . 76 3.3.2 CDC regulatory architecture exhibits time-dependent changes in
multi-dimensional complexity . . . 79 3.3.3 Divergence in coregulatory patterns is found at all scales of
tran-scriptome organization . . . 84 3.3.4 A hypothesis for modular timing control . . . 87 3.3.5 Heterochrony explains evolution of expression dynamics . . . 88 3.3.6 Shared patterns of heterochrony reveal modular timing changes . . 89 3.3.7 A modular, pleiotropic regulatory architecture explains CDC
tran-scriptome divergence . . . 100
3.4 Discussion . . . 104
3.5 Materials and Methods . . . 106
4 Conclusions and Future Directions 211
4.1 Future Directions . . . 215
4.2 Conclusion . . . 218
List of Tables
1.1 Genetic variability in proximal promoters of transcription factor loci among woodlandS. cerevisiaeisolates . . . 17
2.1 Differences in estimates of site heterozygosity and Tajima’s D between species . . . 56 2.2 Genes with multiple GSRs under balancing selection . . . 57 2.3 HKA statistics for each GSR category . . . 58 2.4 Number of GO terms rejected by the HKA test within each GSR category . 59 2.5 Number of GSR categories rejected by the HKA test, grouped by GO term . 60 2.6 Polymorphism statistics for GSR categories . . . 61 2.7 Divergence statistics for GSR categories . . . 62 2.8 Controls for the genome identification algorithm . . . 63
2.9 S. cerevisiaepolymorphism statistics using genes common between species 65
2.10 Polymorphism statistics for transposable elements inS. cerevisiae . . . 67
3.1 Natural and laboratory budding yeast isolates used in this study . . . 185 3.2 Ranking of GO terms by proportion of associated genes evolving under
stabilizing selection . . . 186 3.3 Genes with neutral or partly neutral expression trajectories for each
life-cycle related term . . . 188 3.4 Estimates time-dependent transcriptome coexpression structure . . . 190 3.5 Comparison of evolutionary covariance matrices across sequential CDC
timepoints using the common principle components test . . . 192 3.6 Gene enrichments and top 5 genes correlating with major and rank-2
eigen-genes throughout the CDC . . . 193 3.7 Gene enrichment of 88 GO-Slim terms for the top 5% of genes correlating
with major eigengenes throughout the CDC . . . 195 3.8 Ranking of gene groups by total number of genes across the CDC
associ-ated with a particular group . . . 197 3.9 Statistics describing evolutionary divergence of the modular yeast
List of Figures
1.1 Variability in CDC length and cell size in late G1-phase for 10
Saccha-romycesisolates . . . 16
2.1 Genome-wide distribution ofπˆ,θˆ, and Tajima’sDacross GSR categories . 54 2.2 Scatterplot of number of ORFs recovered by the genome identification
al-gorithm versus the whole-genome shotgun coverage of each genome . . . . 55
3.1 Overview of experimental design, analysis, results, and conclusion. . . 135 3.2 Genome-wide evolutionary gene expression variability amongS. cerevisiae
strains through the CDC . . . 136 3.3 Relationship of two components of gene expression variation, time
(tem-poral variation) and strain (strain divergence) . . . 138 3.4 Hierarchical clustering of the entire CDC data set . . . 139 3.5 Profiles for the 40 GO-Slim terms which exhibit the lowest average
propor-tion of genes under stabilizing selecpropor-tion . . . 140 3.6 Visualization of CDC-transcriptomes using 2-dimensional SVD projections 141 3.7 Comparison of cumulative eigenvalue distributions for MA line data (23
samples) and forS. cerevisiaeCDC data at each timepoint (9 samples each) 143 3.8 Cumulative eigenvalue distributions for natural CDC-transcriptomes and
MA lines . . . 144 3.9 Comparison of singular value distributions for theS. cerevisiaeCDC data
(162 samples) and MA line data (23 samples) . . . 146 3.10 Comparison of transcriptome cumulative eigenvalue distributions . . . 147 3.11 Multivariate evolutionary transcriptome variability across the CDC for each
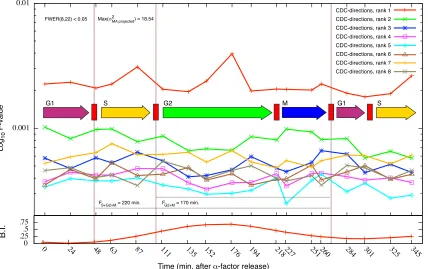
of the top 8 CDC-directions . . . 148 3.12 Temporal variability in CDC-transcriptome evolutionary covariance structure.150 3.13 Angular distance matrices relating pairs of CDC-directions of the same rank 151 3.14 Example projection of expression data onto the top three global
eigenvec-tors ofS. cerevisiae . . . 153 3.15 Heat maps illustrating Mantel matrix correlations between CDC-expression
correlation matrices of natural strains . . . 154 3.16 Evolutionary divergence of CDC-transcriptome coexpression structure within
3.17 Evolutionary divergence of major directions of covariation within
CDC-phase groups . . . 156
3.18 Expected and observed proportions of k-module overlap for increasing numbers of genesk . . . 158
3.19 Heat maps and hierarchical clusterings indicating proportions of overlap between gene modules across strains . . . 159
3.20 Results of the heterochrony regression model explaining time-dependent changes in gene expression trajectories between strains . . . 161
3.21 Frequency distributions of optimal time-domain parameters . . . 163
3.22 Distributions of 95%-equivalent timing curve ensemble sizes and distances between ensembles . . . 165
3.23 Heat maps and timepoint plots illustrating distances between pairs of tim-ing curves . . . 167
3.24 Visualization of timing curve distances by MDS . . . 169
3.25 Linear discriminant distance matrix visualization and timing curves for each cluster. . . 170
3.26 Gap statistic and bootstrap analyses of timing pattern clusters . . . 171
3.27 2-dimensional linear discriminant plots of the distance relationships be-tween timing curves for 4998 heterochronic genes for each of the 45 strain comparisons . . . 173
3.28 Distributions of co-cluster similarity between pairs of genes . . . 174
3.29 Modularity in the heterochronic gene interaction graph . . . 175
3.30 The modular architecture of genome-wide timing control . . . 177
3.31 Linear discriminant visualization of 7 timing pattern clusters . . . 179
3.32 Heat map of modular expression timeline variance . . . 180
3.33 Gene expression timeline variability across the CDC for 1828 timing mod-ule genes . . . 181
3.34 CDC-expression trajectories of genes involved in the timing of the G2 /M-phase transition . . . 182
3.35 Comparison of sequence divergence and expression divergence betweenS. cerevisiaeandS. paradoxus. . . 183
Chapter 1
Introduction
“Only a thorough-going study of variation will lighten our darkness.”
J.B.S. Haldane, 1932
During the last few centuries biology has matured from a science defined primarily by
char-acterizations of morphological (1, 2), embryological (3, 4), molecular (5), and genetic (6)
patterns of variation to one at the crux of a complete evolutionary theory of bio-generative
processes (7, 8, 9, 10). Simply characterizing and comparing the many patterns of variation
in a cell seems a sufficiently great task, one that Robert Hooke began 350 years ago with
hisMicrographia(11), and one that remains far from complete. But to understand the true
diversity of life we must not only systematically consider and compare these patterns, but
use them to discern the underlying evolutionary and developmental processes responsible
for their generation. Understanding this problem of variation must begin by uncovering the
complexity inherent in life’s most fundamental unit, the cell, together with its generative
process, the life-cycle.
The life-cycle is a dynamic process involving growth, reproduction, aging, and death (12,
13) and relates a cell’s development to its genome and evolutionary history (14). While
genomes provide the encoding for life-cycles, expression of this genetic information into
collection of expressed traits resulting from a genome’s time-dependent interactions with
its environment, acts as an integrative filter through which heritable differences pass before
being propagated or extinguished during evolution (17). Changes in the processes that
gen-erate phenotype can not only affect the phenotype itself, but also influence the evolution
of the genotype, such that developmental dynamics give rise to evolutionary dynamics in
the timescale where changes in the life-cycle become encoded into an organism’s genome.
In this way a population’s life-cycle evolves, propagating not only genotype but an entire
system of development (18, 19). Consequently, progress towards a “diachronic”
evolution-ary theory (20) requires investigations into the architecture of phenotypic expression in the
context of the life-cycle.
This integrated approach was first advocated in the early twentieth century by Richard
Goldschmidt, who combined both experimental genetics and comparative embryology to
investigate the role of hereditary factors and their evolution on the expression of
cellu-lar phenotype (21). Despite ignorance of the molecular details of development,
Gold-schmidt emphasized the quantitative and dynamical nature of genes and argued that
dif-ferences in the rates of gene expression, rather than qualitative difdif-ferences in the genes
themselves, contributed substantially to population divergence and speciation (22). Among
Goldschmidt’s contemporaries, Conrad Waddington helped to formalize this notion into a
theory of evolution of developmental systems founded on genes (23), arguing that the
ex-pression and interaction of genes forms a complex, dynamic, and epigenetic process which
instantiates life-cycles from genomes. Since time-dependent gene expression contributes
to life-cycle progression, changes in the expression of and interactions among genes must
contribute to life-cycle variation. Characterizations of the evolution of genes, their
time-dependent expression, and their interactions are thus needed to understand the cellular basis
1.1 Background
1.1.1 Yeast and its cell-division cycle as model organism and life-cycle
The term yeast refers to any unicellular eukaryotic fungi, however in this dissertation yeast
refers specifically to organisms of the genusSaccharomyces, either Saccharomyces
cere-visiae(commonly called budding or baker’s yeast) orSaccharomyces paradoxus(a natural
yeast species). The life history of these yeasts has provided characteristics that greatly
fa-cilitate biological research. Yeast has cells that are small (2–6µM) but easily visible under
a microscope, a short ultradian reproductive cycle, haploid and diploid life-cycle phases
(haplodiplontic), sexual and asexual reproductive modes with two mating types, simple
gene structure, and a compact genome (24, 25). They are easily cultured in a laboratory,
can be frozen and revived for long-term storage, and can metabolize energy using either
respiration or fermentation. This suite of characteristics has led to the adoption of yeast
as a key model organism for studying genetics (26), the cell-division cycle (27), functional
genomics (28), genome evolution (29), and most recently, ecology and evolution (reviewed
in (30, 31)).
The yeast cell-division cycle (CDC) is typical of eukaryotes, comprising four stages or
phases of progression: growth (G1), DNA replication (S), second growth (G2), and mitosis
(M). These phases are separated by molecular checkpoints that monitor successful
comple-tion of each phase (32). In this way, the yeast CDC essentially consists of one long stage
of growth involving duplication of all molecular components, followed by reproduction
by partitioning these components into two cells. This is the minimum required for a
life-cycle (33). Moreover, a cell can sense and coordinate various cellular and environmental
signals to adjust its growth rate, progression through the CDC, and the method and timing
through changes in the regulation of gene expression (35, 36), a necessary component of
developmental progression (37), adaptation (38), and life history evolution (39). For these
reasons I consider the yeast cell-division cycle as a simple model of organism development.
Comparative analysis of the CDC requires maintenance of populations of isogenic cells
in culture. However, the yeast life-cycle has additional modes of reproduction which
com-plicate such analysis. Members ofSaccharomycescan develop as haploids or diploids (one
or two copies of each chromosome) and can reproduce asexually through mitosis or
sexu-ally through meiosis. Mitosis results in the generation of a single daughter cell which buds
off from the original mother cell. Meiosis is sporic and involves one round of diploid cell
division followed by separation of the two diploid cells into four haploid cells (a tetrad of
spores), which are then encased in an environmentally-resistant sac called an ascus. Yeast
has two mating types, called a and α. Mating type is designated by different genes that
can be located in and expressed from the mating type locus (MAT) found on chromosome
III. Yeast must be diploid and heterozygous at the MAT locus in order to sporulate, and
haploid yeast only has one or the other mating type. Thus haploids can arise either from
cell division of an existing haploid or from meiosis of a diploid, while diploids can arise
either from cell division of an existing diploid or conjugation of two haploid cells with
opposite mating types. Moreover, wildtype haploids are able to switch mating types
fol-lowing mitosis (homothallism). In this way, populations founded by a single homothallic
haploid cell have the potential to become sexual. This ability can be disrupted, however,
through the deletion of the HO gene locus, which encodes a DNA endonuclease
respon-sible for interchanging which genes are present at the MAT locus (40). Thus by deletion
of the HO gene followed by forced sporulation to the haploid state, yeast populations can
be maintained isogenically. In addition, haploid cells of one mating type are attracted to
and respond by preparing for conjugation, which in part blocks cells from progressing
be-yond the G1-phase (41). Thus artificial application of mating pheromone to a culture of
isogenic, heterothallic yeast cells can be used to synchronize the majority of cells in the
same CDC-phase within the mitotic cell cycle.
1.1.2 Population structure and evolutionary history ofSaccharomyces
Outside of the laboratory, yeast cells are thought to propagate most often as diploids (42,
43, 44), typically by asexual mitosis (45). They also prefer to mate within-population (46).
On its own, this behavior can lead to the formation of distinct populations which tend
not to exchange genetic information. In addition, geographic isolation (47) of
popula-tions can contribute to the determination and reinforcement of such population structure in
Saccharomyces as well as the species boundary between S. cerevisiae and S. paradoxus.
Examples of populations evolving in this manner are commonly referred to as strains of
yeast. Breweries and vineyards have been implicated in obvious examples of strain-specific
evolution (48), but until recently the extent of reproductive isolation and the (natural and
domestic) occurrence of yeast populations had been unclear, owing to a limited ability to
classify these strains based on phenotypic differences. Instead of phenotypic markers,
Nau-mov (49, 50) used reductions in the viability of hybrid offspring spores to define species
boundaries within theSaccharomyces sensu strictocomplex, in accordance with the
stan-dard biological species concept (51). Sniegowskiet al.(52) isolated and genetically
charac-terized dozens of yeast strains in bothS. cerevisiaeandS. paradoxusfrom two continents,
demonstrating the existence of population structure within species. While S. cerevisiae
has been isolated from a variety of ecological settings,S. paradoxus has only been found
in woodland settings (53). A panmictic (free-mating) mode of reproduction along with
iso-lates demonstrates a continental population structure forS. paradoxus. In contrast,S.
cere-visiae reproduces clonally and rarely mates outside its local population (low outcrossing
rate) (54, 55), and distinct strains coexist at the same location (56).
Multilocus and whole-genome phylogenetic studies (48, 55) have established an
evolu-tionary hierarchy of yeast populations, in which woodlandS. cerevisiaeisolates appear
an-cestral to most human-associated isolates and in general exhibit the most within-strain
ge-netic variability. However, gege-netic characterization of woodland isolates from both species
has revealed overall low levels of polymorphic variation among intronic sequences (57),
suggesting few phenotypic differences and thus limited adaptive evolutionary potential. In
contrast, sequencing of promoter regions of 8 transcription factor loci involved in CDC
progression in woodland strains (Table 1.1) shows a 3.7-fold higher average pairwise
nu-cleotide diversity in promoters (πˆ = 7.08×10⁻³) compared to introns (πˆ= 1.89×10⁻³).
Woodland isolates also exhibit distinct mating preferences (46) and variability in cell size
and CDC length (Figure 1.1), suggesting that this limited genetic variation is expressed
phe-notypically and may be implicated in the life history evolution of woodland populations. In
addition, differences in thermal growth profiles have been found between species (58), and
differential responses to freeze tolerance and copper sulfate exposure exist within species,
between vineyard and woodlandS. cerevisiae isolates (59), further suggesting the
poten-tial for adaptive evolution in yeast. Therefore, the genetic factors responsible for adaptive
evolution may be found by comparative analysis of genomic loci across yeast populations.
1.1.3 Genome-scale molecular evolution in yeast
The genome of the laboratory strain of S. cerevisiae(S288c) (25) is composed of 16
nu-clear chromosomes totaling 12.16 million nucleotides. This genome has 6607 annotated
811 dubious open reading frames (ORFs) (60). The majority of genes encode single
con-tiguous exons, but 316 genes contain single introns (61). Genome sequences have also been
obtained for a few different yeast species, and their comparison has established an overall
high degree of similarity among genomes in theSaccharomyces sensu strictocomplex (62).
Sequence similarity, simple gene structure, and relatively short regions of intergenic
se-quence all facilitate the identification of homologous nucleotide positions genome-wide
across yeast genomes (63). Thus, initial investigations of genome-scale molecular
evolu-tion in yeast have focused on assessing levels of genetic divergence, refining annotaevolu-tions
for gene boundaries, and identifying functional loci (64). Much of the variation found in
yeast genomic DNA appears to be generated by point mutations, rather than by simple
in-sertions, deletions, or larger structural alterations (65), or by gene flow across population
or species boundaries (54, 45).
The ability to focus on identifying and counting alleles generated by point mutation
at individual nucleotides among genomes further simplifies the assessment of
evolution-ary history among yeast genomes. The evolutionevolution-ary forces which influence observed
ge-netic variation can be determined by comparing the amount of variation at a locus to that
expected solely due to random genetic drift following the neutral accumulation of
muta-tions (66). This requires estimating the rate of introduction of new alleles into a
popula-tion by mutapopula-tion (mutapopula-tion rate) as well as the number of generapopula-tions separating the DNA
sequences of interest (divergence time). Patterns of extreme variation in either direction
provide evidence of evolution due to non-random forces, such as natural selection, as
op-posed to genetic drift (67). Alternatively, comparison of the average versus total nucleotide
diversity at a locus can also reveal the effects of selection (68). However, the amount of
genetic variation can also be influenced by non-selective factors, such as a population’s size
a genome (genomic structure) (69), and developmental constraints (developmental
struc-ture) (70). Moreover, different genomic loci possess distinct functional roles in the cell,
such that functional context affects the pattern of genetic variation (71). Proper assessment
of evolutionary history should attempt to control for these factors.
Although comparisons of DNA sequences can be used in this way to infer yeast
evo-lutionary history, it is very difficult, even for yeast, to predict how certain mutations have
affected a cell’s structure, function, molecular complement, dynamics, or ability to
re-produce. In fact, the specific phenotypic effects of most DNA sequences are generally
unknown, especially given the variety of possible environments to which a cell can be
ex-posed (72) and the complexity of a cell’s molecular interactions (73). Directly assessing the
pattern of phenotypic variation complements the use of genetic variation in inferring
evo-lutionary processes, especially in the context of potentially complex modes of evolution,
such as the developmental expression of cellular phenotype.
1.1.4 Gene expression
The expression of cellular phenotype is the result of a complex network of molecular
pro-cesses involved in decoding a cell’s genotype via gene expression events and regulating the
molecules produced. A gene expression event involves the execution of a series of
regula-tory processes, broadly grouped into the transcription of DNA into RNA and the translation
of RNA into protein (74). Transcription initiates when transcriptional regulatory
trans-factors, together with an RNA polymerase complex, create physical associations near a
gene’s transcription start site, dependent on the sequence and location of transcription
fac-tor binding sequences of DNA, as well as chromatin structure. These associations help to
polymerize a primary RNA transcript from a gene’s DNA sequence. In yeast, the
transcription factor proteins which bind to short, 5–20 nucleotide DNA motifs (75) found
typically within 1000 nucleotides upstream (50) of a gene’s transcription start site (76).
Thus, gene expression events form the basis of cellular (and molecular) phenotype.
In addition to exons, primary transcripts may include introns and untranslated regions
(UTRs) that flank the50 and30 termini. Various post-transcriptional processes (50-capping,
poly-adenylation, intron splicing, degradation) control the maturation of this primary RNA,
producing a mature messenger RNA transcript (mRNA). This transcript can then be
ex-ported from the cell nucleus, transex-ported and spatially localized within the cell, or bound
by ribosomes and translated into one or more proteins. Each protein is then subject to
post-translational regulation, including protein modification, activation, localization, and
degra-dation (74). All of these processes occur simultaneously within a cell, but they are also
necessarily inter-dependent, temporally ordered, and influenced by environmental context.
Thus, gene expression can be viewed as an integrated system of processes, which
inter-act as a complex, dynamical system. I use the term epigenotype to refer to the specific
architecture of gene expression event control encoded by a given cell’s genotype.
1.1.5 Evolution of genome-wide gene expression
Many investigations of the evolution of genome-wide gene expression have focused on
measuring and comparing RNA transcript levels (reflecting the number of RNA transcripts)
present in a cell or tissue (reviewed in (77)), since all of the processes involved in a gene’s
expression are initiated by transcription and since measuring RNA levels genome-wide is
technologically feasible. As with studies of genetic evolution, comparison of gene
expres-sion levels across related individuals or populations can provide insights into an organism’s
evolutionary history (78). However, gene expression is a quantitative trait, such that a
small, discrete number of states. Thus a different approach is required to detect the effects
of evolutionary forces on quantitative traits.
Two recent studies applied the idea of calibrating an observed distribution of expression
levels against an expected distribution obtained after minimizing the influence of natural
selection (79). Rifkinet al. (80) estimated expected distributions of gene expression
lev-els using a set of replicate lines (mutation accumulation lines) of the fruit flyDrosophila
melanogaster, where each line was evolved independently for 200 generations at a small
population size (thereby minimizing the effects of natural selection). Comparison of a
gene’s observed expression variance among naturally-evolving flies with its expected
vari-ance among mutation accumulation lines provided a test for natural selection. They found
that “although spontaneous mutations have the potential to generate abundant variation
in gene expression, natural variation is relatively constrained.” Denver et al. (81)
per-formed a similar experiment using naturally-occurring species and experimental
mutation-accumulation lines of the nematode worm Caenorhabditis elegans. They concluded that
“strong stabilizing selection dominates the evolution of transcriptional change for
thou-sands of C. elegans expressed sequences.” Thus, negative or stabilizing natural selection
appears to be the dominant mode of evolution operating on gene expression levels in these
multicellular organisms, the effect of which is to limit the observed variation in the levels
of gene expression across individuals.
Although these studies only recently verified the operation of stabilizing selection on
genome-wide gene expression, the theory that stabilizing selection dominates phenotypic
evolution in general was first promulgated in the mid-1900s by Waddington (82) and
Schmal-hausen (83), generally in the context of multicellular developmental processes such as
mor-phogenesis. In contrast to the perspective that genes are autonomous entities, subject to
levels), they saw genes as parts that are coupled in pathways and networks which
consti-tute developmental processes (23, 84, 83). Consideration of the epigenotype in this way
led Waddington and Schmalhausen to suppose that stabilizing selection should dominate
phenotypic evolution during organism development, because an evolutionary account of
the diversity of species types requires that an organism recreate its developmental process
reliably. Consequently, stabilizing selection could ensure stable expression of genes during
development, while permitting changes during adult life-cycle phases by means of
direc-tional selection (85).
A gene’s capacity to exhibit phenotypic variation (variability) can be assessed by
ob-serving its level of expression in different environments or genotypes (17). Limited
ex-pression level variation in a particular gene despite these perturbations reflects the
epigeno-type’s ability to buffer against genetic or environmental changes (86). Holding genotype
or environment constant, phenotypic variability can also be monitored throughout
devel-opment, where changes in the magnitude or direction of variation as a function of time
reveal an epigenotype’s complexity due to the structure, composition, or dynamics of
de-velopment (70, 87). Using a constant environment, Rifkin et al. (80) found differential
variability in genome-wide gene expression at two developmental stages of the fly,
con-cluding that developmental context affects gene expression evolution. In addition, analysis
of primate species (88) revealed that although stabilizing selection appears to influence a
large number of genes, evolution of gene expression for certain classes of genes, notably
transcription factors, appears more variable in humans compared to other primates. These
observations argue that the effect of stabilizing selection depends on an organism’s
posi-tion in the life-cycle and suggest that changes in the regulaposi-tion of gene expression play an
important role in gene expression evolution, as expected if the theories of Waddington and
There are actually two distinct but related modes of negative selection that operate on
phenotypic variation: stabilizing selection, which directly limits a population’s expressed
variation in a trait; and canalizing selection or canalization, which indirectly limits
ex-pressed variation by constraining the underlying developmental process which generates
the possible trait variants (89, 17). While both modes result in decreased phenotypic
varia-tion, canalization achieves this by altering a trait’s capacity to exhibit variation (variability).
Distinguishing between these modes has proven to be a difficult task, since simply
com-paring levels of natural variation to those expected without the influence of selection is not
sufficient to distinguish whether the underlying phenotypic variability has changed (17).
Nevertheless, examples of canalization have been identified experimentally (82, 90), and
more recently canalization has been implicated in the evolution of genome-wide gene
ex-pression (80).
The evolution of genome-wide gene expression in natural yeast populations has not yet
been characterized, but these previous studies predict that yeast gene expression may evolve
by stabilizing selection, as in other multicellular organisms. Moreover, since the yeast cell
cycle is developmentally robust to environmental and genetic perturbations (72, 91, 35) and
serves a critical role as the most fundamental developmental process for the construction
of multicellular organisms, temporal patterns of genome-wide gene expression may also
exhibit signatures of canalization.
1.1.6 Life-cycle evolution and heterochrony
Waddington’s perspective that “changes in genotypes only have ostensible effects in
evo-lution if they bring with them alterations in the epigenetic processes by which phenotypes
come into being” (84) holds genome evolution in a broader context of the evolution of
Beer’s concept of heterochrony (92) becomes relevant. de Beer argued that heterochrony,
or change in the relative timing between developmental processes, serves as the
domi-nant mode of life-cycle evolution, and he developed a framework to classify the effects of
different kinds of heterochrony (4). Seeing development as a composition of inherently
modular processes, de Beer argued that ultimately there exist only two sources of
evo-lutionary change in ontogeny, the introduction of a novel process or the alteration of an
existing process, and that they can occur within any developmental module. Drawing from
Goldschmidt’s work, he proposed a mechanism for heterochrony involving changes in the
expression of genes which determine the rates of developmental processes (93). Although
both the biological mechanisms of gene expression and de Beer’s heterochrony
classifica-tion scheme have been substantially revised in recent decades (15,94,95,96), heterochronic
evolution of molecular gene expression levels across related species has been observed and
associated with life-cycle evolution (97). Changes in the timing of gene expression
dur-ing development (brought about for example by genetic mutation) may thus contribute to
evolutionary change, offering a possible explanation for broad changes in gene
expres-sion associated with adaptation among highly related populations, as have been shown in
yeast (98).
1.2 Overview of Dissertation
Genome-wide regulation of gene expression involves a dynamic epigenetic structure which
generates an organism’s life-cycle. Although changes in gene expression during
develop-ment have broad effects on many basic phenomena including cell growth and
differentia-tion (34, 99), morphogenesis (100), and disease progression (101), the evolutionary forces
to the nature of gene expression as a complex, quantitative trait (102). Moreover, since
gene expression is regulated differentially over time, the effects of evolutionary forces may
be influenced by developmental context. To advance the understanding of evolution in the
context of the life-cycle, this dissertation presents two experimental investigations of the
evolution of genes and related structural regions and time-dependent gene expression,
us-ing the buddus-ing yeastsSaccharomyces cerevisiaeandSaccharomyces paradoxusand their
mitotic cell-division cycles as model organism and life-cycle. Comparative methodologies
are employed to analyze genome-wide patterns of genetic and phenotypic diversity within
and between species.
Chapter 2 of this dissertation describes the application of population genetics
method-ology to recent genome sequencing efforts, in order to investigate the evolutionary history
of the yeast genome. Although systematic population genetic accounts of yeast
evolution-ary history have been made (69, 48, 47, 45), they preceded the availability of entire genome
sequences and instead focused on relatively small, multilocus samples of the genome.
Re-cently, the complete genome sequences of several dozen isolates of two species of budding
yeast became available (55), providing an opportunity to study the evolutionary history of
the entire yeast genome within and between two closely related species. With Junhyong
Kim, I identified the protein-coding genes within each genome sequence and subdivided
each gene into a collection of genic structural regions. Distinguishing among structural
regions allowed us to characterize the evolutionary history of different regions within each
gene and differentiate between modes of evolution constrained by a region’s functional
context.
In chapter 3, the focus shifts from the evolution of the DNA-based encoding of genes
to evolution of their expression. Recent studies have verified the theory of stabilizing
the strength of stabilizing selection on gene expression levels may be influenced by an
or-ganism’s developmental stage. Although various studies have used yeast to investigate the
effects of environmental (72), genetic (104), and developmental (105, 35) factors on gene
expression, the evolution of gene expression among natural yeast populations (106), and
the properties of the epigenotype which influence gene expression evolution (107, 108),
no study has considered whether genome-wide gene expression exhibits time-dependent
signatures of evolutionary variability, which could demonstrate clearly whether natural
se-lection is influenced by organism development. In addition, no study has yet
character-ized natural genome-wide gene expression variability in yeast (but see (107) for a study of
mutational variation). With Chantal Francis, Paul Sniegowski, and Junhyong Kim, I
mea-sured natural variation in mRNA gene expression as a genome-wide time-series through
the mitotic cell-division cycle of nine closely related woodland lines of the budding yeast
S. cerevisiae and one outgroupS. paradoxus. We analyzed this multi-genome time-series
data set using comparative genomics approaches to characterize time-dependent signatures
of evolutionary gene expression variation, elucidate the modes of evolution affecting gene
expression, and propose a model for the time-dependent architecture of the yeast
epigeno-type. In analyzing these time-series data we viewed the yeast cell-division cycle as a simple
developmental and complex dynamical system, with regular schedules of molecular
exe-cution (32, 109), robustness to perturbations (72, 91, 35), and well-defined end goal of cell
replication and division.
Chapter 4 of this dissertation provides a brief summary of all research findings,
com-ments about methodological limitations, and possible future directions of research that stem
3.0 3.2 3.4 3.6 3.8 200
220 240 260
18° C, SD medium Modal Cell Size (um)
Cycle length (min)
D
A B
B A
C B C
A
E
183
2055
2060
2066 2067
2073 2079 3060
3137
3395
YPS Strain
Neutral haplotype
Figure 1.1: Variability in CDC length and cell size in late G1-phase for 10Saccharomyces
isolates
The 10 yeast isolates are MATa haploid and include 8 woodland isolates and 1 laboratory
strain (183) ofS. cerevisiaeand 1 woodland isolate ofS. paradoxus(3395) (see Table 3.1).
Isolates are identified by name and by haplotype group. Haplotype groups A, B, and C
denote woodlandS. cerevisiaeisolates (57). Measurements were made on cultures of each
isolate grown in 18◦C minimal medium (SD). Late G1-phase cell size was estimated during
α-factor arrest using a Coulter counter. There are 5 biological replicate measurements of
cell size for each isolate culture. Cell size varies significantly among the 8 woodland S.
cerevisiaeisolates (ANOVA,P <0.05). CDC length was estimated using a damped
sine-wave regression on the budding index of each isolate, followingα-factor arrest and release.
Table 1.1: Genetic variability in proximal promoters of transcription factor loci among woodlandS. cerevisiaeisolates
Locus Length S S/length (×10−3) π(×10−3)
Far1 50 720 2.0 8.61 3.84
Far1 30 600 7.0 14.63 8.06
Mbp1 50 660 1.0 4.64 3.73
Ifh1 50 822 10.0 14.83 7.60
Whi5 50 406 6.0 19.66 12.90
Whi3 50 546 1.0 1.83 0.98
Sfp1 50 540 10.0 18.52 9.52
Sfp1 30 375 7.0 18.67 9.98
Average 584 5.5 12.67 7.08
The DNA sequence of each locus was obtained for 8 haploid woodlandS. cerevisiae
iso-lates (see Table 3.1). Sequences correspond to the proximal (flanking) 50 or30 noncoding
region adjacent to a protein-coding locus, as indicated. Comparison of 3 S. cerevisiae
genomes (S288c, RM11-1a, YJM789) indicated that these loci harbor elevated levels of
genetic variation, suggesting that they are also polymorphic among woodland populations.
Length reports the number of nucleotides sequenced. S is the total number of segregating
sites within a locus. S/length is the per-nucleotide fraction of segregating sites, reported per
kilobase of sequence.πis the average per-nucleotide pairwise sequence diversity, reported
per kilobase of sequence. π values were computed by aligning all pairs of sequences
us-ing global alignment, countus-ing the number of identical nucleotides for each pair, averagus-ing
References
1. von Linn´e, C. Systema Naturae per Regna Tria Naturae, Secundum Classes,
Or-dines, Genera, Species, cum Charateribus, Differentiis, Synonymis, Locis. Holmiae:
Impensis Direct, (1758).
2. Haeckel, E. H. P. A.Generelle Morphologie der Organismen: allgemeine Grundz¨uge
der organischen Formen-Wissenschaft, mechanisch begr¨undet durch die von Charles
Darwin reformirte Descendenz-Theorie. G. Reimer, Berlin, (1866).
3. Baer, K. E. v.Uber Entwickelungsgeschichte der Thiere; Beobachtung und Reflexion¨ .
Bei den Gebr¨udern Borntr¨ager, K¨onigsberg, (1837).
4. De Beer, G. Embryology and Evolution. The Clarendon Press, Oxford, (1930).
5. Kimura, M. Nature217(5129), 624–626 (1968).
6. Frazer, K. A., Ballinger, D. G., Cox, D. R., et al. Nature449(7164), 851–861 (2007).
7. Lande, R. Evolution30(2), 314–334 (1976).
8. Gould, S. J. Paleobiology6(1), 119–130 (1980).
9. Lynch, M. Evolution40(5), 915–935 (1986).
10. Hall, B. K., Pearson, R. D., and M¨uller, G. Environment, Development, and
11. Hooke, R. Micrographia: or Some Physiological Descriptions of Minute Bodies
Made by Magnifying Glasses with Observations and Inquiries thereupon. John
Mar-tyn and James Allestry, November (1664).
12. Bonner, J. T. Size and Cycle: An Essay on the Structure of Biology. Princeton
University Press, (1965).
13. Stearns, S. C. The Evolution of Life Histories. Oxford University Press, New York,
NY, (2004).
14. Laubichler, M. D. and Maienschein, J., editors. From Embryology to Evo-Devo: A
History of Developmental Evolution. The MIT Press, Cambridge, MA, (2007).
15. Gould, S. J. Ontogeny and Phylogeny. Harvard University Press, Cambridge, MA,
(1977).
16. Raff, R. A. The Shape of Life: Genes, Development, and the Evolution of Animal
Form. University of Chicago Press, Chicago, IL, (1996).
17. Willmore, K. E., Young, N. M., and Richtsmeier, J. T. Evolutionary Biology 34,
99–120 (2007).
18. Gerhart, J. and Kirschner, M. Cells, Embryos, and Evolution: toward a Cellular and
Developmental Understanding of Phenotypic Variation and Evolutionary
Adaptabil-ity. Blackwell Science, Malden, MA, (1997).
19. Oyama, S., Griffiths, P. E., and Gray, R. D. Cycles of Contingency: Developmental
Systems and Evolution. MIT Press, Cambridge, MA, (2001).
20. Waddington, C. H.The Evolution of an Evolutionist. Cornell University Press, Ithaca,
21. Goldschmidt, R. The Scientific Monthly46(3), 268–273 (1938).
22. Goldschmidt, R.The Material Basis of Evolution. Yale University Press, New Haven,
CT, (1982).
23. Waddington, C. H. Nature147, 108–110 (1941).
24. Ringo, J. Fundamental Genetics. Cambridge University Press, New York, (2004).
25. Goffeau, A., Barrell, B. G., Bussey, H., et al. Science274(5287), 546, 563–7 (1996).
26. Mortimer, R. K. and Hawthorne, D. C. Annu. Rev. Microbiol.20, 151–168 October
(1966).
27. Hartwell, L. H., Culotti, J., Pringle, J. R., and Reid, B. J. Science183(4120), 46–51
(1974).
28. Giaever, G., Chu, A. M., Ni, L., et al. Nature418(6896), 387–391 (2002).
29. Dujon, B., Sherman, D., Fischer, G., et al. Nature430(6995), 35–44 (2004).
30. Replansky, T., Koufopanou, V., Greig, D., and Bell, G. Trends Ecol Evol23(9), 494–
501 (2008).
31. Landry, C. R., Townsend, J. P., Hartl, D. L., and Cavalieri, D. Mol Ecol15(3), 575–
591 (2006).
32. Hartwell, L. H. and Weinert, T. A. Science246(4930), 629–634 (1989).
33. Gilbert, S. F. Developmental Biology. Sinauer Associates, Inc., 6th edition, (2000).
35. Orlando, D. A., Lin, C. Y., Bernard, A., et al. Nature453(7197), 944–947 (2008).
36. Soranzo, N., Zampieri, M., Farina, L., and Altafini, C.BMC Syst Biol3(18) February
(2009).
37. Hamatani, T., Carter, M. G., Sharov, A. A., and Ko, M. S. H. Dev Cell6(1), 117–131
(2004).
38. Lopez-Maury, L., Marguerat, S., and Bahler, J. Nat Rev Genet9(8), 583–593 August
(2008).
39. Sangster, T. A., Lindquist, S., and Queitsch, C. Bioessays26(4), 348–362 (2004).
40. Herskowitz, I. Microbiol Rev52(4), 536–553 (1988).
41. Chan, R. K. and Otte, C. A. Mol Cell Biol2(1), 21–29 (1982).
42. Johnson, L. J., Koufopanou, V., Goddard, M. R., Hetherington, R., Sch¨afer, S. M.,
and Burt, A. Genetics166, 43–52 January (2004).
43. Gerstein, A. C., Chun, H.-J., Grant, A., and Otto, S. P. PLoS Genet2(9) (2006).
44. Mortimer, R. K., Romano, P., Suzzi, G., and Polsinelli, M. Yeast10(12), 1543–1552
(1994).
45. Tsai, I. J., Bensasson, D., Burt, A., and Koufopanou, V. Proc Natl Acad Sci U S A
105(12), 4957–4962 (2008).
46. Murphy, H. A., Kuehne, H. A., Francis, C. A., and Sniegowski, P. D. Biol Lett2(4),
47. Kuehne, H. A., Murphy, H. A., Francis, C. A., and Sniegowski, P. D.Curr Biol17(5),
407–411 (2007).
48. Fay, J. C. and Benavides, J. A. PLoS Genet1(1), 66–71 (2005).
49. Naumov, G. Journal of Industrial Microbiology17, 295–302 (1996).
50. Fischer, G., James, S. A., Roberts, I. N., Oliver, S. G., and Louis, E. J. Nature
405(6785), 451–454 (2000).
51. Mayr, E. Systematics and the Origin of Species. Columbia University Press, New
York, (1942).
52. Sniegowski, P. D., Dombrowski, P. G., and Fingerman, E. FEMS Yeast Res 1(4),
299–306 (2002).
53. Naumov, G. I., Naumova, E. S., and Sniegowski, P. D. Can J Microbiol44, 1045–
1050 (1998).
54. Ruderfer, D. M., Pratt, S. C., Seidel, H. S., and Kruglyak, L. Nat Genet38(9), 1077–
1081 (2006).
55. Liti, G., Carter, D. M., Moses, A. M., et al. Nature458(7236), 337–341 (2009).
56. Koufopanou, V., Hughes, J., Bell, G., and Burt, A. Philos Trans R Soc Lond B Biol
Sci361(1475), 1941–1946 (2006).
57. Kuehne, H. A. The Genetic Structure and Biogeography of Natural Saccharomyces
Populations. PhD thesis, University of Pennsylvania, (2005).
58. Sweeney, J. Y., Kuehne, H. A., and Sniegowski, P. D. FEMS Yeast Res4(4-5), 521–
59. Fay, J. C., McCullough, H. L., Sniegowski, P. D., and Eisen, M. B.Genome Biol5(4),
R26 (2004).
60. SaccharomycesGenome Database. January (2008).
61. Lopez, P. J. and Seraphin, B. Nucleic Acids Res28(1), 85–86 (2000).
62. Kellis, M., Birren, B. W., and Lander, E. S. Nature428(6983), 617–624 (2004).
63. Conant, G. C. and Wolfe, K. H. Genetics179(3), 1681–1692 (2008).
64. Kellis, M., Patterson, N., Endrizzi, M., Birren, B., and Lander, E. S. Nature423May
(2003).
65. Lynch, M., Sung, W., Morris, K., et al.Proc Natl Acad Sci U S A105(27), 9272–9277
(2008).
66. Li, W.-H. Molecular Evolution. Sinauer Associates, Sunderland, MA, (1997).
67. Gillespie, J. H.Population Genetics: A Concise Guide. The Johns Hopkins University
Press, Baltimore, second edition, (2004).
68. Tajima, F. Genetics123, 585–595 November (1989).
69. Fay, J. C. and Benavides, J. A. Genetics170August (2005).
70. Smith, J. M., Burian, R., Kauffman, S., et al. The Quarterly Review of Biology60(3),
265–287 September (1985).
71. Cliften, P., Sudarsanam, P., Desikan, A., et al. Science301(5629), 71–76 July (2003).
72. Gasch, A. P., Spellman, P. T., Kao, C. M., et al. Mol Biol Cell 11(12), 4241–4257
73. Goll, J. and Uetz, P. Genome Biol7(6), 223 (2006).
74. Lewin, B. Genes VII. Oxford University Press, Oxford, (2000).
75. MacIsaac, K. D., Wang, T., Gordon, D. B., Gifford, D. K., Stormo, G. D., and
Fraenkel, E. BMC Bioinformatics7, 113 (2006).
76. Beer, M. A. and Tavazoie, S. Cell117(2), 185–198 (2004).
77. Gilad, Y., Oshlack, A., and Rifkin, S. A. Trends Genet22(8), 456–461 (2006).
78. Oleksiak, M. F., Churchill, G. A., and Crawford, D. L. Nat Genet 32(2), 261–266
(2002).
79. Lynch, M. and Walsh, B. Genetics and Analysis of Quantitative Traits. Sinauer,
Sunderland, MA, (1998).
80. Rifkin, S. A., Houle, D., Kim, J., and White, K. P.Nature438(7065), 220–223 (2005).
81. Denver, D. R., Morris, K., Streelman, J. T., Kim, S. K., Lynch, M., and Thomas,
W. K. Nat Genet37(5), 544–548 (2005).
82. Waddington, C. H. Nature150, 563–565 (1942).
83. Schmalhausen, I. I. Factors of Evolution: the Theory of Stabilizing Selection. The
Blakiston Company, Philadelphia, PA, (1949).
84. Brown, R. and Danielli, J. F., editors. Symposia Of The Society For Experimental
Biology - Number VII Evolution. Academic Press, New York, (1953).
85. Gilbert, S. F. American Zoologist40(5), 729–737 November (2000).
87. Brakefield, P. M. Trends Ecol Evol21(7), 362–368 (2006).
88. Gilad, Y., Oshlack, A., Smyth, G. K., Speed, T. P., and White, K. P.Nature440(7081),
242–245 (2006).
89. Gibson, G. and Wagner, G. Bioessays22, 372–380 (2000).
90. Rutherford, S. L. and Lindquist, S. Nature396(6709), 336–342 (1998).
91. Winzeler, E. A., Shoemaker, D. D., Astromoff, A., and others (52 co authors).Science
285(5429), 901–906 (1999).
92. Rice, S. H. Encyclopedia of Evolution, chapter Heterochrony, http://www.oxford–
evolution.com/entry?entry=t169.e191. Oxford University Press, University of
Penn-sylvania, e-reference edition edition (2005).
93. Brigandt, I. J Exp Zoolog B Mol Dev Evol306(4), 317–328 (2006).
94. Alberch, P., Gould, S. J., Oster, G. F., and Wake, D. B. Paleobiology5(3), 296–317
(1979).
95. Slatkin, M. Evolution41(4), 799–811 (1987).
96. Raff, R. A. and Wray, G. A. J Evol Biol2, 409–434 (1989).
97. Kim, J., Kerr, J. Q., and Min, G. S. Proc Natl Acad Sci U S A97(1), 212–216 (2000).
98. Ferea, T. L., Botstein, D., Brown, P. O., and Rosenzweig, R. F. Proc Natl Acad Sci U
S A96(17), 9721–9726 (1999).
99. Boheler, K. J Cell Physiol221(1), 10–17 (2009).
101. Ross, D. T., Scherf, U., Eisen, M. B., et al. Nat Genet24(3), 227–235 (2000).
102. Rockman, M. V. and Kruglyak, L. Nat Rev Genet7(11), 862–872 (2006).
103. Rifkin, S. A., Kim, J., and White, K. P. Nat Genet33(2), 138–144 (2003).
104. Hughes, T. R., Marton, M. J., Jones, A. R., et al. Cell102(1), 109–126 (2000).
105. Rifkin, S. A., Atteson, K., and Kim, J. Funct Integr Genomics1(3), 174–185 (2000).
106. Townsend, J. P., Cavalieri, D., and Hartl, D. L. Mol Biol Evol20(6), 955–963 (2003).
107. Landry, C. R., Lemos, B., Rifkin, S. A., Dickinson, W. J., and Hartl, D. L. Science
317(5834), 118–121 (2007).
108. Tirosh, I., Reikhav, S., Levy, A. A., and Barkai, N. Science 324(5927), 659–662
(2009).
109. Klevecz, R. R., Li, C. M., Marcus, I., and Frankel, P. H. FEBS J275(10), 2372–2384
Chapter 2
Evolutionary Dynamics of theSaccharomycesGenome
and a Resource for Population Genomics
2.1 Abstract
Background
The evolutionary dynamics of theSaccharomyces sensu strictoclade is understood
incom-pletely. With the release of dozens of yeast genome sequences, it has become possible to
perform a systematic study of the micro and macro-evolutionary dynamics of yeast gene
structure, which should provide broad insights into the interface between micro-evolution
and speciation.
Methodology/Principal Findings
We present a genome-wide analysis of yeast evolutionary dynamics with estimates of
poly-morphism and divergence based on sequence alignments for 10 categories corresponding
to unique genic structural regions for 6,575 S. cerevisiaeand 5,250 S. paradoxus
protein-coding genes from 67 genome sequence assemblies. We find an overall signature of
mod-erate to strong purifying selection within all structural regions of both species, which falls
weakest on the intron and untranslated regions. The differential response of selection to
similar patterns of variation in non-coding proximal and untranslated regions indicates the
influence of genic structural regions on evolutionary mode. Interspecies divergence is
lim-ited overall but elevated in proximal regions, despite evidence of strong purifying selection
there. Although few Gene Ontology terms associate with regions exhibiting excess
diver-gence, the 30 untranslated regions of ribosomal proteins show excess divergence in
com-bination with reduced promoter divergence. Using a subset of neutrally evolving intronic
sequence, divergence time between the two species is an estimated 250,000 years, with
current population sizes of 16 and 42 million forS. cerevisiaeandS. paradoxus. To foster
future comparative and phenotype association studies in yeast, all relevant DNA sequences,
multiple alignments, and statistics are provided through the Budding Yeast Gene Evolution
database (http://yeastpopgenomics.org).
Conclusions/Significance
The genomes in Saccharomyces populations are evolving under moderate purifying
se-lection within species and limited divergence between species. Despite this limitation,
alterations in transcriptional regulation appear to have contributed the most to sequence
divergence between species, while differences in the post-transcriptional regulation of
ri-bosomal genes may have altered the timing of each species’ life-history developmental
transition from vegetative growth to reproduction.
2.2 Introduction
Despite the historical importance of budding yeast in science, industry, and culture, the
past decade. Hundreds ofSaccharomycesstrains have now been isolated from several
envi-ronments, including vineyards, fruit, sak´e fermenters, human hosts, and oak trees (1, 2, 3).
Previous studies found thatS. cerevisiaepopulations appear to segregate by ecotype, within
which levels of genetic diversity vary. Woodland populations generally retain the most
vari-ability and vineyard and sak´e populations the least (4). Woodland isolates ofS. cerevisiae
andS. paradoxus show a high level of inbreeding, but S. cerevisiae appears to reproduce
clonally whileS. paradoxusexhibits sexual reproduction on a continental scale (5).
Con-sequently diversity within geographically similar woodland populations of both species is
low, but has been shown to increase with distance inS. paradoxus(6,7). Moderate levels of
interlocus recombination were found among Pennsylvania oak and vineyardS. cerevisiae
isolates and EnglishS. paradoxusisolates (8, 9). Both sympatric and allopatric isolates of
S. paradoxusyield reduced hybrid ascospore viability, indicative of postzygotic
reproduc-tive isolation within and between continents (10, 6). At the same time mating dynamics
between species differ, suggesting prezygotic barriers exist as well (11).
While these studies analyzed multilocus sequence data from a variety of strains, they
were nevertheless performed using a small subset of the entire yeast genome. With the
re-cent release of genome sequences for several dozenS. cerevisiaeandS. paradoxusstrains (12),
it has become possible to investigate both population and gene structure at a whole-genome
scale. While protein-coding DNA naturally encodes polypeptides, various gene-associated
non-coding sequences are functionally important for the proper production and
mainte-nance of these proteins. These promoters, untranslated regions (UTR), and introns tend
to exhibit unique regulatory roles, so understanding how they are shaped by evolutionary
forces should provide broad insights into the interface between micro-evolution and
speci-ation (13).
Saccha-romycesand provide estimates of polymorphism and divergence based on sequence
align-ments for 10 categories corresponding to unique genic structural regions (GSRs) for 6,575
S. cerevisiaeand 5,250S. paradoxusprotein-coding genes from 39S. cerevisiaeand 28S.
paradoxus publicly available genome sequence assemblies. We analyze patterns of
poly-morphism and divergence to infer natural selection in the context of these GSR categories,
and associate this variation with gene ontology (GO) terms. We discuss the relationship
between evolutionary forces and population structure, and suggest two mechanisms for
species divergence. We also estimate the divergence time between species and population
coalescence times within species. To foster future comparative and phenotype association
studies in yeast, the Budding Yeast Gene Evolution database (http://yeastpopgenomics.org)
has been created to provide access to all relevant DNA sequences, multiple alignments, and
statistics.
2.3 Results
2.3.1 Identification and partitioning of protein-coding loci
We identified an average of 4,236.8 and 3,379.2 open reading frames (ORF) from each of
39S. cerevisiaeand 28S. paradoxuspublicly available genome sequence assemblies (see
Materials and Methods). The original sequences were generated using a whole-genome
shotgun approach, and the majority of sequences have approximately 1× coverage (see
Figure 2.2). After combining sequences from all genomes, we obtained population
sam-ples for 6,575S. cerevisiaeand 5,250 homologousS. paradoxusORFs, comprising 97.9%
and 78.1% of the 6719 ORFs identified in S. cerevisiae, respectively. Although this
in-cludes verified and putative ORFs, as well as transposable (Ty) elements, a Fisher’s Exact