M E T H O D O L O G Y
Open Access
GeneWaltz
–
A new method for reducing the false
positives of gene finding
Kazuharu Misawa
1,2*, Reiko F Kikuno
3* Correspondence: kazumisawa@riken.jp 1Research Program for
Computational Science, Research and Development Group for Next-Generation Integrated Living Matter Simulation, Fusion of Data and Analysis Research and Development Team, RIKEN, 4-6-1 Shirokanedai, Minato-ku, Tokyo 108-8639, Japan
Abstract
Background:Identifying protein-coding regions in genomic sequences is an essential step in genome analysis. It is well known that the proportion of false positives among genes predicted by current methods is high, especially when the exons are short. These false positives are problematic because they waste time and resources of experimental studies.
Methods:We developed GeneWaltz, a new filtering method that reduces the risk of false positives in gene finding. GeneWaltz utilizes a codon-to-codon substitution matrix that was constructed by comparing protein-coding regions from orthologous gene pairs between mouse and human genomes. Using this matrix, a scoring scheme was developed; it assigned higher scores to coding regions and lower scores to non-coding regions. The regions with high scores were considered candidate coding regions. One-dimensional Karlin-Altschul statistics was used to test the significance of the coding regions identified by GeneWaltz.
Results:The proportion of false positives among genes predicted by GENSCAN and Twinscan were high, especially when the exons were short. GeneWaltz significantly reduced the ratio of false positives to all positives predicted by GENSCAN and Twinscan, especially when the exons were short.
Conclusions:GeneWaltz will be helpful in experimental genomic studies. GeneWaltz binaries and the matrix are available online at http://en.sourceforge.jp/projects/ genewaltz/.
Introduction
The complete genome sequences of many organisms, includingHomo sapiens [1,2] and Mus musculus [3], have been published. These studies have revealed that the majority of genes in the mammalian genome comprise non-coding regions and only a small percentage of genes comprise protein-coding regions. Thus, identifying pro-tein-coding regions from nucleotide sequences is an essential step in genome analyses.
Thus far, a large number of computational methods have been developed for the prediction of protein-coding regions to facilitate gene identification studies [4-6]. Most gene prediction methods can be classified into 2 categories:ab initio methods and homology-based methods. The ab initiomethods predict genes solely on the basis of signals of the target sequences and the model of gene structure [7,8]. Homology-based methods employ sequence similarity to known genes or proteins in the databases
[9-11]. Most homology-based methods, such as Twinscan [12], incorporate the algorithms that are used inab initiomethods.
Wang et al. reported that the proportion of false positives among genes predicted by these methods are high, especially when the exons were short [13]. False positives among predicted GENSCAN result in waste of time and resources.
We developed GeneWaltz, a new filtering method for reducing the risk of false posi-tives in gene finding. We focused on the fact that coding regions (CDSs) generally dif-fer from non-coding regions by exhibiting a characteristic substitution pattern because of functional constraints on the protein sequences. For example, synonymous substitu-tions are more frequently observed in CDSs than nonsynonymous substitusubstitu-tions. Gene-Waltz was named after the observation that the DNA sequence alignments of CDSs tend to have a single nucleotide difference after every 3 sites because of the synon-ymous substitutions that are frequently observed at the third positions of codons. By applying the theory of extreme value [14], GeneWaltz identifies candidate CDSs and tests whether these scores are significantly higher than those of the non-coding homo-logous sequences. Although GeneWaltz is a homology-based method, it does not use algorithms that are used in ab initiomethods. GeneWaltz requires the comparison of 2 DNA sequences from different species but does not require any prior models of tran-scription, splicing, or translation.
Algorithm
Scoring scheme
GeneWaltz uses a lod score, which was first introduced by Dayhoff et al. [15], for mea-suring the similarity between 2 amino acids. To derive the lod score of an amino acid, the logarithm of the ratio of the observed frequency of a pair of amino acidsis divided by the random expected frequency of the same pair of amino acids. If the observed and expected frequencies are equal, the lod score is zero. A positive score indicates that a pair of amino acids is commonly observed, whereas a negative score indicates that a pair of amino acids is rarely observed. The general formula for any pair of amino acids is given as
S qij pip j ij= ⎛ ⎝ ⎜ ⎜ ⎞ ⎠ ⎟ ⎟
log , (1)
whereSijis the score of the 2 amino acidsiand j,piandpjare their individual prob-abilities, andqjiis the frequency of the pair of amino acidsiandj.
Because each codon has 3 nucleotides, we used the same scoring scheme for codon pairs
S oijk lmn
eijk lmn
ijk lmn, log , , , = ⎛ ⎝ ⎜ ⎜ ⎞ ⎠ ⎟ ⎟ (2)
where Sijk,lmn is the score of a codon pair ijk and lnm, and i, j, k, l, m, and n
are nucleotides. This scoring scheme is similar to that of Zhang et al.[16]. oijk,lmn and
eijk,lmn are the observed and expected frequencies of the codon pair ijk and lnm,
In order to obtain the observed frequency in equation (2), we used the 7,645 ortholo-gous gene pairs between the human and mouse genome as described by Clark et al. [17]. The alignment of these genes consists of 1,982,115 codons. We obtained the expected frequency of each codon pair from the alignment, and the expected frequency of each codon pair was the average of its observed frequency among the human-mouse orthologous codon pairs. Insertions, deletions, and undetermined sequences were excluded.
Maximal Segment Pair
Let us define the region score as the sum of the individual codon pair scores in an alignment. An example of DNA sequence alignment between the human and mouse genome is shown in Figure 1. Three adjacent nucleotide pairs were treated as 1 codon pair, and the sum of the scores was calculated for all possible aligned regions. A high region score indicated many codon pairs with high scores in that region and suggested that the region was a coding region. GeneWaltz calculates the region scores for all frames in both strands.
Let us also define a Maximal segment pair (MSP) by the highest scoring pair of iden-tical length segments chosen from 2 aligned sequences. The boundaries of an MSP are chosen to maximize its score; therefore, a MSP may be of any length. GeneWaltz heur-istically attempts to calculate the MSP score, which provides a measure of the prob-ability that any pair of sequences is within a protein-coding region. Our interest is in finding whole regions that are likely to be protein-coding regions. We, therefore, define a segment pair to be locally maximal if its score cannot be improved either by extend-ing or by shortenextend-ing both segments.
Cutoff Value of the Score and Significance Level
It should be noted that although coding regions are expected to have high region scores, non-coding regions might have high region scores by chance alone. An impor-tant advantage of the MSP measure is that recent mathematical results allow the statis-tical significance of MSP scores to be estimated under an appropriate random sequence model [12,18].
For GeneWaltz, we developed a statistical test to examine whether the identified region was in actuality a coding region t by estimating the probability that those
regions with a given region score appeared by chance. Karlin and Altschul [12] devel-oped a theory of local alignment statistics for their BLAST search algorithm. Applying their theory, the probability (P) that a non-coding region with its lengthNhas a MSP whose region score is greater thanSby chance is approximately obtained by
P=kNexp(−aS), (3)
where aand k are constants. GeneWaltz can search all locally maximal segment pairs with scores above a specified cutoff. GeneWaltz tests the null hypothesis that the observed DNA sequence is not a protein-coding region by using equation (3).
We determined the values of aand k using computer simulations. Non-coding sequences were generated on the computer, and the GC content was set as 40% because the GC content of human and mouse genomes are approximately 40% [1-3]. Since the nucleotide identity between the human and mouse genome is approximately 70% [19], 30% of the nucleotides of the generated sequences were randomly selected and substituted by different nucleotides that were chosen to keep the average GC con-tent the same. We generated 100 sequences of 100,000 bp. From these generated sequences, the regions with high scores were obtained by the algorithm described above, the number of high-scoring regions was counted, and the scores were recorded.
Figure 2 shows the scatter plot between the proportion of high-scoring regions and their scores. By using the log-linear regression method, kandacan be estimated by the least square method as k= 0.282 anda= 1.219. The regression line is shown in Figure 2.
Performance Evaluation
Materials
To evaluate the performance of gene prediction methods, we used the dataset referred to as Set 1 by Korf et al. [12]. The dataset was downloaded from the Twinscan website http://genes.cs.wustl.edu/. This dataset consists of 68 mouse genomic sequences and their top homologs from the human genome. The dataset was constructed by first
searching the GenBank release 121 for all mouse sequences longer than 30 Kb that had annotated protein-coding regions. Pseudogenes were excluded from the data by search-ing for stop codons and frame shifts. The 68 mouse sequences comprised a total of 7.6 Mb with a mean length of 112 Kb and a median length 98 Kb. The data used to con-struct a codon substitution matrix shared some genes with this data set, but the pro-portion of overlapping genes was small.
Methods
We utilized GENSCAN [7] and Twinscan 1.3 [12] to predict genes using the Huma-nIso.hmat as the parameter matrices and the Twinscan website http://genes.cs.wustl. edu/, respectively. For comparison, we divided the nucleotides into 2 categories: true positives and false positives. True positives were nucleotides of exons with a prediction that matched the annotation, whereas false positive regions were predicted as exons by the gene-finding method, but did not match the annotation. We assessed the perfor-mance of these methods by measuring the positive predictive value, the specificity, and the false positive rate. These values are defined as follows:
The positive predictive valuse true positives
true positive =
ss false positives
The sensitivity true positives
true posit
+ =
iives false negatives
The false positive rate False positiv
+
= ees
true positives false negatives+
(4)
In this paper, the predicted exons did not have to exactly match the true ones, and mismatch at the boundaries was accepted.
All predicted exons obtained by the gene-finding methods were tested by GeneWaltz by setting the cutoff value as P = 0.01. We conducted the chi-square test to compare the ratio of true positives to all positives to examine the effectiveness of GeneWaltz.
We evaluated gene-finding methods in terms of how successfully they identify true CDSs with few false positives, and summarized the results by plotting the partial receiver operating characteristic (partial ROC) curves by using various cutoff values. In order to obtain as many data points as possible, positives and negatives were counted based on the number of nucleotides instead of the number of exons when ROC curves were drawn.
Results
The gene prediction results are shown in Table 1. Of the 3,061 exons predicted by GENSCAN, 1,818 exons were true positives and the rest were categorized as false posi-tives. Of the 2,689 exons predicted by Twinscan, 2,209 exons were true positives and the rest were categorized as false positives.
Table 1 Numbers of True and False Positives in Gene Finding
GENSCAN Twinscan
True Positives False Positives True Positives False Positives
Before GeneWaltz 1818 1243 2209 480
After GeneWaltz 1345 262* 1619 203*
When the exons predicted by GENSCAN were tested by GeneWaltz, 1,345 true posi-tives passed the test but only 262 false posiposi-tives passed the test (Table 1). When the exons predicted by Twinscan were tested by GeneWaltz, 1,619 true positives passed the test but only 203 false positives passed the test. The chi-square test showed that GeneWaltz significantly reduced the ratio of false positives to all positives predicted by both GENSCAN and Twinscan. The MHC genes did not pass the GeneWaltz test (data not shown).
Figure 3 shows the relationship between the ratio of true positives to all positives obtained by gene-finding methods and the exon size. The exon size was measured by the number of codons, not by the number of nucleotides. This figure indicates that predicted genes contained a large number of false positives, especially when exon the length was shorter than 100 codons.
Figure 3 also shows that the positive predictive value was drastically improved by fil-tering these predicted genes by using GeneWaltz. The ratio of true positives to all positives and the exon length improved after filtering using GeneWaltz, especially when the exon lengths were short (Figure 3).
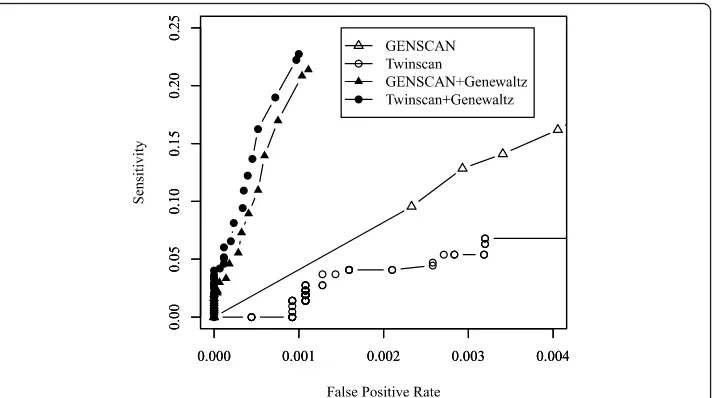
Figure 4 shows the partial ROC curves using Twinscan and GENSCAN across sev-eral thresholds of the GeneWaltz P-value. A partial ROC curve plots the true positive rate for recovering true CDSs on the y-axis and the false positive rate on thex-axis over a range of small values of false positive rates.
Discussion
We developed GeneWaltz, a new filtering method for testing coding regions. The ratio of true positives among all positives will be improved by the GeneWaltz filtering pro-cess, especially when the length of exon is longer than 100 codons.
There must be an open reading frame (ORF) in a region for a gene-finding method to predict a non-coding region as a gene. An ORF is a region between a start and a stop codon in the same frame, and such nucleotide triplets that do not actually code any amino acid sequences can occur by chance in genome sequences. However, ORFs
that do not code amino acids are usually not very long, which is why a large portion of short predicted genes are false positives.
False positives in gene prediction indicate that our knowledge of coding regions is still limited. Studies to further elucidate gene structure information such as splicing sites, promoter regions, starting points for transcription and translation, will improve the accuracy of finding CDSs. However, DNA sequences do not always contain infor-mation about gene structures. For example, short sequences determined by next-gen-eration sequencers [20] may not contain gene structure information. In such cases, GeneWaltz will be helpful for finding genes. The ROC curve showed that a high sensi-tivity was not achieved by GENESCAN and Twinscan by increasing the sensisensi-tivity of these methods by changing the program parameters. However, filtering using Gene-Waltz yielded a high sensitivity.
For this evaluation, we constructed an empirical codon substitution matrix from orthologous gene pairs between mouse and human since we analyzed human genes. We are presently developing a general model of codon substitution [21] so that users can calculate a new scoring matrix using such codon substitution models in the future. GeneWaltz did not detect MHC genes, presumably because the matrix used in this study was an average of many genes whereas MHC genes have evolved under a posi-tive selection pressure and show distinct nucleotide substitution patterns compared to other genes [22]. A specialized matrix might be necessary to detect such extraordinary proteins.
The current version of GeneWaltz are based on the sequence comparison of two species. If we can utilize the comparison of three or more genomes, better results will be obtained. Further studies of comparison of more genomes are required.
GeneWaltz binaries, the matrix, and the user manual are available at http://en. sourceforge.jp/projects/genewaltz/.
Availability and requirements
•Project name:GeneWaltz
•Project home page:http://en.sourceforge.jp/projects/genewaltz/
•Operating systems:Platform independent
•Programming language:Java and C
•Other requirements:None
•License:MIT license
•Any restrictions to use by non-academics:License needed
Acknowledgements
We thank Dr. Osamu Ohara and all members of the Human Genetics Laboratory of Kazusa DNA research institutes for their encouragement and useful comments on the manuscript. The present study was supported by the National Project on“Next-generation Integrated Living Matter Simulation”of the Ministry of Education, Culture, Sports, Science and Technology (MEXT).
Author details
1Research Program for Computational Science, Research and Development Group for Next-Generation Integrated
Living Matter Simulation, Fusion of Data and Analysis Research and Development Team, RIKEN, 4-6-1 Shirokanedai, Minato-ku, Tokyo 108-8639, Japan.2Chiba Industry Advancement Center, 2-6 Nakase, Mihama-ku, Chiba 261-7126, Japan.3Kazusa DNA Research Institute, 2-6-7 Kazusa-Kamatari, Kisarazu, Chiba 292-0818, Japan.
Authors’contributions
KM wrote the software and the manuscript. RFK supervised the project. Both authors read and approved the final manuscript.
Competing interests
The authors declare that they have no competing interests.
Received: 28 February 2010 Accepted: 28 September 2010 Published: 28 September 2010
References
1. Lander ES, Linton LM, Birren B, Nusbaum C, Zody MC, Baldwin J, Devon K, Dewar K, Doyle M, FitzHugh W,et al:Initial sequencing and analysis of the human genome.Nature2001,409:860-921.
2. Venter JC, Adams MD, Myers EW, Li PW, Mural RJ, Sutton GG, Smith HO, Yandell M, Evans CA, Holt RA,et al:The sequence of the human genome.Science2001,291:1304-1351.
3. Waterston RH, Lindblad-Toh K, Birney E, Rogers J, Abril JF, Agarwal P, Agarwala R, Ainscough R, Alexandersson M, An P, et al:Initial sequencing and comparative analysis of the mouse genome.Nature2002,420:520-562.
4. Stein L:Genome annotation: from sequence to biology.Nat Rev Genet2001,2:493-503.
5. Jones SJ:Prediction of genomic functional elements.Annu Rev Genomics Hum Genet2006,7:315-338. 6. Brent MR, Guigo R:Recent advances in gene structure prediction.Curr Opin Struct Biol2004,14:264-272. 7. Burge C, Karlin S:Prediction of complete gene structures in human genomic DNA.J Mol Biol1997,268:78-94. 8. Stanke M, Morgenstern B:AUGUSTUS: a web server for gene prediction in eukaryotes that allows user-defined
constraints.Nucleic Acids Res2005,33:W465-467.
9. Parra G, Agarwal P, Abril JF, Wiehe T, Fickett JW, Guigo R:Comparative gene prediction in human and mouse.
Genome Res2003,13:108-117.
10. Meyer IM, Durbin R:Comparative ab initio prediction of gene structures using pair HMMs.Bioinformatics2002,
18:1309-1318.
11. Meyer IM, Durbin R:Gene structure conservation aids similarity based gene prediction.Nucleic Acids Res2004,
32:776-783.
12. Korf I, Flicek P, Duan D, Brent MR:Integrating genomic homology into gene structure prediction.Bioinformatics2001,
17(Suppl 1):S140-148.
13. Wang J, Li S, Zhang Y, Zheng H, Xu Z, Ye J, Yu J, Wong GK:Vertebrate gene predictions and the problem of large genes.Nat Rev Genet2003,4:741-749.
14. Altschul SF, Gish W, Miller W, Myers EW, Lipman DJ:Basic local alignment search tool.J Mol Biol1990,215:403-410. 15. Dayhoff MO, Schwartz RM, Orcutt BC:A model of evolutionary change in proteins.InAtlas of protein sequence and
structure.Edited by: Dayhoff MO. Washington, D.C.: National Biomedical Research Foundation; 1978:5(3):345-352. 16. Zhang L, Pavlovic V, Cantor CR, Kasif S:Human-mouse gene identification by comparative evidence integration and
evolutionary analysis.Genome Res2003,13:1190-1202.
17. Clark AG, Glanowski S, Nielsen R, Thomas PD, Kejariwal A, Todd MA, Tanenbaum DM, Civello D, Lu F, Murphy B,et al:
Inferring nonneutral evolution from human-chimp-mouse orthologous gene trios.Science2003,302:1960-1963. 18. Karlin S, Altschul SF:Methods for assessing the statistical significance of molecular sequence features by using
general scoring schemes.Proc Natl Acad Sci USA1990,87:2264-2268.
19. Makalowski W, Boguski MS:Evolutionary parameters of the transcribed mammalian genome: an analysis of 2,820 orthologous rodent and human sequences.Proc Natl Acad Sci USA1998,95:9407-9412.
21. Misawa K, Kikuno RF:Evaluation of the effect of CpG hypermutability on human codon substitution.Gene2009,
431:18-22.
22. Hughes AL, Nei M:Pattern of nucleotide substitution at major histocompatibility complex class I loci reveals overdominant selection.Nature1988,335:167-170.
doi:10.1186/1756-0381-3-6
Cite this article as:Misawa and Kikuno:GeneWaltz–A new method for reducing the false positives of gene finding.BioData Mining20103:6.
Submit your next manuscript to BioMed Central and take full advantage of:
• Convenient online submission
• Thorough peer review
• No space constraints or color figure charges
• Immediate publication on acceptance
• Inclusion in PubMed, CAS, Scopus and Google Scholar
• Research which is freely available for redistribution